
1. Background
According to the World Health Organization, infertility is defined as the failure to achieve pregnancy after at least 1 year of unprotected intercourse. It represents a major medical and social challenge, affecting approximately 10 - 15% of couples worldwide and ranking as the third most serious health problem after cardiovascular diseases and cancer (1). In nearly 40% of infertility cases, male-related factors are implicated, with spermatogenic failure being the most common underlying cause (2). One specific manifestation of this condition is asthenozoospermia, which is characterized by reduced sperm motility and accounts for approximately 19% of male infertility cases. This disorder may result from various etiological factors, including varicocele, inflammation, physical and chemical exposures, and endocrine abnormalities (3).
The rapidly increasing global prevalence of obesity is a substantial public health concern and is clearly inversely associated with declining male fertility rates (4). Accumulating evidence indicates that excessive adiposity adversely affects male reproductive function through several interrelated mechanisms, including oxidative stress, apoptosis induction, and disruption of energy metabolism within testicular tissue (5). These pathophysiological alterations collectively contribute to impaired spermatogenesis and reduced sperm quality (6). The parallel rise in obesity prevalence and decline in male fertility observed over recent decades underscores adiposity as a major independent risk factor for compromised reproductive capacity, in addition to its well-established systemic health consequences (7).
Propolis is a resinous, biologically active substance produced by honeybees through the collection of plant exudates, such as saps, resins, and bud secretions, which are subsequently combined with beeswax and endogenous enzymes, including β-glucosidase, from salivary secretions (8). Propolis contains a wide range of phenolic compounds, including catechin, quercetin, and chlorogenic acid, which have demonstrated considerable potential in body weight regulation through multiple biological pathways (9). These bioactive components may contribute to reduced adiposity by increasing energy expenditure, promoting the browning of white adipose tissue, and enhancing lipolytic activity (10). Furthermore, the anti-obesity effects of propolis are mediated through appetite regulation via satiety induction, stimulation of oxidative metabolism, and modulation of adipocyte differentiation and turnover (11). As a rich natural source of these polyphenolic compounds, propolis represents a promising therapeutic candidate for obesity management, particularly given the growing global interest in natural and complementary treatment strategies (12).
2. Objectives
Given the limited clinical evidence regarding the effects of propolis on anthropometric measures and body composition, and in response to recommendations for additional interventional studies, this trial was designed to evaluate the impact of propolis supplementation on these parameters in infertile men diagnosed with asthenozoospermia.
3. Methods
The study population comprised 60 infertile men diagnosed with asthenozoospermia who met the inclusion criteria, defined as total sperm motility below 40% and rapid progressive motility below 32% (13). This randomized, double-blind, placebo-controlled clinical trial was conducted between September 2024 and March 2025 at the Infertility Clinic of Imam Hospital, Ahvaz, Iran.
The exclusion criteria were as follows: allergy to honey and bee products; any known cause of infertility, such as hormonal disorders, obstruction of the epididymal duct, or epididymo-orchitis; substance abuse; alcohol consumption; diabetes mellitus; kidney disease, defined as creatinine levels exceeding twice the upper normal limit; chronic liver disease, defined as transaminase levels exceeding twice the upper normal limit; varicocele; and infectious diseases accompanied by fever and leukocytosis (14).
The study protocol was registered with the Iranian Registry of Clinical Trials (IRCT; registration number IRCT20231123060155N1) and received ethical approval from the Ethics Committee of Ahvaz Jondishapur University of Medical Sciences (ethics approval code: IR.AJUMS.REC.1402.426). The study was conducted in full compliance with the principles of the Declaration of Helsinki. Before participation, all individuals were informed about the study aims, anticipated benefits, and potential health risks, and written informed consent was obtained from all participants before enrollment.
Participants assigned to the propolis group (n = 30) received Iranian propolis at a dose of 500 mg 3 times daily after meals for 12 weeks, whereas participants in the placebo group (n = 30) received visually identical placebo capsules according to the same dosing regimen. The Iranian propolis capsules used in this study were provided by Shahdine Golha Co. (Isfahan, Iran), collected from beehives located in different parts of East Azerbaijan Province during the fall season, and verified by an agricultural organization (15, 16). The daily dose of 1500 mg was selected based on prior clinical trials demonstrating the safety and tolerability of propolis at 1000 - 1500 mg/day and to ensure adequate polyphenol intake for potential metabolic effects (16). Total phenolic content was determined using the Folin-Ciocalteu method, and total flavonoids were measured using the aluminum chloride colorimetric assay with a spectrophotometer at the quality control laboratory of Shahdine Golha Co. Treatment adherence was evaluated by counting returned capsules, with consumption of more than 90% of the allocated supplements considered indicative of adequate compliance. Mean capsule-count adherence was 97.2% ± 2.5% in the propolis group and 96.8% ± 3.1% in the placebo group (P = 0.61).
For monitoring during the 12-week intervention, all participants were instructed to maintain their usual dietary and physical activity habits. Physical activity was assessed using the short form of the International Physical Activity Questionnaire (IPAQ-SF) at baseline and week 12. Dietary intake was evaluated using three 24-hour dietary recalls at baseline and at the end of the study.
Anthropometric assessments were conducted at baseline and at study completion. Participants wore light clothing, were barefoot, and had emptied their bladder before assessment. All measurements were conducted in the morning after an overnight fast of at least 8 hours. In addition, participants were instructed to refrain from strenuous physical activity, alcohol consumption, and sauna use for 24 hours before measurement. Body weight and body composition were measured using a portable, multifrequency bioelectrical impedance analysis (BIA) device (Anea BIA Scale, Model BIA, Iran). Bioelectrical impedance analysis was used to quantify multiple body composition parameters, including intracellular water (ICW), extracellular water (ECW), total body water (TBW), protein mass, mineral mass, FFM, FM, PBF, VFA, and the extracellular-to-total body water ratio (ECW/TBW). During measurements, participants were instructed to remove all metallic objects and place both palms and the soles of their feet directly on the device electrodes, in accordance with the manufacturer's guidelines. In our laboratory, the test-retest reliability of the Anea BIA Scale was assessed in 15 healthy volunteers; the coefficients of variation for FM and VFA were 2.1% and 2.8%, respectively. Standing height was measured without shoes using a stadiometer with a precision of 0.5 cm.
Additional anthropometric indices, including waist circumference, hip circumference, and a Body Shape Index (ABSI), were obtained using a three-dimensional body analyzer (PT-3D FIT, Payatec, Iran) based on time-of-flight technology.
The sample size was determined based on the findings of Gholaminejad et al. (17), using sperm motility as the primary outcome variable. The calculation was performed using MedCalc Statistical Software version 19.6.4, with a power of 95% and a type I error of 5%, yielding 46 cases (23 individuals per group). To account for potential attrition during the study, 30% was added to the calculated sample size, resulting in 30 participants per group. Based on the observed effect sizes and standard deviations, post hoc power calculations indicated that the study had > 80% power (α = 0.05) to detect the between-group differences observed for FM, PBF, and VFA.
Permutation block randomization was used in this study. For this two-group clinical trial, block sizes were randomly selected as 4, 6, or 8, ensuring equal allocation to each group within each block. Random sequences were generated using R software. To ensure allocation concealment, sequentially numbered, opaque, sealed envelopes containing the randomization assignment were used. This method prevented knowledge of the assigned group before participant enrollment, thereby minimizing selection bias.
Placebo and propolis capsules were identical in size, color, volume, and fill weight. Both supplements were packaged in identical containers and labeled only as Drug A and Drug B. The person responsible for packaging, who had no role in study implementation or data analysis, determined the coding, ensuring that the content of each code was unknown to all individuals involved in the trial. Throughout the study, the moderators, including the student, supervisors, and consultants, as well as the patients, remained completely unaware of which supplement each patient received.
Statistical analyses were conducted using SPSS software (version 22). Continuous variables are reported as mean ± standard deviation, whereas categorical variables are presented as frequencies and percentages. Data normality was evaluated using the Shapiro-Wilk test. Baseline comparisons between the intervention and control groups were performed using independent-samples t tests for normally distributed variables and the Mann-Whitney U test for variables with non-normal distributions. For each outcome, the final analysis of covariance (ANCOVA) model included only the baseline value of the outcome as a covariate. Age, BMI, and physical activity level (IPAQ-SF) were not included in the final models because they were well balanced between groups at baseline, and their inclusion did not materially alter the results in sensitivity analyses. Within-group changes from baseline to the end of the intervention were analyzed using paired-samples t-tests for parametric data and the Wilcoxon signed-rank test for nonparametric data. To account for multiple testing of the seven prespecified secondary body composition outcomes (FM, PBF, VFA, FFM, basal metabolic rate, TBW, and ECW/TBW), the Benjamini-Hochberg false discovery rate (FDR) correction was applied; both raw and adjusted q values are reported where applicable. A two-sided P value < 0.05 was considered statistically significant (Table 1).
Table 1.
Characteristics of the Trial Participants a
| Variables | Intervention (N = 30) | Control (N = 30) | P-Value |
|---|---|---|---|
| Education level | 0.150 | ||
| Less than high school | 8 (26.7) | 7 (23.3) | |
| High school diploma | 12 (40.0) | 6 (20.0) | |
| Bachelor’s degree or higher | 10 (33.3) | 17 (56.7) | |
| Job | 0.141 | ||
| Unemployed and self-employed | 11 (36.7) | 11 (36.7) | |
| Indoor/Office-based | 8 (26.7) | 14 (46.7) | |
| Outdoor/Field-based | 11 (36.7) | 5 (16.7) | |
| Smoke | 0.308 | ||
| Never smoke | 22 (73.3) | 24 (80.0) | |
| Current or ex-smoker | 8 (26.7) | 6 (20.0) | |
| Age | 36.28 ± 5.54 | 34.51 ± 5.17 | 0.218 |
| Infertility duration | 5.36 ± 3.88 | 4.59 ± 2.82 | 0.393 |
| Height | 173.53 ± 6.41 | 175.00 ± 5.23 | 0.349 |
| Weight | 86.33 ± 13.67 | 87.51 ± 12.76 | 0.738 |
| BMI | 28.77 ± 5.15 | 28.59 ± 4.023 | 0.882 |
a Values are expressed as No. (%) or mean ± SD.
4. Results
Sixty participants were randomized (n = 30 per group) to receive propolis or placebo for 12 weeks. Of the 60 randomized participants, 57 completed the 12-week intervention (propolis: n = 28; placebo: n = 29). Three participants (2 in the propolis group and 1 in the placebo group) withdrew for personal reasons unrelated to the intervention; their baseline data were carried forward for the intention-to-treat analysis (Figure 1). Baseline demographic and clinical characteristics are summarized in Table 2. There were no statistically significant between-group differences in education level, occupational status, or smoking behavior (P > 0.05). Furthermore, the mean age of participants (36.28 ± 5.54 years in the intervention group vs. 34.51 ± 5.17 years in the placebo group) and the mean duration of infertility (5.36 ± 3.88 vs. 4.59 ± 2.82 years, respectively) were comparable between groups (P > 0.05). Baseline anthropometric measures, including height, body weight, and BMI, also did not differ significantly between the two groups (P > 0.05; Table 2).
Table 2.
Characteristics of the Trial Participants and Between Group Comparison of Pre- and Post-Intervention for Anthropometric and Body Composition Indices a
| Variables and Time Points | Intervention (n = 28) | Control (n = 29) | P-Vblue (Cetween) |
|---|---|---|---|
| Physical activity (MET-min/wk) | |||
| Baseline | 1649.036 ± 1382.289 | 1575.069 ± 1351.692 | 0.839 b |
| 12 weeks | 1738.607 ± 1260.196 | 1518.172 ± 1254.675 | 0.068 c |
| Change | 89.57 ± 359.75 | -56.9 ± 328.41 | 0.114 d |
| P value | 0.199 | 0.359 | |
| Weight (kg) | |||
| Baseline | 86.332 ± 13.669 | 87.51 ± 12.762 | 0.738 b |
| 12 weeks | 85.739 ± 13.422 | 87.81 ± 12.947 | 0.105 c |
| Change | -0.59 ± 2.58 | 0.3 ± 1.41 | 0.109 d |
| P value | 0.235 | 0.261 | |
| Waist-to-hip ratio | |||
| Baseline | 0.871 ± 0.056 | 0.868 ± 0.056 | 0.756 b |
| 12 weeks | 0.844 ± 0.159 | 0.865 ± 0.055 | 0.416 c |
| Change | -0.03 ± 0.15 | 0.003 ± 0.01 | 0.412 d |
| P value | 0.327 | 0.227 | |
| A Body Shape Index | |||
| Baseline | 0.758 ± 0.033 | 0.756 ± 0.029 | 0.682 b |
| 12 weeks | 0.761 ± 0.036 | 0.756 ± 0.031 | 0.446 c |
| Change | 0.003 ± 0.01 | 0.00 ± 0.01 | 0.447 d |
| P value | 0.253 | 0.953 | |
| Waist (cm) | |||
| Baseline | 94.35 ± 10.152 | 93.646 ± 9.023 | 0.938 b |
| 12 weeks | 94.025 ± 10.489 | 93.55 ± 9.483 | 0.617 c |
| Change | -0.33 ± 1.76 | -0.11 ± 1.76 | 0.641 d |
| P value | 0.336 | 0.792 | |
| Abdomen (cm) | |||
| Baseline | 102.607 ± 11.725 | 101.008 ± 10.293 | 0.749 b |
| 12 weeks | 102.196 ± 12.507 | 100.513 ± 10.205 | 0.929 c |
| Change | -0.41 ± 2.01 | -0.5 ± 2.45 | 0.891 d |
| P value | 0.288 | 0.332 | |
| Hip (cm) | |||
| Baseline | 108.182 ± 8.043 | 107.146 ± 6.349 | 0.915 b |
| 12 weeks | 107.971 ± 8.252 | 107.296 ± 6.495 | 0.431 c |
| Change | -0.21 ± 1.78 | 0.15 ± 1.41 | 0.427 d |
| P value | 0.535 | 0.607 | |
| Basal metabolic rate | |||
| Baseline | 1640.461 ± 125.762 | 1603.785 ± 332.281 | 0.586 b |
| 12 weeks | 1654.936 ± 118.502 | 1659.448 ± 132.713 | 0.675 c |
| Change | 14.48 ± 36.99 | 55.66 ± 315.02 | 0.495 d |
| P value | 0.048 | 0.349 | |
| Intracellular fluid (L) | |||
| Baseline | 26.932 ± 2.641 | 27.372 ± 2.724 | 0.538 b |
| 12 weeks | 27.044 ± 2.579 | 27.353 ± 2.787 | 0.248 c |
| Change | 0.11 ± 0.38 | -0.02 ± 0.43 | 0.227 d |
| P value | 0.134 | 0.806 | |
| Extracellular fluid (L) | |||
| Baseline | 16.2 ± 1.617 | 16.466 ± 1.751 | 0.555 b |
| 12 weeks | 16.228 ± 1.572 | 16.419 ± 1.77 | 0.341 c |
| Change | 0.03 ± 0.25 | -0.05 ± 0.29 | 0.304 d |
| P value | 0.564 | 0.391 | |
| Total body water (L) | |||
| Baseline | 43.125 ± 4.257 | 43.835 ± 4.471 | 0.542 b |
| 12 weeks | 43.446 ± 4.418 | 44.206 ± 5.178 | 0.933 c |
| Change | 0.32 ± 1.18 | 0.37 ± 2.46 | 0.921 d |
| P value | 0.161 | 0.423 | |
| Fat-free mass (kg) | |||
| Baseline | 58.482 ± 5.398 | 59.576 ± 6.382 | 0.488 b |
| 12 weeks | 58.945 ± 5.389 | 59.70 ± 6.389 | 0.161 c |
| Change | 0.46 ± 0.82 | 0.12 ± 0.83 | 0.143 d |
| P value | 0.006 | 0.443 | |
| Protein (kg) | |||
| Baseline | 11.639 ± 1.14 | 11.817 ± 1.18 | 0.565 b |
| 12 weeks | 11.676 ± 1.116 | 11.808 ± 1.209 | 0.365 c |
| Change | 0.04 ± 0.19 | -0.01 ± 0.17 | 0.343 d |
| P value | 0.322 | 0.768 | |
| Mineral (kg) | |||
| Baseline | 4.014 ± 0.474 | 4.097 ± 0.514 | 0.533 b |
| 12 weeks | 4.03 ± 0.477 | 4.082 ± 0.493 | 0.390 c |
| Change | 0.02 ± 0.11 | -0.01 ± 0.12 | 0.329 d |
| P value | 0.438 | 0.538 | |
| Fat mass (kg) | |||
| Baseline | 27.95 ± 11.647 | 27.931 ± 9.113 | 0.995 b |
| 12 weeks | 26.915 ± 11.669 | 28.024 ± 9.163 | 0.027 c |
| Change | -1.04 ± 2.3 | 0.071 ± 1.3 | 0.026 d |
| P value | 0.024 | 0.703 | |
| Body fat percentage (%) | |||
| Baseline | 31.214 ± 8.701 | 31.321 ± 6.569 | 0.959 b |
| 12 weeks | 30.23 ± 9.202 | 31.275 ± 6.439 | 0.032 c |
| Change | -0.98 ± 1.99 | -0.054 ± 1.08 | 0.030 d |
| P value | 0.014 | 0.822 | |
| Body mass index | |||
| Baseline | 28.768 ± 5.149 | 28.586 ± 4.023 | 0.882 b |
| 12 weeks | 28.59 ± 5.245 | 28.689 ± 3.997 | 0.116 c |
| Change | -0.18 ± 0.82 | 0.10 ± 0.45 | 0.113 d |
| P value | 0.260 | 0.230 | |
| Visceral fat area (cm 2) | |||
| Baseline | 122.271 ± 50.995 | 122.879 ± 42.607 | 0.961 b |
| 12 weeks | 117.271 ± 50.961 | 125.376 ± 42.576 | 0.003 c |
| Change | -5.00 ± 9.69 | 2.50 ± 8.32 | 0.003 d |
| P value | 0.011 | 0.118 | 0.961 b |
| ECW/TBW | |||
| Baseline | 0.376 ± 0.005 | 0.376 ± 0.004 | 0.892 b |
| 12 weeks | 0.374 ± 0.008 | 0.372 ± 0.017 | 0.668 c |
| Change | 0.002 ± 0.01 | 0.004 ± 0.02 | 0.655 d |
| P value | 0.164 | 0.251 |
a Abbreviations: ECW/TBW, extracellular-to-total body water ratio; MET, metabolic equivalent of task.
b Between-group differences at baseline; P values were calculated using the independent-samples t test.
c Between-group differences after the intervention; P values were derived from analysis of covariance (ANCOVA), adjusting only for the baseline value of the respective outcome.
d Within-group differences; P values were calculated using the paired-samples t test.
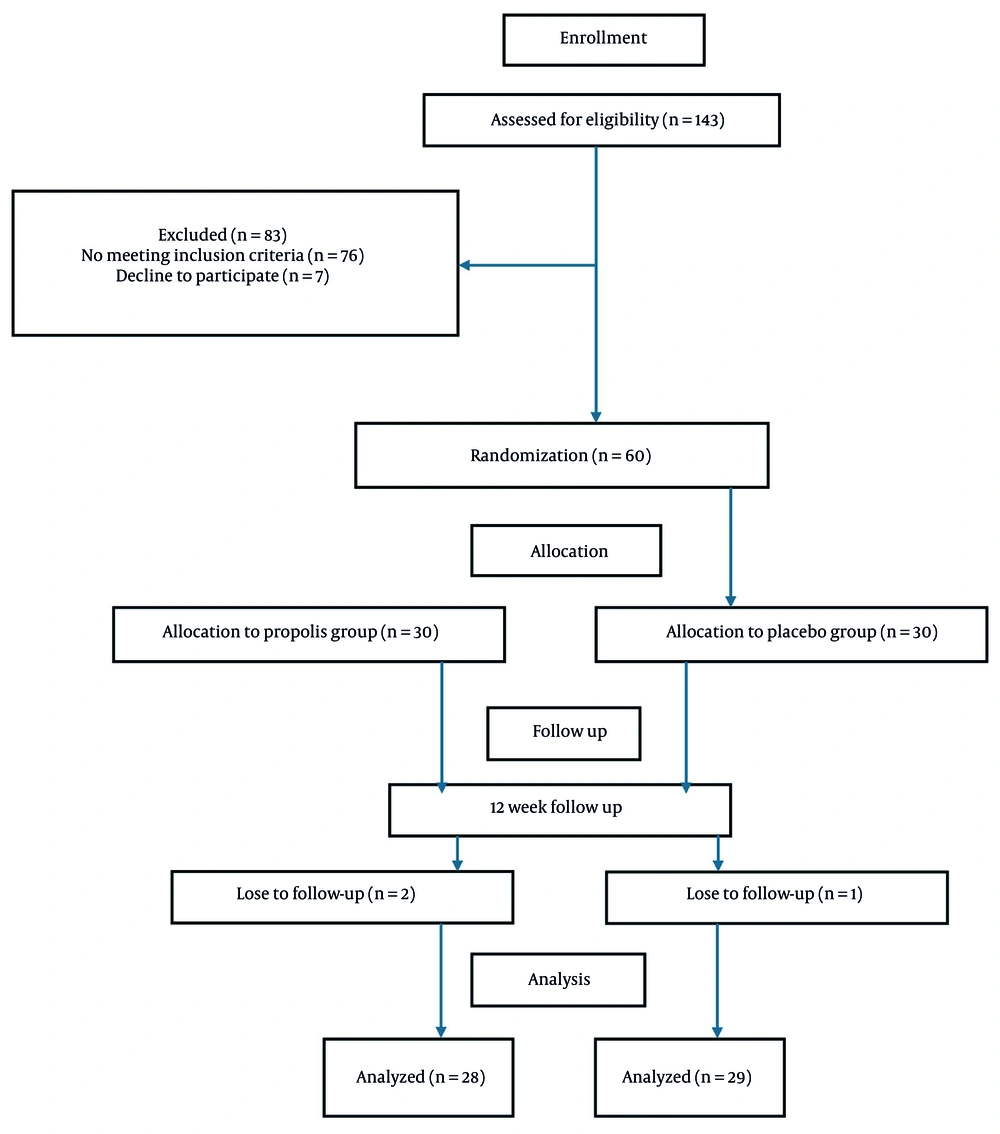
Figure 1.
Consort flow chart of patients' enrollment and follow-up
Dietary intake data are presented in Supplementary Table S1. No statistically significant between-group differences were observed in total energy or macronutrient intake at baseline or after 12 weeks.
Table 2 presents the mean ± standard deviation of anthropometric and body composition indices before and after the intervention in both groups. After applying the Benjamini-Hochberg FDR correction to the seven prespecified secondary body composition outcomes, only the between-group differences in VFA, FM, and PBF remained statistically significant. For VFA, the adjusted between-group difference was -7.6 cm2 (95% CI, -12.1 to -3.1; Cohen d = 0.61; q = 0.009); for FM, -0.92 kg (95% CI, -1.71 to -0.13; Cohen d = 0.42; q = 0.039); and for PBF, -1.05% (95% CI, -2.01 to -0.10; Cohen d = 0.39; q = 0.043). No other outcome, including basal metabolic rate, remained significant after adjustment for multiplicity.
Independent-samples t tests showed no significant between-group differences in baseline values for the studied variables. After 12 weeks of intervention, within-group analyses indicated that the propolis group experienced a significant increase in FFM (P = 0.006) and significant reductions in FM (raw P = 0.024), PBF (raw P = 0.014), and VFA (raw P = 0.011). Basal metabolic rate did not differ significantly between groups at week 12 (ANCOVA-adjusted P = 0.675).
In the intention-to-treat analysis (n = 60) with baseline observation carried forward, the adjusted between-group differences were as follows: FM, -0.92 kg (95% CI, -1.71 to -0.13; P = 0.022); PBF, -1.05% (95% CI, -2.01 to -0.10; P = 0.037); and VFA, -7.6 cm2 (95% CI, -12.1 to -3.1; P = 0.004), confirming the robustness of the per-protocol findings.
After Benjamini-Hochberg FDR correction across the seven prespecified secondary body composition outcomes, only FM, PBF, and VFA retained statistical significance (q < 0.05). The adjusted mean differences, 95% CIs, and effect sizes (Cohen d) for these variables are reported in the Results text.
5. Discussion
The global rise in obesity, driven by modern lifestyle patterns and environmental changes, has become a major public health concern (18), and accumulating evidence links excess adiposity, particularly visceral fat, to impaired male reproductive function and asthenozoospermia (19). Despite growing interest in natural anti-obesity agents, clinical evidence regarding the effects of propolis on body composition remains limited, with most data derived from preclinical models (11). The present randomized, double-blind, placebo-controlled trial was designed to evaluate the effects of 12-week propolis supplementation (1500 mg/day) on anthropometric indices and body composition in men with asthenozoospermia.
Our primary finding was that propolis did not lead to significant reductions in overall body weight, BMI, waist circumference, or waist-to-hip ratio. This finding is consistent with several previous clinical trials (16, 22, 23) and two recent meta-analyses (20, 21), which did not detect meaningful effects of propolis on gross anthropometric measures. However, detailed body composition analysis revealed a favorable shift in tissue partitioning: participants receiving propolis exhibited a significant decrease in FM, PBF, and VFA, along with a significant within-group increase in FFM. After controlling for multiple comparisons using the Benjamini-Hochberg procedure, these between-group differences remained statistically significant. These changes occurred in the absence of any prescribed dietary or exercise intervention, and body weight remained stable in both groups, indicating true body recomposition rather than simple weight loss. This pattern is consistent with recent findings by Kanazashi et al., who reported reductions in absolute and relative fat mass and an increase in relative lean body mass in elderly women supplemented with Brazilian propolis (24).
The observed reduction in VFA, with an adjusted between-group difference of approximately -7.6 cm2, is of particular interest given the well-documented association between visceral adiposity, systemic inflammation, and adverse reproductive hormonal profiles (25, 26). Because no minimal clinically important difference has been established for FM or VFA in infertile men, the clinical relevance of these changes cannot be definitively asserted. However, the observed improvements exceeded the typical measurement error of the BIA device used and are consistent with a favorable metabolic shift.
The within-group increase in basal metabolic rate previously reported has been removed from the Results because the between-group comparisons were nonsignificant (ANCOVA P = 0.675; change score P = 0.495). Therefore, basal metabolic rate is not considered a beneficial effect of propolis.
Several mechanisms have been proposed in preclinical studies to explain the potential fat-loss-promoting effects of propolis, including Artepillin C-induced browning of white adipose tissue (27, 33), AMPK-mediated enhancement of lipid catabolism in skeletal muscle (28, 29), and modulation of the gut microbiome toward a less obesogenic profile (30-32). Propolis constituents such as caffeic acid phenethyl ester may also suppress adipogenesis by downregulating PPARγ and SREBP-1 (34, 35), while concurrently attenuating obesity-associated inflammation through activation of the Nrf2 pathway and inhibition of IKKε/TBK1 signaling (36-39). However, none of these molecular or microbial pathways were directly measured in the present study; therefore, the discussion of mechanisms is speculative and intended only to provide biological context for the observed body composition changes. Future studies incorporating molecular and omics endpoints are needed to validate these pathways.
Notably, the propolis used in this trial was poplar-type propolis, collected from East Azerbaijan Province and chemically characterized, with total phenolic content and flavonoid levels falling within the typical ranges for temperate-region propolis (8, 15). Because propolis composition varies widely by geographical origin and botanical source, our findings should not be directly extrapolated to chemically distinct types, such as Brazilian green propolis or Chinese propolis, without independent verification (9, 11).
An important consideration is that the present report represents a secondary analysis of a parent trial in which the primary outcome was sperm motility, as stated in the IRCT registration. The sample size was prospectively calculated for that primary endpoint (17) and was not formally powered for individual body composition variables. Nevertheless, post hoc power calculations indicated > 80% power for the significant between-group differences in FM, PBF, and VFA. All anthropometric and body composition results reported here should be interpreted as exploratory. The Benjamini-Hochberg correction was applied, and the key findings for FM, PBF, and VFA remained significant; however, confirmatory studies with body composition as the primary outcome are warranted.
Dietary intake and physical activity were monitored using three 24-hour dietary recalls and the IPAQ-SF, respectively, and remained stable across the intervention period. Dietary data are provided in Supplementary Table S1. The absence of weight change indirectly supports the notion that major behavioral confounders were not operating. Nevertheless, subtle uncontrolled variations cannot be entirely ruled out, and future trials should incorporate more intensive dietary control or objective activity monitoring.
5.1. Limitations
Several limitations should be considered. This was a secondary analysis of a parent trial powered for sperm motility; therefore, the body composition findings are exploratory and were corrected for multiple comparisons using the Benjamini-Hochberg procedure. Body composition was assessed using BIA and three-dimensional scanning rather than reference imaging methods; in particular, BIA-derived VFA is not a validated substitute for CT or MRI. Blinding integrity was not formally tested, but because both supplements were provided as identical capsules swallowed whole without chewing, taste and odor differences were effectively masked, making unblinding unlikely. Adherence was monitored by capsule count and self-report without an objective biomarker. An intention-to-treat analysis using baseline observation carried forward was performed and confirmed the per-protocol findings. Mechanistic pathways were not measured, and the results are specific to Iranian men with asthenozoospermia from a single center, limiting generalizability. Finally, although comprehensive reproductive outcomes were collected in the parent trial, they are reported separately; therefore, the present paper does not establish a direct link between body composition changes and fertility improvement.
5.2. Conclusions
Twelve weeks of propolis supplementation at 1500 mg/day did not reduce overall body weight but led to statistically significant, FDR-corrected improvements in body composition, including reductions in FM, PBF, and VFA, with a concomitant increase in FFM. These changes, which were robust in both per-protocol and intention-to-treat analyses, may represent a favorable shift in metabolic risk. However, because the direct link to fertility was not examined in this report and the clinical importance of the observed effect sizes remains to be established, the findings should be considered hypothesis-generating. Further trials with body composition as the primary outcome, validation of visceral fat measurement against reference imaging, and concurrent evaluation of reproductive endpoints are required to determine the therapeutic utility of propolis in infertile men.