
1. Background
Methamphetamine (METH) is a potent psychostimulant that poses major public health and legal challenges. METH can cross the blood-brain barrier because of its small molecular size and lipid solubility. METH induces oxidative stress and neuronal damage in the central nervous system. Moreover, brain structural findings have shown long-term structural alterations in different cortical regions in METH abusers (1). The prefrontal cortex (PFC) is crucially involved in working memory, attention, and cognitive regulation of behavior. In addition, the PFC contributes to inhibiting risky decisions, such as those related to drug craving; however, this function is reduced in drug-dependent patients (2). A significant decrease in gray matter density in the PFC of METH addicts has been reported and was associated with poor executive function in these patients. METH addiction has also been associated with decreased performance in cognition, attention, motivational behaviors, decision-making, memory, and verbal recognition (3).
Resveratrol is a natural phenolic compound found in several common foods, especially grapes and blueberries. Resveratrol has several neuroprotective properties (4, 5). Administration of resveratrol protects neurons against morphological damage and oxidative stress. Moreover, resveratrol inhibits apoptosis in PFC neurons and increases BDNF levels in this area, thereby improving cognitive memory in a mouse model of Alzheimer disease (6). The biological functions of resveratrol are attributed to its antioxidative and anti-inflammatory effects, as well as increased mitochondrial biogenesis (4, 7).
Sirtuin-1 (SIRT1) protein is a crucial intracellular deacetylase involved in antioxidant protection and mitochondrial biogenesis. SIRT1 regulates epigenetic mechanisms to control the transcription of proteins involved in cellular metabolism (8). SIRT1 also influences various cellular processes related to DNA damage and oxidative stress (5, 9). SIRT1 is abundantly expressed in the brain, especially in the PFC and hippocampal regions (10). Downregulation of SIRT1 in the PFC results in increased neuronal damage and oxidative stress and decreased working memory and attention (10).
MicroRNAs (miRNAs) are short noncoding RNAs containing 19 - 24 nucleotides that play crucial roles in the regulation of gene expression (11). Notably, each miRNA has the potential to target many mRNAs, whereas a single mRNA can be targeted by multiple miRNAs, indicating that miRNAs are involved in diverse biological pathways. The transcription levels of several miRNAs are altered following METH use, which could affect the levels of various crucial genes and induce METH neurotoxicity (11).
2. Objectives
This study evaluated the effects of resveratrol on PFC tissue in a rat model of chronic METH use. In addition, we investigated SIRT1 alterations in METH-induced neurotoxicity and in the protective mechanisms of resveratrol. Predicted miRNAs targeting SIRT1 were evaluated following METH toxicity and resveratrol treatment. We also examined the deleterious effects of METH on attention and working memory, two cognitive domains related to the PFC, and assessed the modulation of these effects by resveratrol administration. Morphological changes in PFC neurons following METH and resveratrol treatment were also evaluated.
3. Methods
3.1. Animals and Drugs
Thirty-two male Wistar rats (200 ± 30 g) from the Pasteur Institute were housed at 20 - 22°C and 50% - 70% humidity under a 12-hour light cycle, with ad libitum access to food and water. Before the procedures, the animals underwent a 1-week habituation period. Animals were randomized to treatment groups using block randomization (4 animals per block). Exclusion criteria were illness, movement disorder, or weight loss of more than 20% of the initial weight. No animals were excluded; all completed the experiment, and no deaths, morbidity, or weight loss greater than 20% were observed during the study period. METH was diluted in normal saline and administered subcutaneously at 5 mg/kg in a volume of 1 mL/kg (200 mL for a rat weighing 200 g). Resveratrol (Sigma-Aldrich) was dissolved in 0.5% (w/v) carboxymethyl cellulose (vehicle) and administered at a final dose of 25 mg/kg in a volume of 1 mL/kg. Animals received 5 mg/kg METH or saline once daily between 8:30 and 9 AM. Resveratrol 25 mg/kg or vehicle was administered by oral gavage 30 minutes before the injection (Figure 1). The METH dose was selected based on previous studies showing cognitive impairment without motor dysfunction (10, 12). The resveratrol dose was selected based on previous studies demonstrating protective effects on memory and learning (13, 14). To minimize bias, researchers involved in behavioral, molecular, and histological tests were fully blinded to group assignment during evaluations. Data analysis was performed by another researcher who was unaware of group allocation. Group sizes were determined based on previous studies indicating that n = 8 provided sufficient power to detect the effects of drug treatments (10, 15). To avoid variability due to the estrous cycle and hormonal fluctuations in behavioral and gene-expression assessments (16), experiments were conducted in males. The experiment was performed in accordance with the NIH Guide for the Care and Use of Laboratory Animals and the ethical guidelines of the Ethics Committee of Ahvaz Jundishapur University of Medical Sciences, with ethical code IR.AJUMS.AEC.1404.061.
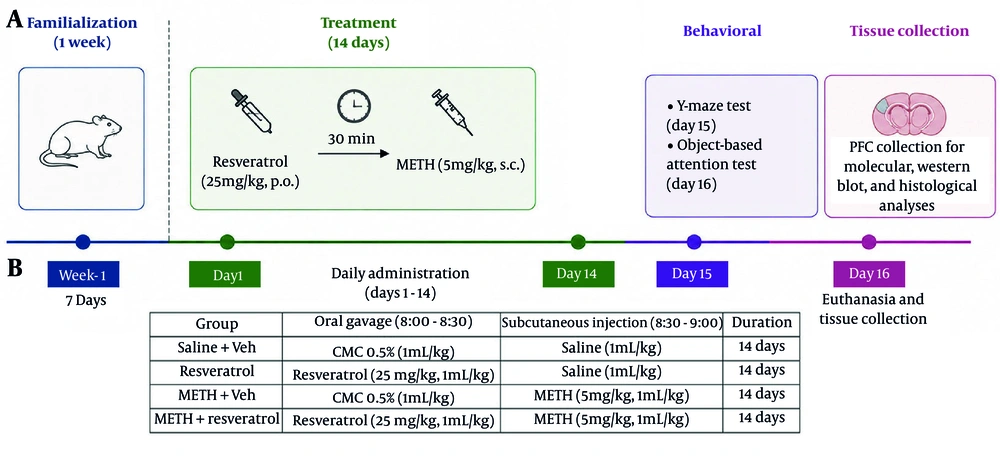
Figure 1.
Treatment timeline and details of experimental processes. Timeline of treatments, behavioral tests, and tissue collection (A). Before starting the procedures, rats underwent a 1-week acclimation period. The animals were randomly divided into 4 groups (n = 8 per group). Animal treatment was performed for 14 consecutive days (B). METH was diluted in normal saline and administered subcutaneously at a dose of 5 mg/kg in a volume of 1 mL/kg. Resveratrol was dissolved in 0.5% carboxymethylcellulose (vehicle) at a dose of 25 mg/kg in a volume of 1 mL/kg. Treatment continued for 14 days. Behavioral tests were performed on days 15 and 16. Then, PFC tissue was removed from 6 animals per group for molecular studies, while the brains of 2 animals per group were fixed for histological studies. Abbreviations: METH, methamphetamine; CMC, carboxymethyl cellulose; Veh, vehicle.
3.2. Working Memory Test
The Y-maze apparatus was made of plexiglass and consisted of 3 arms measuring 15 cm (width) × 30 cm (height) × 40 cm (length). Each rat was placed at the end of one arm with access to the apparatus. The order of arm entries was recorded for 8 minutes. An arm entry was recorded when all 4 paws entered an arm. Spontaneous alternation behavior was defined as consecutive successful entries into all arms within a set of 3 arm entries. The total number of arm entries was used as an index of locomotor function.
3.3. Attention Test
The object-based attention apparatus consisted of an opaque plexiglass box containing 2 chambers: an exploration room (60 cm × 40 cm × 50 cm) and a test room (30 cm × 40 cm × 50 cm). One day before testing, rats were habituated to the apparatus by allowing free exploration of both chambers for 10 minutes. During the acquisition phase, the animal was placed in the exploration room for 5 minutes, where five different objects of the same color were positioned. The exploration duration for each object was recorded. The animals were then immediately moved to the side chamber (test room) for the retention phase. During retention, a previous object was placed in a location analogous to its earlier position, and a new object of a similar color was added parallel to the previous objects. During retention, the animal explored both objects for 5 minutes (Figure 2A). Recognition was calculated as (T new obj × 100) / (T previous obj + T new obj), where T previous obj and T new obj represent the time spent on the previous and new objects, respectively.
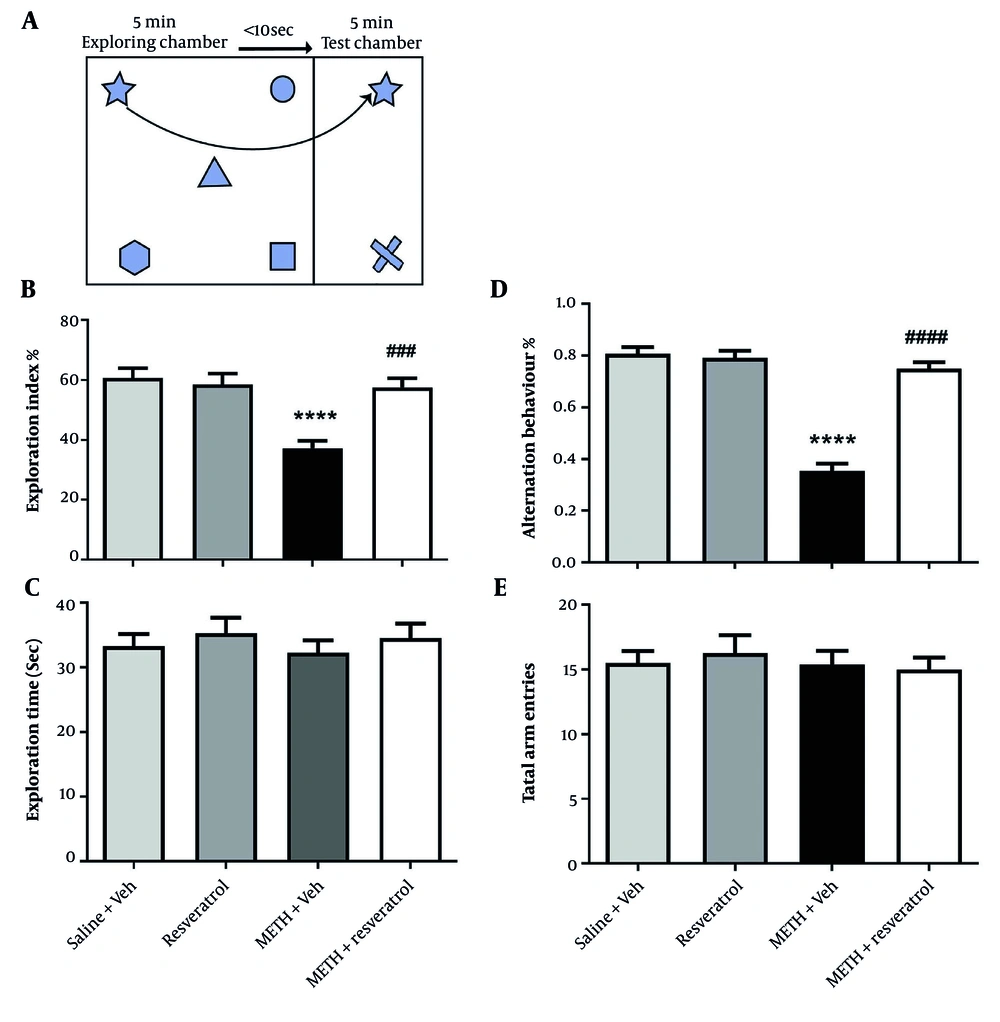
Figure 2.
Assessment of attention by object-based attention test and working memory using the Y-maze. Schematic procedure of the object-based attention test (A). Evaluation of the recognition index in different groups (B). The duration of animal exploration for each object during the acquisition phase is indicated as exploration time (C). The effect of METH injection and resveratrol administration on alternation behavior (D) and total arm entries (E) during the Y-maze test are presented. **** P < 0.0001 compared with the Saline + Veh group; ### P < 0.001 and #### P < 0.0001 compared with the METH + Veh group; n = 8 in each group.
3.4. Real-time PCR Analysis
After treatment, PFC tissues were isolated and stored in a nitrogen tank. Total cDNA was synthesized and used to measure expression changes across groups. For quantitative miRNA-targeting PCR, stem-loop primers were used at 37°C for 65 minutes and 95°C for 8 minutes. For accurate normalization and quantification, U6 snRNA was used as the endogenous control for miRNA levels, whereas GAPDH was used as the control gene to assess SIRT1 gene expression. Relative expression was analyzed using the 2-ΔΔCt method. Owing to the low variation in molecular values among animals within each group and the need to fix brains from 2 animals for histological analysis, n = 6 animals per group were used for molecular testing. The primers are listed in Table 1.
Table 1.
Primer Sequences a
| Sequence | Primer | Genes |
|---|---|---|
| 5'-ATACCTTGGAGCAGGTTGCAG-3' | F | SIRT1 |
| 5'-TGTCATACTTCATGGCTCTATG-3' | R | SIRT1 |
| 5'-TGTGACAAAGTGGACATTGTTG-3' | F | GAPDH |
| 5'-TCCTGGAAGATGGTGATGGGT-3' | R | GAPDH |
| 5'-AACAGTGAAGCTGCCAGTTG-3' | F | miR-22 - 3p |
| 5'-GTCGTATCCAGTGCAGGGTCCGAGGTATTCGCACTGGATACGACACAGTT-3' | Loop | miR-22 - 3p |
| 5'-AAGCGCCTTCTTTGGTTATCTAG-3' | F | miR-9 - 5p |
| 5'-GTCGTATCCAGTGCAGGGTCCGAGGTATTCGCACTGGATACGACTCATAC-3' | Loop | miR-9 - 5p |
| 5'-AACAAGAGCTGGTGTTGTGAA-3' | F | miR-138 - 5p |
| 5'-GTCGTATCCAGTGCAGGGTCCGAGGTATTCGCACTGGATACGACCGGCCT-3' | Loop | miR-138 - 5p |
| 5'-AACAGTGTTTGGTCCCCTTCA-3' | F | miR-133a-3p |
| 5'-GTCGTATCCAGTGCAGGGTCCGAGGTATTCGCACTGGATACGACCAGCTG-3' | Loop | miR-133a-3p |
| 5'-GTCGTATCCAGTGCAGGGT-3' | R | miR-General |
| 5'-GTGCTGGCATTGGCAGTACA-3' | F | U6 |
| 5'-TTAAACATGGAACGCCTCATGAT-3' | R | U6 |
a Abbreviations: SIRT1, sirtuin-1; GAPDH, glyceraldehyde 3-phosphate dehydrogenase.
3.5. Bioinformatics Analysis
miRNAs putatively targeting the SIRT1 gene were identified using a comprehensive prediction approach with TargetScan software (www.targetscan.org). MicroRNAs with a higher probability of preferential conservation were selected for further analysis. These interactions were predicted bioinformatically in this study. After identifying the predicted miRNAs, their sequences were retrieved from miRDB (www.mirdb.org) for further analysis and experimental validation. MicroRNA primers were designed using stem-loop RT primers (www.srnaprimerdb.com).
3.6. Immunoblotting Analysis
PFC tissues were lysed in lysis buffer, and protein concentration was determined using the Bradford method. Samples were separated on a 12.5% sodium dodecyl sulfate-polyacrylamide gel electrophoresis gel and transferred to a PVDF membrane. Membranes were blocked with 2% skim milk to prevent nonspecific binding and then incubated with primary antibodies. After washing, membranes were incubated with a horseradish peroxidase-conjugated secondary antibody. ECL reagents were used for detection, and X-ray films were used to visualize the bands. Immunoreactive blots were normalized to β-actin in each group. Band intensity was quantified using ImageJ.
3.7. Histological Analysis
Fixed brain tissues were processed for paraffin embedding. Blocks were sectioned at 5 - 7 μm using a sliding microtome (Leitz 1512, Italy). Slides were deparaffinized, hydrated, and washed with PBS. Sections were stained with cresyl violet and assessed using a light microscope (Motic, China). The histopathologist who performed the histological interpretation was blinded to the experimental groups. To reduce observer bias, all stained slides were independently evaluated by 2 experienced observers; in cases of disagreement, another senior expert supervised the work. All 3 observers were blinded to grouping. This multi-observer approach, conducted by blinded analysts, was used to ensure the validity of the histological findings. Stained sections were examined under a light microscope with blinding to grouping. For each animal, 3 nonoverlapping fields of the PFC were imaged (total, 6 slides). The numbers of morphologically intact and damaged neurons were counted manually using ImageJ software. Neuronal density was calculated as the number of intact neurons per field of view. In addition, the number of damaged neurons per field was calculated.
3.8. Statistical Analysis
All data were analyzed using GraphPad Prism 8 and are presented as mean ± SEM. One-way analysis of variance (ANOVA) was used to compare groups, followed by the Tukey post hoc test. Before one-way ANOVA, normality and homogeneity of variance were assessed using the Shapiro-Wilk test and the Levene test, respectively. All data sets met the assumptions required for parametric testing. No statistical outliers were excluded from the analysis. Animal exclusion was based only on predefined experimental criteria (illness, movement disorder, or weight loss greater than 20%) before statistical analysis. Effect sizes were calculated as η2 for ANOVA analyses. The significance level was set at P < 0.05. A post hoc power analysis was performed using G*Power version 3.1 for one-way ANOVA (fixed effects, omnibus test). The analysis was based on 4 groups, n = 6 for the molecular study, a total sample size of 24, and an α level of 0.05. Effect sizes (Cohen f) were calculated from eta-squared (η2) values using the formula:
The statistical power for all molecular outcomes was very high (approximately > 0.95), based on the calculated effect sizes.
4. Results
4.1. Effect of METH and Resveratrol on Object-Based Attention
Exploration duration did not differ significantly among groups (F(3, 28) = 0.38, P = 0.75). However, significant between-group differences were observed in the recognition index during the acquisition phase (F(3, 28) = 21.21, P < 0.0001, η2 = 0.56). Animals in the METH + Veh group explored the new object less than those in the Saline + Veh group (37.25 ± 2.46 vs 60.63 ± 3.29, P < 0.0001), indicating impaired object-based attention in METH-injected animals. Furthermore, the recognition index improved in animals receiving resveratrol before METH injection compared with that in the METH + Veh group (57.50 ± 3.01 vs 37.25 ± 2.46, P < 0.001). These results indicate that oral administration of resveratrol ameliorated METH-induced attention deficits in rats (Figure 2B and C).
4.2. Effect of METH and Resveratrol on Working Memory
As shown in Figure 2D, significant between-group differences were observed in spontaneous alternation behavior (F(3, 28) = 67.88, P < 0.0001, η2 = 0.88). The percentage of spontaneous alternation behavior was reduced in the METH + Veh group compared with the Saline + Veh group (0.35 ± 0.02 vs 0.80 ± 0.02, P < 0.0001). Moreover, the percentage of spontaneous alternation behavior increased with resveratrol administration in the METH + Resveratrol group compared with the METH + Veh group (0.74 ± 0.02 vs 0.35 ± 0.02, P < 0.0001).
There was no difference in the total number of arm entries, indicating that locomotion was not affected in the Y-maze (F(3, 28) = 1.84, P = 0.16) (Figure 2E).
4.3. Effect of METH and Resveratrol on SIRT1 Levels in the PFC
The data showed that SIRT1 mRNA expression differed among groups (F(3, 20) = 43.75, P < 0.0001, η2 = 0.86). SIRT1 mRNA expression decreased in the METH + Veh group compared with the control group (0.48 ± 0.04 vs 1.05 ± 0.05, P < 0.0001). As presented in Figure 3A, SIRT1 mRNA expression in the METH + Resveratrol group increased compared with that in the METH + Veh group (0.94 ± 0.03 vs 0.48 ± 0.04, P < 0.0001).
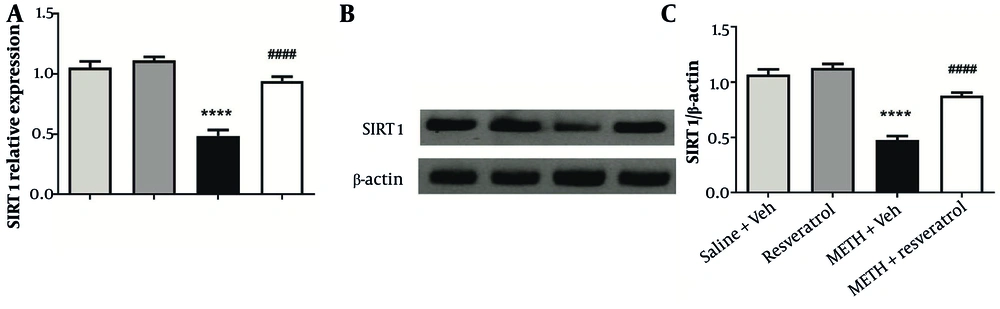
Figure 3.
Effect of METH and resveratrol on SIRT1 mRNA and protein levels in the PFC. qRT-PCR analysis revealed that SIRT1 mRNA levels in the PFC were decreased in the METH + Veh group. Conversely, resveratrol administration enhanced SIRT1 mRNA levels in the METH + Resveratrol group (A). Representative western blotting for SIRT1 and β-actin in different groups (B). Western blot analysis showed a reduction in SIRT1 protein levels in the PFC in the METH + Veh group. However, SIRT1 protein levels increased in the METH + Resveratrol group (C). **** P < 0.0001 compared with the Saline + Veh group; #### P < 0.0001 compared with the METH + Veh group; n = 6 in each group.
Western blot analysis showed differences among the treated groups (F(3, 20) = 62.32, P < 0.0001, η2 = 0.90). The data indicated a marked reduction in SIRT1 protein levels in the METH-treated group compared with the control group (0.47 ± 0.03 vs 1.06 ± 0.04, P < 0.0001). Conversely, SIRT1 protein levels were higher in the METH + Resveratrol group than in the METH + Veh group (0.87 ± 0.02 vs 0.47 ± 0.03, P < 0.0001). These findings indicate a potential inhibitory effect of resveratrol on METH-induced SIRT1 reduction (Figure 3B and C).
4.4. Effect of METH and Resveratrol on Predicted SIRT1-Targeting MicroRNAs in the PFC
The following results describe expression changes in miRNAs that were bioinformatically predicted to target SIRT1.
4.4.1. miR-133a-3p
Our analysis showed that miR-133a-3p levels differed among groups (F(3, 20) = 14.3, P < 0.0001, η2 = 0.68) (Figure 4A). The miR-133a-3p level in the METH-treated group was higher than that in the Saline + Veh group (1.56 ± 0.09 vs 1.02 ± 0.06, P < 0.001). However, resveratrol administration before METH injection did not change miR-133a-3p levels compared with those in the METH group (1.53 ± 0.10 vs 1.56 ± 0.09, P = 0.98). These findings indicate that METH significantly increased miR-133a-3p, whereas resveratrol had no effect on miR-133a-3p expression.
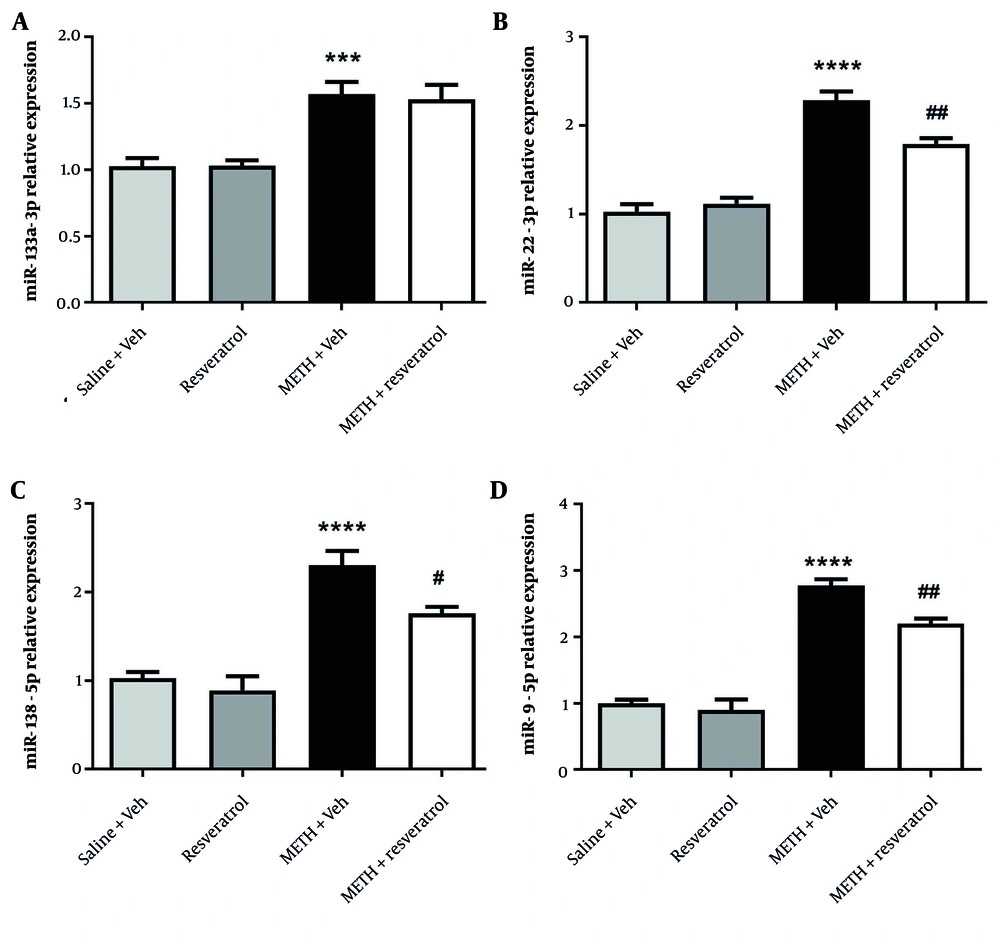
Figure 4.
Effect of METH and resveratrol on the level of predicted microRNAs with a higher probability of preferential conservation related to SIRT1. The level of miR-133a-3p in the METH + Veh group was significantly higher than that in the Saline + Veh group. However, administration of resveratrol in the METH + Resveratrol group did not change the expression of miR-133a-3p compared with the METH + Veh group (A). The METH + Veh group showed enhanced miR-22 - 3p, miR-138 - 5p, and miR-9 - 5p levels compared with the Saline + Veh group. Conversely, the levels of miR-22 - 3p, miR-138 - 5p, and miR-9 - 5p were decreased in the METH + Resveratrol group compared with the METH + Veh group (B, C, and D). ****P < 0.0001 compared with the Saline + Veh group; ***P < 0.001 compared with the Saline + Veh group; ## P < 0.01 and # P < 0.1 compared with the METH + Veh group; n = 6 in each group.
4.4.2. miR-22 - 3p
Our statistical analysis showed differences in miR-22 - 3p levels among experimental groups (F(3, 20) = 53.88, P < 0.0001, η2 = 0.89) (Figure 4B). miR-22 - 3p levels were significantly increased in the METH + Veh group compared with the Saline + Veh group (2.28 ± 0.10 vs 1.02 ± 0.08, P < 0.0001). Conversely, the METH + Resveratrol group showed reduced miR-22 - 3p levels compared with those in the METH + Veh group (1.79 ± 0.06 vs 2.28 ± 0.10, P < 0.01). These data indicate that METH injection upregulated miR-22 - 3p and that resveratrol administration downregulated miR-22 - 3p.
4.4.3. miR-138 - 5p
Analysis showed differences in miR-138 - 5p levels among groups (F(3, 20) = 28.23, P < 0.0001, η2 = 0.80) (Figure 4C). Rats that received METH and vehicle showed a significant increase in miR-138 - 5p levels compared with controls (2.33 ± 0.15 vs 1.02 ± 0.06, P < 0.0001). Moreover, miR-138 - 5p levels were lower in the METH + Resveratrol group than in the METH + Veh group (1.75 ± 0.07 vs 2.30 ± 0.15, P < 0.05). These data indicate that METH increased miR-138 - 5p levels; however, resveratrol administration reduced miR-138 expression in METH-injected rats.
4.4.4. miR-9 - 5p
The analysis revealed differences in miR-9 - 5p levels among groups (F(3, 20) = 75.20, P < 0.0001, η2 = 0.91), indicating significant between-group changes (Figure 4D). Animals treated with METH and vehicle showed increased miR-9 - 5p expression compared with the Saline + Veh group (2.77 ± 0.09 vs 0.99 ± 0.05, P < 0.0001). Moreover, resveratrol treatment in the METH + Resveratrol group decreased miR-9 - 5p levels compared with those in the METH + Veh group (2.19 ± 0.07 vs 2.77 ± 0.09, P < 0.01).
4.5. Effect of Resveratrol on Cellular Morphology of the PFC
Histopathological examination of the PFC showed normal neuronal morphology in the Saline + Veh group and the Resveratrol group (Figure 5A and B). Neuronal damage and shrunken cell bodies were observed in the PFC of the METH + Veh group (Figure 5C). However, resveratrol treatment in the METH + Resveratrol group attenuated neuronal damage (Figure 5D). There was a significant difference in neuronal density among groups (F(3, 20) = 9.07, P < 0.001, η2 = 0.57). Slides from the METH + Veh group showed decreased neuronal density compared with the Saline + Veh group (37.83 ± 2.35 vs 101.5 ± 3.47, P < 0.001), whereas resveratrol administration in the METH + Resveratrol group increased neuronal density compared with that in the METH + Veh group (84.00 ± 4.17 vs 37.83 ± 2.35, P < 0.01) (Figure 5E). Moreover, there was a significant difference in the number of damaged neurons among groups (F(3, 20) = 57.30, P < 0.0001, η2 = 0.89). The number of damaged neurons increased in the METH + Veh group compared with the Saline + Veh group (11.17 ± 1.19 vs 40.33 ± 2.33, P < 0.0001), and resveratrol administration in the METH + Resveratrol group decreased the number of damaged neurons compared with that in the METH + Veh group (21.33 ± 1.89 vs 40.33 ± 2.33, P < 0.0001) (Figure 5F).
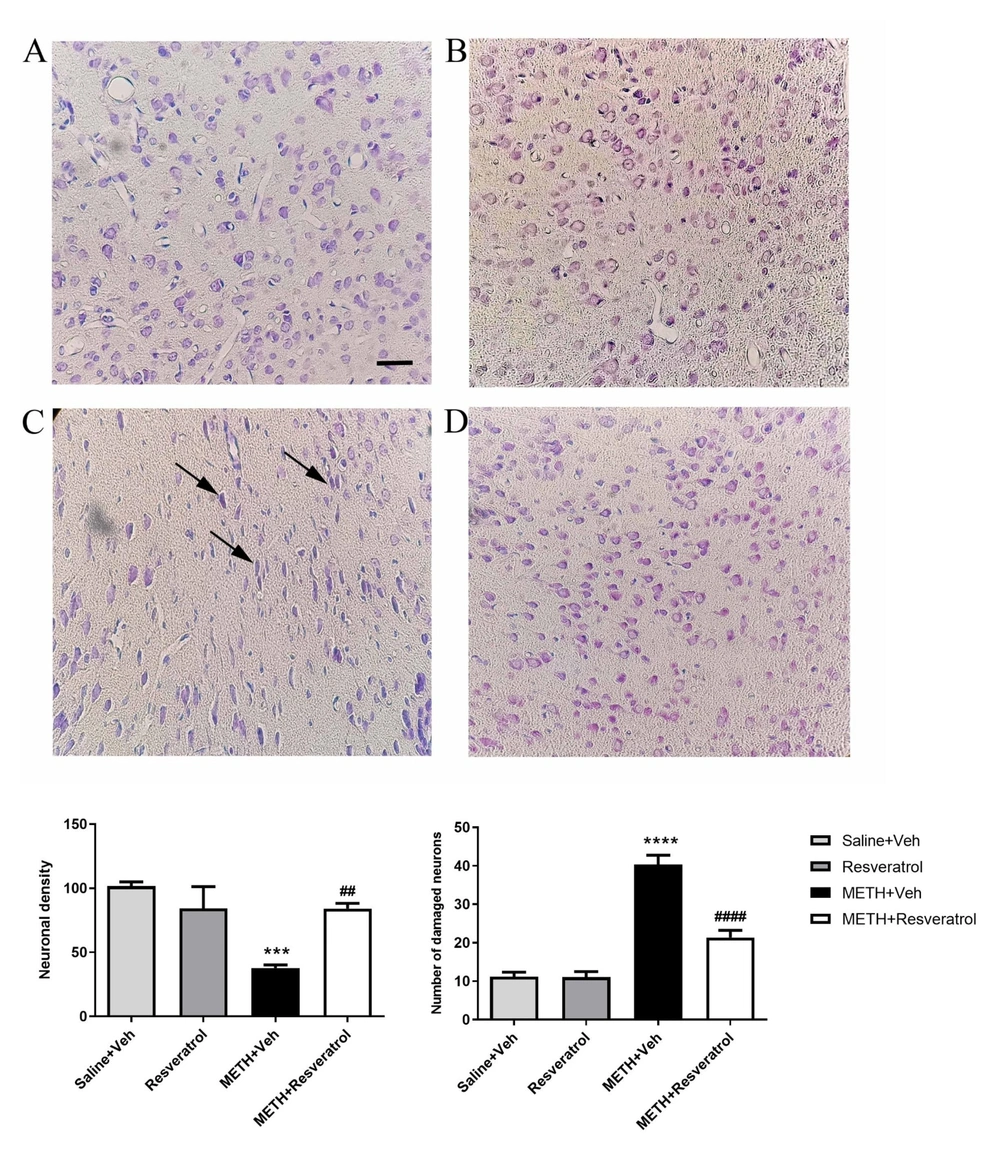
Figure 5.
Histological evaluation of the PFC region using cresyl violet staining in different groups. Saline + Veh group (A), Saline + Resveratrol group (B), METH + Veh group (C), and METH + Resveratrol group (D). Neuronal density in the METH + Veh group was significantly reduced compared with the Saline + Veh group. Administration of resveratrol in the METH + Resveratrol group enhanced neuronal density compared with the METH + Veh group (E). The number of damaged neurons per field in the METH + Veh group increased compared with the Saline + Veh group. Administration of resveratrol in the METH + Resveratrol group decreased damaged neurons compared with the METH + Veh group (F). Arrows show damaged cells. Magnification, 400×; scale bar, 40 μm. **** P < 0.0001 and *** P < 0.001 compared with the Saline + Veh group; #### P < 0.0001 and ## P < 0.01 compared with the METH + Veh group; n = 6 in each group.
5. Discussion
Data from the current study revealed that METH damaged PFC tissue and decreased attention and working memory. Moreover, SIRT1 expression was reduced in the PFC following METH use. Resveratrol administration ameliorated the toxic effects of METH in the PFC and reduced METH-induced cognitive impairment. Increased SIRT1 protein contributed to the neuroprotective effects of resveratrol. In addition, SIRT1-related microRNAs, including miR-22 - 3p, miR-138 - 5p, and miR-9 - 5p, were altered during resveratrol-mediated neuroprotection.
Previously, reduced PFC volume and increased impulsive behaviors were observed in METH addicts (17). In addition, cognitive and electrophysiological studies in human subjects have reported that METH consumption reduces attention, which correlates with alterations in prefrontal excitability (18). METH inhibited the proliferation of neural progenitor cells in the PFC. The sensitivity of PFC precursors to METH was associated with prominent neuronal inhibition in the PFC following METH use (19). In an experimental study, METH impaired autophagy and increased apoptosis and inflammation, along with morphological changes, enhanced astrogliosis, and decreased BDNF levels in the PFC in a rat model (20).
The results of our study showed that repeated METH use impaired cognition and reduced SIRT1 levels in the PFC of rats. METH dependency has been shown to be associated with neurocognitive impairments, including impairments in attention, learning, episodic memory, and working memory (21, 22). A functional imaging study of METH-dependent patients revealed that reduced working memory networks in the PFC underlie cognitive impairments in METH use disorder (23). Moreover, lower frontal cortex thickness was reported in METH abusers, and this reduction was significantly associated with a longer duration of METH use (24). Komlao et al. reported that METH reduces stereotypic behavior and attentional-shifting task performance through increased endoplasmic reticulum stress profiles in the PFC (25). Notably, METH-induced attention deficits associated with reduced mitochondrial biogenesis in the PFC were reported in a rat model of METH abuse (10). Consistent with these clinical and laboratory findings, we observed decreased working memory and object-based attention after 14 days of METH administration in rats, accompanied by damage to PFC tissue.
Resveratrol is an effective natural phenolic compound that can reduce oxidative stress, ameliorate neuronal loss, and prevent cognitive impairment (26). Resveratrol has been reported to protect dopaminergic neurons against METH-induced neurotoxicity by inhibiting oxidative stress and apoptosis. In addition, an in vivo study showed that resveratrol protected hippocampal neurons against METH-induced toxicity and improved animal performance in the novel object recognition behavioral test (27). The current study suggests that resveratrol can protect PFC tissue and improve working memory and attention against METH toxicity. Notably, examination of the PFC showed that resveratrol ameliorated METH-induced SIRT1 reduction. These findings suggest that resveratrol improves memory and attention and ameliorates PFC damage through a SIRT1-related mechanism.
Recently, several studies have reported that SIRT1 has diverse neuroprotective roles and that its overexpression ameliorates neurodegeneration (28, 29). SIRT1 upregulation in the hippocampus increased mitochondrial biogenesis and ameliorated memory impairment (30). In addition, decreased SIRT1 expression in the PFC of patients with Alzheimer disease has been reported and was related to cognitive decline and oxidative stress (28). Consistent with previous studies, we observed that SIRT1 downregulation due to METH consumption caused cognitive impairments in rats. In addition, increased SIRT1 expression in the PFC following resveratrol administration led to improved cognitive performance and protection of PFC neurons.
miRNAs are crucially involved in regulating the expression of many important genes and play key roles in several neurotoxic and neuroprotective pathways. We observed that the expression of SIRT1-related microRNAs, including miR-22 - 3p, miR-9 - 5p, and miR-138 - 5p, decreased following resveratrol treatment. Using a luciferase assay, miR-22 - 3p has been reported to target SIRT1 expression (31). In addition, nicotinamide decreased SIRT1 expression in periodontal ligament stem cells. Notably, miR-22 - 3p overexpression was found to be involved in nicotinamide-induced silencing of SIRT1. Downregulation of miR-22 - 3p modulated the production of the inflammatory cytokines tumor necrosis factor α and interleukin 1β through a SIRT1-dependent pathway (31). Resveratrol administration decreased miR-22 - 3p levels in muscle cells, which was associated with increased SIRT1 levels in these cells (32).
It was previously reported that chronic administration of METH increased miR-9 - 5p in the nucleus accumbens of rats (33). This miRNA is highly expressed in the vertebrate brain and is associated with various neurological diseases. miR-9 - 5p is upregulated during neurodegenerative processes in Parkinson disease, which is associated with decreased SIRT1 expression. Knockdown of miR-9 - 5p inhibits neurodegeneration and Parkinson disease progression, as evidenced by suppression of apoptotic, inflammatory, and oxidative stress pathways (34). miR-9 - 5p increased in a rat model of cerebrovascular cognitive impairment, and suppressing this miRNA improved cognitive impairments (35). It has been confirmed that miR-138 - 5p interacts with the 3'-UTR of SIRT1 mRNA and consequently prevents SIRT1 mRNA translation (36). Enhanced miR-138 - 5p levels in the postmortem PFC and hippocampus correlate with working memory impairment in human subjects (37). Upregulation of miR-138 - 5p in the hippocampus reduced memory function in the Y-maze and Morris water maze and increased inflammation in the hippocampus (38).
miR-133a-3p has been proposed as a serum biomarker for METH addiction (39). In addition, overexpression of this miRNA in the central nervous system was associated with increased neuronal death and cognitive disorders (40). Consistent with previous studies, we observed that SIRT1-related microRNAs, including miR-22 - 3p, miR-9 - 5p, miR-138 - 5p, and miR-133a-3p, were upregulated in the PFC following repeated METH use, which induced damage to the PFC region and impaired working memory and attention. Notably, resveratrol administration before METH injection inhibited the upregulation of miR-22 - 3p, miR-9 - 5p, and miR-138 - 5p, in association with increased SIRT1 protein expression. Higher SIRT1 levels in the PFC were associated with reduced PFC damage and improved working memory and attention.
5.1. Limitations
The key limitation is that the dependence of the protective effects of resveratrol on SIRT1 and the involvement of miRNAs in this pathway could not be directly demonstrated in this study. Although our results indicate a strong association among resveratrol treatment, levels of SIRT1-related miRNAs, and SIRT1 protein in the PFC, the current experimental design emphasizes establishing these associations rather than confirming these interactions. Our study lacked direct functional experiments, such as SIRT1 inhibition or the use of miRNA inhibitors. In addition, direct validation of miRNA predictions through methods such as luciferase assays was not performed in this model. Therefore, our findings are more consistent with a mechanism associated with changes in SIRT1 and its miRNAs than with their causal roles in resveratrol-induced protection. Future studies are required to clarify the roles of SIRT1 and specific miRNAs in resveratrol-mediated neuroprotection. The sample size for molecular analyses was also relatively limited (n = 6), which may reduce the statistical power to detect slight molecular changes. Finally, although randomization, predefined exclusion criteria, and blinded outcome assessment were addressed, some reporting details and bias-control procedures may have influenced the findings. Examining the results in female animals affected by the estrous cycle could yield different results. Furthermore, although the control group in this study received subcutaneous injection of saline solution and oral 0.5% carboxymethylcellulose, a group receiving only 0.5% carboxymethylcellulose could provide useful information on the possible effects of this carrier alone.
5.2. Conclusions
We reported that METH decreased SIRT1 mRNA and protein in the PFC. Increased levels of miR-22 - 3p, miR-9 - 5p, miR-138 - 5p, and miR-133a-3p could be related to SIRT1 downregulation due to METH toxicity. METH damaged the PFC and impaired working memory and attention in the Y-maze and object-based attention tests. Moreover, oral administration of resveratrol effectively ameliorated the neurotoxic effects of METH on PFC tissue and improved cognitive test performance for working memory and attention. Notably, resveratrol enhanced SIRT1 levels in the PFC and reduced miR-22 - 3p, miR-9 - 5p, and miR-138 - 5p levels. These results indicate that resveratrol may be a potent neuroprotective agent against cognitive impairment and neurotoxicity caused by METH abuse. Future research is essential to clarify the role of SIRT1-related miRNAs in the neuroprotective effects of resveratrol in the PFC.