
1. Background
Curcumin [(1E,6E)-1,7-bis(4-hydroxy-3-methoxyphenyl)-1,6-heptadiene-3,5-dione], the principal curcuminoid of Curcuma longa, is a lipophilic polyphenol with a broad pharmacological profile, including anti-inflammatory, antioxidant, antimicrobial, and antineoplastic activities (1-3). In dermatology, this profile translates into documented benefits for inflammatory dermatoses, wound healing, photodamage, and psoriasis. Curcumin acts largely by inhibiting phosphorylase kinase and blocking NF-κB-driven transcription of pro-inflammatory cytokines, such as TNF-α, IL-17, and IL-1β (4-7). A topically applied 1% curcumin gel has suppressed imiquimod-induced psoriasiform inflammation in animal skin (6, 8). However, topical delivery of curcumin remains challenging.
The obstacle is twofold. Curcumin has an aqueous solubility on the order of ng/mL, degrades rapidly at alkaline pH, undergoes photodegradation, and is rapidly metabolized (9-11); it is classified as a Biopharmaceutics Classification System (BCS) class IV compound, with low solubility combined with low permeability (9, 12, 13). The barrier it must cross is the stratum corneum, the outermost epidermal layer, described as a brick-and-mortar arrangement of keratin-filled corneocytes embedded in a lamellar matrix of ceramides, cholesterol, and free fatty acids in roughly equimolar proportion (14-16). The lipid mortar accounts for only about 10 to 15% of the dry mass, but it forms the continuous and rate-limiting pathway for permeation, and its ordered lamellae make it three to five orders of magnitude less permeable than a typical phospholipid membrane (17, 18). An unformulated aqueous dispersion of curcumin, therefore, deposits very little across intact skin, as indicated by the aqueous comparator used in this study.
Overcoming both problems requires a carrier that dissolves curcumin molecularly, presents it at high thermodynamic activity at the skin surface, and perturbs the barrier lipids. Liposomes, solid lipid nanoparticles, nanostructured lipid carriers, polymeric micelles, and nanoemulsions have all been examined for this purpose (19-21). Microemulsions are well suited to dermal use (22-24). They are thermodynamically stable, optically transparent, low-viscosity, isotropic dispersions of oil, water, surfactant, and co-surfactant, with internal droplets typically in the 10 to 100 nm range (25-27). Their large oil-water interfacial area and solubilization capacity enable loading of lipophilic drugs above intrinsic solubility (28, 29). The surfactant and co-surfactant blend has been reported to fluidize and partially extract stratum corneum lipids (30-32), and the small droplets are thought to help sustain a concentration gradient at the membrane (33, 34). The components used here are recognized dual-function excipients: oleic acid has been reported to disorder the stratum corneum lipid lamellae while also serving as the oil phase, and Transcutol P and propylene glycol both solubilize curcumin and partition into the barrier (35, 36).
A single-phase isotropic microemulsion would be expected to interact with the stratum corneum differently than a closed phospholipid vesicle such as a liposome. In a liposome, the drug is held within an aqueous core or a curved bilayer, and release depends on vesicle fusion with, adsorption to, or disruption at the skin surface (19, 20). A microemulsion has no such membrane. Curcumin is molecularly dissolved at the oil-water interface and is therefore available for partitioning as soon as the formulation is applied (23, 24). Two consequences have been proposed in the literature, and we treat them here as working hypotheses rather than as established for this system. First, the surfactant and co-surfactant (Smix) fraction that stabilizes the interface may also act as a penetration-enhancing reservoir, as these amphiphiles can intercalate into the intercellular lamellae and lower the diffusional resistance of the mortar phase (30-32). Second, the small droplet size provides a large interfacial area, which may help sustain the concentration gradient that drives flux (33, 34). This combination of solubilization and barrier modulation is the rationale for the platform evaluated here, and it underlies quality-by-design topical microemulsions developed for inflammatory skin disease (37, 38).
2. Objectives
Building on this experience, the present work was designed to prepare curcumin microemulsions and, using a two-level full factorial framework, to screen and rank the formulation variables (total oil content, water fraction, and Smix ratio) that govern droplet size, PDI, drug release, and the ex vivo permeation descriptors Jss, lag time, diffusion coefficient, and permeability coefficient, with the aim of identifying and rationally selecting a lead composition for skin transport.
3. Methods
3.1. Materials
Curcumin (analytical grade) was purchased from Merck (Darmstadt, Germany). Oleic acid, Tween 80, Span 20, propylene glycol, and the buffer salts sodium dihydrogen phosphate and disodium hydrogen phosphate were pharmaceutical grade and sourced domestically (Iran). Transcutol P (diethylene glycol monoethyl ether) was used as a component of the oil phase (36). A cellulose acetate dialysis membrane was obtained from Tuba Azma (Iran). All aqueous solutions were prepared with phosphate buffer (pH 7.4). Adult male Wistar rats were obtained from the Laboratory Animal Breeding and Care Center of Ahvaz Jundishapur University of Medical Sciences (AJUMS).
3.2. Solubility Screening of Curcumin in Formulation Excipients
To rationally select the oil, surfactant, and co-surfactant, the equilibrium solubility of curcumin was determined in each candidate excipient, following the component-screening approach widely used in microemulsion design (22, 25). An excess of curcumin was added to a fixed volume of each vehicle, vortex-mixed, and equilibrated; undissolved drug was removed by centrifugation. The supernatant was appropriately diluted and assayed spectrophotometrically at 425 nm against the calibration curve. Measurements were performed in triplicate (n = 3), and results are expressed as mean ± SD.
3.3. Preparation of Curcumin Microemulsions
Throughout this article, Smix denotes the combined surfactant and co-surfactant phase, and Smix ratio denotes the mass ratio of surfactant to co-surfactant (S:CoS) within that phase. These terms are used only in this sense. Before selecting any experimental-design formulation, the boundaries of the clear, isotropic microemulsion region were mapped using the water titration method at ambient temperature (24, 41). Because the Smix ratio was itself a design factor, two separate pseudo-ternary phase diagrams were constructed, one for each Smix ratio (1:1 and 3:1), to define the equilibrium boundaries independently for both surfactant systems. In each diagram, the oil phase (oleic acid:Transcutol P, 1:1) was blended with Smix (Tween 80/Span 20 as surfactant and propylene glycol as co-surfactant) at the ratio under study, and each oil–Smix mixture was titrated dropwise with the water phase under gentle magnetic stirring. Transition points from turbid to transparent, and back, were recorded to delineate the single-phase isotropic domain. The resulting diagrams (Section 5.2) defined the compositional windows within which thermodynamically stable microemulsions form, and the eight experimental formulations were drawn exclusively from these validated regions. For each formulation, curcumin (fixed at 0.2% w/w) was dissolved in the oil phase together with the surfactant and co-surfactant blend at the design-specified Smix ratio; the water phase (phosphate buffer, pH 7.4) was then incorporated dropwise under gentle stirring at ambient temperature until a clear, single-phase, low-viscosity system was obtained. The eight compositions, calculated per 100 g of formulation, are detailed in Table 1.
Table 1.
Composition of the Eight Curcumin Microemulsions Calculated per 100 Grams of Formulation (23 Full Factorial Design) a
| Formulation | Total Oil (%) | Smix ratio (S:CoS) | Surfactant (%) | Co-surfactant (%) | Water Phase (%) | Coded (A, B, C) |
|---|---|---|---|---|---|---|
| F1 | 5 | 1:1 | 45.00 | 45.00 | 5 | (−, −, −) |
| F2 | 5 | 1:1 | 42.50 | 42.50 | 10 | (−, +, −) |
| F3 | 50 | 1:1 | 22.50 | 22.50 | 5 | (+, −, −) |
| F4 | 50 | 1:1 | 20.00 | 20.00 | 10 | (+, +, −) |
| F5 | 5 | 3:1 | 67.50 | 22.50 | 5 | (−, −, +) |
| F6 | 5 | 3:1 | 63.75 | 21.25 | 10 | (−, +, +) |
| F7 | 50 | 3:1 | 33.75 | 11.25 | 5 | (+, −, +) |
| F8 | 50 | 3:1 | 30.00 | 10.00 | 10 | (+, +, +) |
a A = oil content; B = water phase; C = Smix ratio. All excipient values are normalized so that Oil% + Surfactant% + Co-surfactant% + Water% = 100 g. Curcumin (0.2% w/w) was dissolved within the oil phase and is expressed as an additional loading over this excipient base; it is carried inside the reported oil fraction rather than occupying a separate 0.2% of the total, so the excipient proportions remain internally consistent and reproducible. Surfactant = Tween 80/Span 20; co-surfactant = propylene glycol. Smix denotes the combined surfactant plus co-surfactant phase; the Smix ratio is the mass ratio of surfactant to co-surfactant within that phase, so that surfactant represents 75% of the Smix mass at the 3:1 level and 50% at the 1:1 level. The lead formulation F5 is shaded throughout.
3.4. Two-Level Full Factorial Experimental Design
A 23 full factorial design (three factors, each at two levels; eight runs) was used to screen the formulation space and resolve main effects and all interaction terms, consistent with quality-by-design principles for pharmaceutical development (37, 44). The independent variables were (A) total oil content (5% vs. 50% w/w), (B) water phase fraction (5% vs. 10% w/w), and (C) Smix ratio (1:1 vs. 3:1). The dependent responses were droplet size, PDI, steady-state flux (Jss), lag time (Tlag), diffusion coefficient (D), and permeability coefficient (P). Response data were fitted by ordinary least-squares regression, and the significance of each coefficient was assessed by ANOVA, with P < 0.05 considered significant. This 23 design is used here as a screening and selection matrix. It resolves and ranks the direction and relative magnitude of main effects and interactions and identifies a lead composition among the eight tested; it does not include center points, so curvature cannot be detected and no true optimum within the design space can be located. Predictive optimization, which would require additional center points, curvature checks, and design replication, is a distinct subsequent step and is not claimed in the present work.
3.5. Physicochemical Characterization
Droplet size and PDI. Mean droplet diameter, PDI, and the derived percentiles d10, d50, and d90 were measured by dynamic light scattering (DLS; Scatteroscope I, K-One Nano, Republic of Korea) at 25 °C and a fixed scattering angle of 90°, with each formulation appropriately diluted in the aqueous phase and measured in triplicate (n = 3).
Viscosity. Rheological behavior was assessed using a Brookfield DV-II+ Pro rotational viscometer (spindle no. 34) at 37 °C across shear rates of 10 to 100 rpm; viscosity is reported as the mean ± SD of three independent measurements (n = 3) for each formulation. The measurement temperature was set to 37 °C because viscosity is used in this work to interpret transport behavior, and both the in vitro release and the ex vivo permeation experiments were conducted at 37 °C. The physical and chemical stability program (Section 3.9) was conducted at 25 °C because this is the long-term storage condition specified by the International Council for Harmonization (ICH) Q1A(R2). Viscosity was not re-determined at 25 °C, and the temperature dependence of rheology was therefore not characterized; this is noted as a limitation in Section 5.
Scope of structural characterization. The systems studied are optically transparent, single-phase, thermodynamically stable isotropic microemulsions, as confirmed by the pseudo-ternary phase mapping in Section 5.2. For such systems, DLS droplet size and PDI, together with the phase diagrams and rheological data, are accepted primary structural benchmarks for a screening study. Transmission electron microscopy and cryogenic transmission electron microscopy were not performed. Zeta-potential measurement was not used as a stability criterion because the Tween 80/Span 20 interface is stabilized sterically rather than electrostatically, and the thermodynamic stability of these systems is governed by ultra-low interfacial tension and interfacial packing rather than by surface charge (22, 24, 26). A classical encapsulation-efficiency assay was likewise not applicable: in a single-phase isotropic microemulsion, the drug is molecularly solubilized within a homogeneous oil–surfactant continuum, and there is no discrete particulate phase that can be separated from a continuous phase; thus, drug loading is instead defined by the solubilization capacity of the excipient system. Using the single-excipient solubilities measured in Table 2 and weighting them by the mass fraction of each component, a conservative estimate of the solubilization capacity of the F5 excipient system is approximately 4 mg/mL, taking the lower of the two surfactant values, against an applied loading of 2 mg/mL. The entire added dose is therefore accommodated in the dissolved state, consistent with the clear, precipitate-free appearance of every formulation at preparation and throughout storage. A direct assay of curcumin content at time zero was not performed, and the nominal loading of 0.2% w/w is used as the reference concentration throughout; this is noted as a limitation in Section 5.1. We acknowledge that these arguments are based on the established physical chemistry of microemulsions rather than on direct measurement in the present systems, and that confirmatory morphological (cryo-TEM) and electrokinetic characterization would provide additional structural detail. This is stated as a limitation in Section 5.
Table 2.
Equilibrium Solubility of Curcumin in Various Formulation Excipients at Ambient Temperature (N = 3)
| Excipient | Solubility (mg/mL) |
|---|---|
| Transcutol P | 12.274 ± 0.037 |
| Tween 80 | 8.574 ± 0.074 |
| Propylene glycol | 6.354 ± 0.084 |
| Oleic acid | 4.653 ± 0.026 |
| Span 20 | 3.399 ± 0.017 |
3.6. Validation of the Analytical Method
A UV-visible spectrophotometric method was validated for curcumin quantification at λmax = 425 nm in accordance with ICH Q2(R1) guidance. Calibration standards spanning 0.0005 to 0.01 mg/mL were prepared in a 50:50 (v/v) mixture of phosphate buffer (pH 7.4) and methanol and assayed over three consecutive days in triplicate. The upper standard of 10 µg/mL lies well above the equilibrium solubility of curcumin in plain phosphate buffer, and the methanol co-solvent is required to keep the standards in solution across the calibration range. The same 50:50 buffer–methanol diluent was used for all receptor samples (Sections 3.7 and 3.8), so the calibration is matrix-matched to the samples it quantifies. The 425 nm detection wavelength corresponds to the visible absorption maximum of curcumin in methanol-containing media, consistent with this diluent. Linearity was assessed by least-squares regression of absorbance versus concentration, yielding the regression equation y = 68.019x − 0.0025 with a coefficient of determination R2 = 0.9997. Precision was evaluated as intra-day (repeatability) and inter-day (intermediate precision) variability and expressed as the relative standard deviation (RSD), which remained below 2.5% at every concentration level across the three days. Accuracy was determined by the percent-recovery method, with mean recoveries ranging from 96.58% to 105.64% across the calibration range. The limit of detection (LOD) and limit of quantification (LOQ), calculated from the residual standard deviation of the regression (σ) and the slope (S) as 3.3σ/S and 10σ/S, were 0.22 µg/mL and 0.68 µg/mL, respectively.
Specificity was addressed on two grounds. First, the formulation excipients (oleic acid, Transcutol P, Tween 80, Span 20, propylene glycol) and the phosphate-buffer medium are colorless and have no chromophore absorbing in the visible region; thus, they do not interfere at 425 nm. Second, the 425 nm band arises from the extended conjugated diketone system of the intact curcumin molecule. The principal hydrolytic and oxidative degradation products of curcumin, including vanillin, ferulic acid, and the bicyclopentadione, absorb in the ultraviolet region below approximately 350 nm and lack the visible chromophore; therefore, degradation reduces rather than augments the 425 nm signal. Any curcumin degradation occurring during the experiment would thus cause the assay to underestimate, not overestimate, the amount of intact drug transported. As a limitation, the method is non-separative; it was not cross-validated against a stability-indicating high-performance liquid chromatography (HPLC) procedure, and chromatographic confirmation of curcumin identity in receptor samples would be required before these values are used as absolute analytical measures rather than as comparative ones. The complete validation profile is summarized in Table 3.
Table 3.
Method Validation Summary for the Curcumin UV-Spectrophotometric Assay (ICH Q2(R1)) a
| Validation Parameter | Result |
|---|---|
| Detection wavelength (λmax) | 425 nm |
| Linear range | 0.5 - 10 µg/mL (0.0005 - 0.01 mg/mL) |
| Regression equation | y = 68.019x − 0.0025 |
| Coefficient of determination (R²) | 0.9997 |
| Intra-day precision (RSD) | < 2.5% |
| Inter-day precision (RSD) | < 2.5% |
| Accuracy (% recovery) | 96.58 - 105.64% |
| Specificity (425 nm) | No excipient or buffer absorbance at 425 nm; band specific to intact curcumin. Non-separative method; not cross-validated against HPLC (see Section 3.6 and Limitations). |
| Limit of detection (LOD) | 0.22 µg/mL |
| Limit of quantification (LOQ) | 0.68 µg/mL |
a LOD = 3.3σ/S and LOQ = 10σ/S, where σ is the residual standard deviation of the regression and S the slope. Calibration performed on three consecutive days, in triplicate.
3.7. In Vitro Drug Release
Release was studied using vertical Franz diffusion cells fitted with a cellulose acetate membrane. The donor compartment received 2 mL of microemulsion, or an aqueous curcumin suspension used as a non-solubilized comparator, and the receptor compartment (38 mL) contained phosphate buffer (pH 7.4) at 37 °C under continuous magnetic stirring. At 0.5, 1, 2, 3, 4, 5, 6, 7, 8, and 24 h, 2 mL was withdrawn, replaced with fresh pre-warmed medium, and assayed at 425 nm. Each withdrawn aliquot was diluted with methanol so that the final measurement matrix was phosphate buffer (pH 7.4) and methanol in a 50:50 (v/v) ratio, with further dilution in the same 50:50 mixture where necessary to bring the absorbance within the calibration range. Any curcumin present in excess of its equilibrium solubility in the aqueous receptor medium was thereby redissolved, and the assay thus reported the total amount of drug that had crossed the membrane. Cumulative percent release was computed with correction for sampling dilution, and profiles were fitted to zero-order, first-order, Higuchi, and Korsmeyer-Peppas models (45-47); goodness of fit (R2) and the Peppas release exponent (n) identified the governing mechanism, with n ≤ 0.45 taken to indicate Fickian diffusion (47, 48). The complete kinetic comparison across all eight formulations is presented in Table 4.
Table 4.
Comparative Kinetic Model Fitting (R2) Across All Eight Formulations (N = 3) a
| Formulation | Zero-order R2 | First-order R2 | Higuchi R2 | Korsmeyer–Peppas R2 | Best fit |
|---|---|---|---|---|---|
| F1 | 0.8880 | 0.9989 | 0.9939 | 0.9994 | Peppas |
| F2 | 0.8588 | 0.9923 | 0.9848 | 0.9969 | Peppas |
| F3 | 0.8412 | 0.9845 | 0.9776 | 0.9944 | Peppas |
| F4 | 0.8404 | 0.9793 | 0.9765 | 0.9928 | Peppas |
| F5 | 0.9194 | 0.9894 | 0.9994 | 0.9988 | Higuchi |
| F6 | 0.7757 | 0.9450 | 0.9482 | 0.9810 | Peppas |
| F7 | 0.8559 | 0.9918 | 0.9804 | 0.9926 | Peppas |
| F8 | 0.8573 | 0.9673 | 0.9791 | 0.9852 | Peppas |
a R2 values obtained by least-squares regression of the linearised forms of each model against the mean cumulative-release data (n = 10 time points, 0.5 - 24 h). F5 uniquely satisfies the Higuchi square-root-of-time model (R2 = 0.9994) with a Peppas exponent n = 0.417 (< 0.45), consistent with Fickian diffusion.
3.8. Ex Vivo Skin Permeation and Skin-Integrity Quality Control
Abdominal skin was excised from adult male Wistar rats immediately after euthanasia, and subcutaneous fat was carefully removed. Before mounting the excised skin in the vertical Franz diffusion cells, stratum corneum integrity was assessed. Each skin section was first inspected visually under a magnifying lens to exclude macro-defects, punctures, or shearing introduced during surgical excision and fat removal. Baseline barrier integrity was then verified by transepidermal water loss (TEWL) monitoring or electrophysiological resistance assessment across the tissue section. Only specimens with barrier-integrity values within the established physiological norm for rat tissue were used for the permeation study, thereby excluding flux artifacts or passive leakage through compromised membranes.
Certified skin was mounted with the stratum corneum facing the donor compartment (effective diffusional area 4.906 cm2) (18). Two milliliters of formulation was applied to the donor side; the receptor phase was 38 mL of phosphate buffer (pH 7.4) at 37 °C under constant stirring. Samples (2 mL) were collected over 24 h with equal-volume replenishment. Each aliquot was diluted with methanol to a final measurement matrix of phosphate buffer (pH 7.4) and methanol in a 50:50 (v/v) ratio before reading at 425 nm, as described in Section 3.7, so that the assay reported the total amount of curcumin transported into the receptor, whether molecularly dissolved or present as a supersaturated or finely dispersed fraction. From the cumulative amount permeated per unit area versus time, the steady-state flux (Jss, slope of the linear portion) and lag time (Tlag, x-intercept) were derived (49, 50). The permeability coefficient was obtained as P = Jss / C0, where C0 is the curcumin concentration in the applied formulation (2 mg/mL, corresponding to the 0.2% w/w loading), and the apparent diffusion coefficient was calculated as D = h2/6·Tlag. The enhancement ratio (ER) for each parameter was calculated relative to the aqueous curcumin comparator, which was prepared at the same nominal curcumin concentration of 0.2% w/w (2 mg/mL), so that the permeability coefficients of the comparator and the microemulsions are referenced to an identical donor concentration.
Receptor conditions. The receptor medium was unmodified phosphate buffer (pH 7.4), 38 mL, at 37 °C under constant stirring, with no added co-solvent or surfactant. For the highest-permeating formulation, the cumulative amount permeated at 24 h was 132.73 µg/cm2, which over the 4.906 cm2 diffusional area corresponds to 651 µg of curcumin, or 17.1 µg/mL relative to the receptor volume. Because the equilibrium solubility of curcumin in unmodified phosphate buffer at pH 7.4 is below 1 µg/mL, the conventional criterion that the receptor concentration remain below 10% of saturation solubility was exceeded, and we do not claim that formal sink conditions were maintained.
A distinction between total and dissolved concentration is needed here. Because the total amount transported exceeded the equilibrium solubility of curcumin in the receptor medium, the receptor phase cannot have been a true molecular solution at later sampling times; the excess must have been present as a supersaturated or finely dispersed fraction. Because each aliquot was diluted with an organic solvent before measurement (Section 3.8), the assay recovered both fractions, and the mass balance is correct. The gradient that drives passive diffusion, however, is determined by the dissolved and thermodynamically active concentration rather than by the total. Because the dissolved fraction cannot appreciably exceed saturation, the active receptor concentration remained on the order of 1 µg/mL, i.e., below 0.05% of the donor concentration of 2000 µg/mL, throughout the experiment. On that basis, the departure from the conventional criterion concerns total rather than dissolved concentration, and the driving force was preserved to within a fraction of one percent.
Two further considerations bear on the reported parameters. The first is a worst-case bound on the driving force. The purpose of the sink criterion is to ensure that accumulation in the receptor does not erode the concentration gradient across the membrane. Even if the entire transported amount is treated as dissolved, which is the most unfavorable assumption available, the receptor reached only 0.86% of the donor concentration at the single worst time point of the entire study; thus, the gradient was preserved to within 1% throughout on that basis and to within 0.05% on a dissolved-concentration basis. Any residual effect therefore acts in the conservative direction: a receptor approaching saturation lowers the apparent flux, so the fluxes and enhancement ratios reported here are lower bounds rather than inflated values. Values for every run are given in Table S3 in the Supplementary File.
The second consideration is whether receptor accumulation limited transport in practice. Comparing the observed 24-h cumulative amount with the amount predicted by extrapolating the fitted linear phase, every run falls short by 7 to 21% (Table S3 in the Supplementary File). If receptor saturation were responsible for that shortfall, it would scale with receptor concentration; it does not. The aqueous comparator reached only 1.44 µg/mL, 8% of the concentration attained by the lead formulation, yet showed the largest shortfall of the series (79.3% of the linear prediction), whereas the lead formulation, at the highest receptor concentration of the series, showed the smallest (93.0%). Across all nine runs, the correlation between terminal receptor concentration and this ratio is positive (r = +0.55), which is the opposite of what receptor-limited transport would produce. The late-phase deviation is therefore attributable to donor depletion and unstirred-boundary-layer effects common to all runs rather than to exhaustion of receptor capacity. Because every formulation and the comparator were run under an identical receptor configuration, the ranking on which lead selection rests is unaffected.
All animal handling conformed to institutional and national guidelines and was approved under ethics code IR.AJUMS.AEC.1404.025.
3.9. Physical and Chemical Stability
The lead formulation F5 was evaluated for physical and chemical stability using a two-point comparative design contrasting the initial baseline state (Month 0) with the six-month endpoint (Month 6) under controlled long-term storage conditions of 25 ± 2 °C and 60 ± 5% relative humidity in light-protected containers, in accordance with ICH Q1A(R2) (26). No other composition was placed on stability; thus, the program describes the behavior of the lead formulation only and does not support comparisons of storage behavior between compositions. Intermediate sampling intervals (Months 1, 2, and 3) were not analytically performed. Rather than reporting calculated or interpolated intermediate values, reporting is restricted strictly to the two experimentally measured endpoints. This two-point design captures net endpoint change over the storage interval but does not meet the multiple-time-point requirement of ICH Q1A(R2), does not resolve intermediate degradation kinetics, and does not support the estimation of a shelf life. It is therefore reported as a robustness check rather than a formal stability study and is listed among the limitations in Section 5. Physical stability was assessed by monitoring changes in mean droplet size, PDI, and macroscopic appearance (clarity, phase separation) by dynamic light scattering and visual inspection, whereas chemical stability was quantified by assaying residual curcumin content using the validated UV-spectrophotometric method (Section 3.6). Because a time-zero content determination was not performed, chemical stability is expressed as the percentage of the nominal curcumin loading (0.2% w/w) recovered after six months, rather than as a percentage of a measured baseline content.
3.10. Statistical Analysis
Quantitative data are presented as mean ± SD of three independent determinations. Factorial effects were estimated from the eight design-point means. Because the eight-run factorial is unreplicated at the design level, a saturated model containing all three main effects and all four interactions leaves no residual degrees of freedom; therefore, the error term was estimated as pure error from the triplicate measurements at each design point (pooled variance, 16 degrees of freedom). Each effect was tested against this pure-error mean square, and 95% confidence intervals were constructed for every regression coefficient on the same basis. For responses in which one or more terms were not significant, a reduced model retaining only the significant terms was refitted by ordinary least squares; residual and normal probability plots were examined, and a lack-of-fit test was conducted by comparing the lack-of-fit mean square of the reduced model with the pure-error mean square. Where every term in the saturated model was significant, no residual degrees of freedom remain and a lack-of-fit test is not estimable; for those responses, the adequacy of the effect estimates is instead illustrated by a half-normal effect plot and by the replicate precision underlying the pure-error term. All diagnostics are presented in Figure S1 in the Supplementary File. Significance was set at P < 0.05.
4. Results
4.1. Analytical Method Validation
The spectrophotometric assay was linear over 0.0005 to 0.01 mg/mL, with the regression equation y = 68.019x − 0.0025 and R2 = 0.9997 (Figure 1). Precision was high, with intra- and inter-day RSD values below 2.5% at all levels; accuracy, expressed as percent recovery, ranged from 96.58% to 105.64%. The LOD and LOQ, derived from the regression residuals, were 0.22 µg/mL and 0.68 µg/mL, respectively. Level-by-level recovery values are presented in Table 5, and the consolidated validation profile is provided in Table 3.
Table 5.
Accuracy of the Analytical Method (% Recovery) at Different Concentration Levels (N = 3)
| Nominal concentration (mg/mL) | Mean Recovery ± SD (%) |
|---|---|
| 0.0005 | 96.58 ± 8.64 |
| 0.001 | 105.64 ± 4.57 |
| 0.002 | 98.26 ± 2.72 |
| 0.004 | 99.94 ± 1.25 |
| 0.006 | 100.70 ± 0.98 |
| 0.008 | 98.62 ± 0.42 |
| 0.010 | 100.66 ± 0.57 |
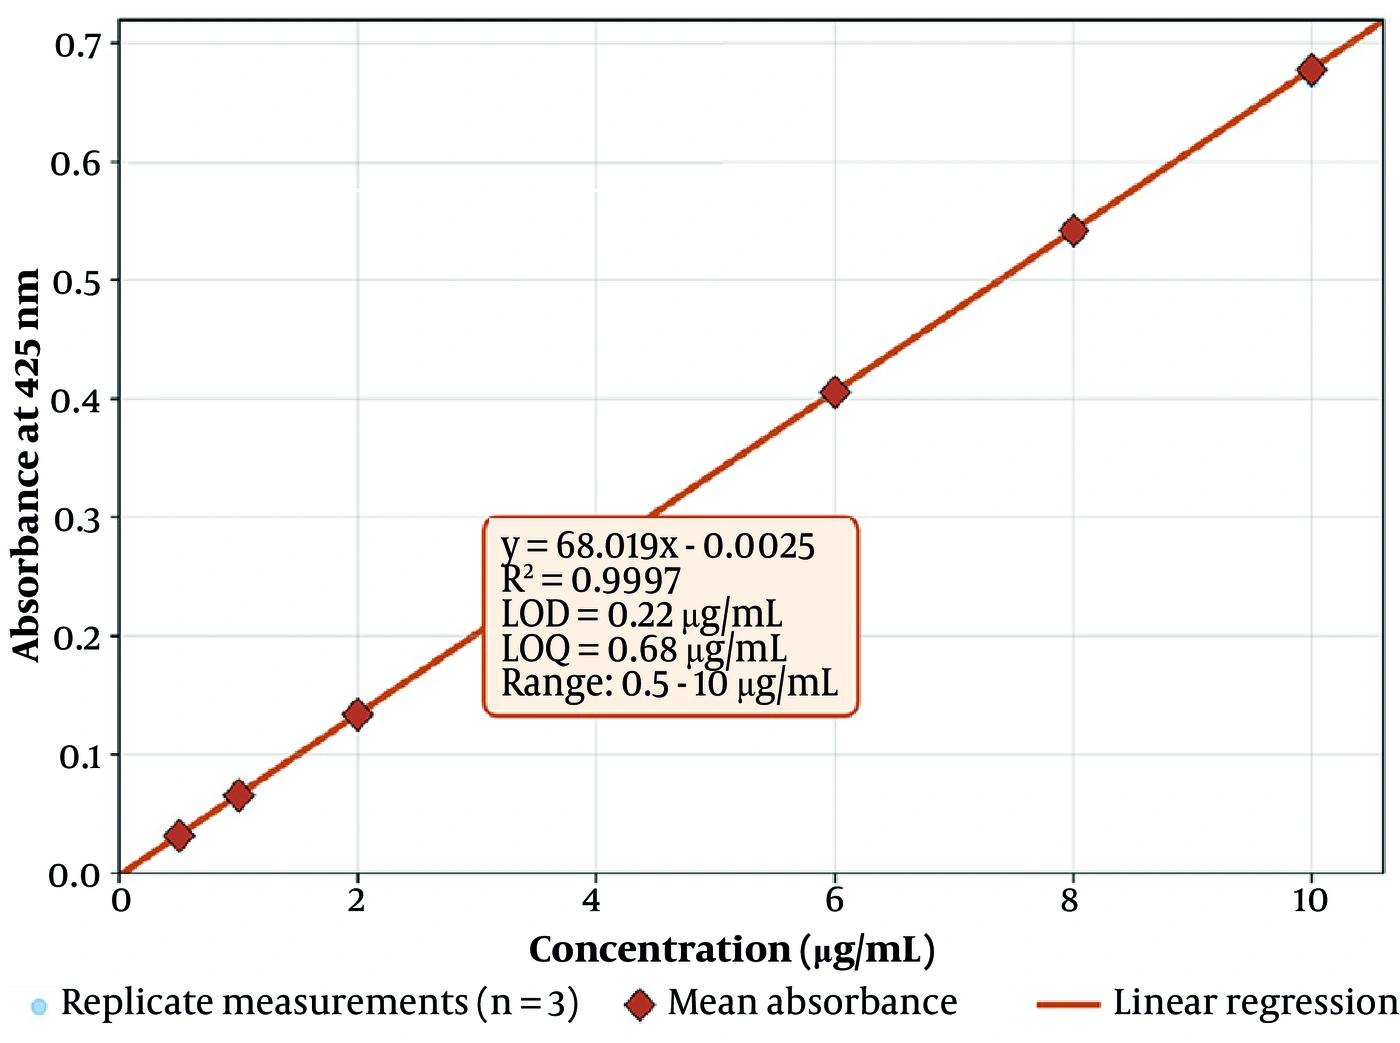
Figure 1.
Calibration curve of curcumin by UV-Vis spectrophotometry at 425 nm. Points are mean absorbance (n = 3) with individual replicates shown; the line is the least-squares regression. The inset reports the regression equation, coefficient of determination, and the ICH-derived LOD and LOQ.
4.2. Pseudo-Ternary Phase Behaviour
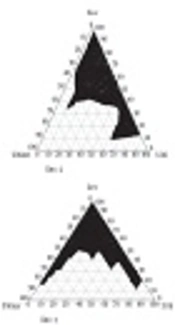
Pseudo-ternary phase diagrams constructed using the water titration method identified clear, transparent, single-phase regions corresponding to the isotropic microemulsion domains of the oleic acid/Transcutol P (1:1), Tween 80/Span 20, propylene glycol, and water phase system. Two diagrams were constructed, one for each Smix ratio, to resolve the equilibrium boundaries separately for Smix 1:1 and Smix 3:1 (Figure 2A and 2B, respectively). In both diagrams, the top apex designates the Smix percentage, whereas the two base vertices designate the oil phase (%) and the water phase (%). As the water phase was progressively titrated into each oil-Smix mixture, the systems remained optically clear within a defined compositional window before the onset of turbidity marked the boundary of the monophasic zone. These transparent envelopes, shaded in Figure 2, delineate the proportions of oil, Smix, and water that self-assemble into thermodynamically stable microemulsions (22, 24, 25). Increasing the surfactant proportion from Smix 1:1 to Smix 3:1 visibly expanded the clear isotropic area. The eight formulations (F1 to F8) subsequently evaluated in the 23 full factorial design were selected from well within these validated boundaries—F1 to F4 from the Smix 1:1 domain and F5 to F8 from the Smix 3:1 domain—so that every screened composition lay within the stable monophasic zone (26, 27). The positions of F1 to F8 within their respective microemulsion domains are superimposed in Figure 2.
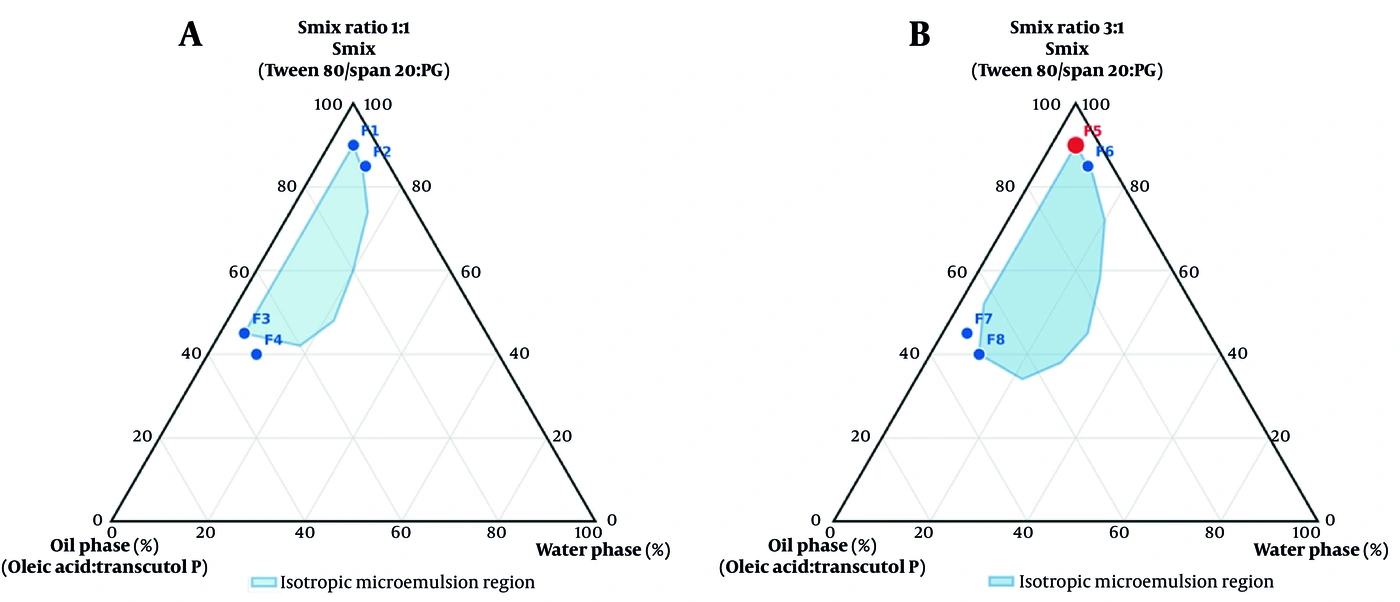
Figure 2.
Pseudo-ternary phase diagrams of the microemulsion systems mapping the clear isotropic domain boundaries for (A) Smix ratio 1:1 and (B) Smix ratio 3:1. The top apex designates the Smix percentage, the base vertices designate the oil phase (%) and water phase (%) respectively, with screened factorial runs F1 to F8 superimposed.
4.3. Solubility Screening
Curcumin solubility differed markedly among the excipients (22, 25). The highest solubility was recorded in Transcutol P (12.274 ± 0.037 mg/mL), followed by Tween 80 (8.574 ± 0.074 mg/mL), propylene glycol (6.354 ± 0.084 mg/mL), oleic acid (4.653 ± 0.026 mg/mL), and Span 20 (3.399 ± 0.017 mg/mL). Transcutol P was therefore included as a co-component of the oil phase, while Tween 80 and propylene glycol were selected as the surfactant and co-surfactant, respectively (Table 2).
4.4. Droplet Size and Polydispersity
All eight systems were within the nanometric microemulsion domain, with mean droplet diameters between 34.0 ± 1.0 nm (F5) and 158.0 ± 2.0 nm (F4) and PDI values of 0.201 to 0.384, indicating narrow, unimodal distributions (Table 6, Figure 3). The low-oil formulations (F1, F2, F5, F6) were consistently the smallest and most monodisperse, whereas the high-oil formulations were larger and more polydisperse. Increasing the surfactant proportion (Smix 3:1) further reduced size at a fixed oil level (7, 51), such that F5, with low oil, low water, and high surfactant, was the smallest and most narrowly distributed system.
Table 6.
Droplet Size and Polydispersity Index of Curcumin Microemulsions (N = 3) a
| Formulation | Droplet Size (nm) | PDI |
|---|---|---|
| F1 | 42.7 ± 1.53 | 0.215 ± 0.005 |
| F2 | 51.7 ± 0.58 | 0.239 ± 0.001 |
| F3 | 93.3 ± 0.58 | 0.314 ± 0.003 |
| F4 | 158.0 ± 2.00 | 0.384 ± 0.005 |
| F5 | 34.0 ± 1.00 | 0.201 ± 0.004 |
| F6 | 39.3 ± 0.58 | 0.232 ± 0.002 |
| F7 | 71.3 ± 0.58 | 0.266 ± 0.003 |
| F8 | 117.7 ± 1.15 | 0.373 ± 0.004 |
a Values are expressed as mean ± SD.
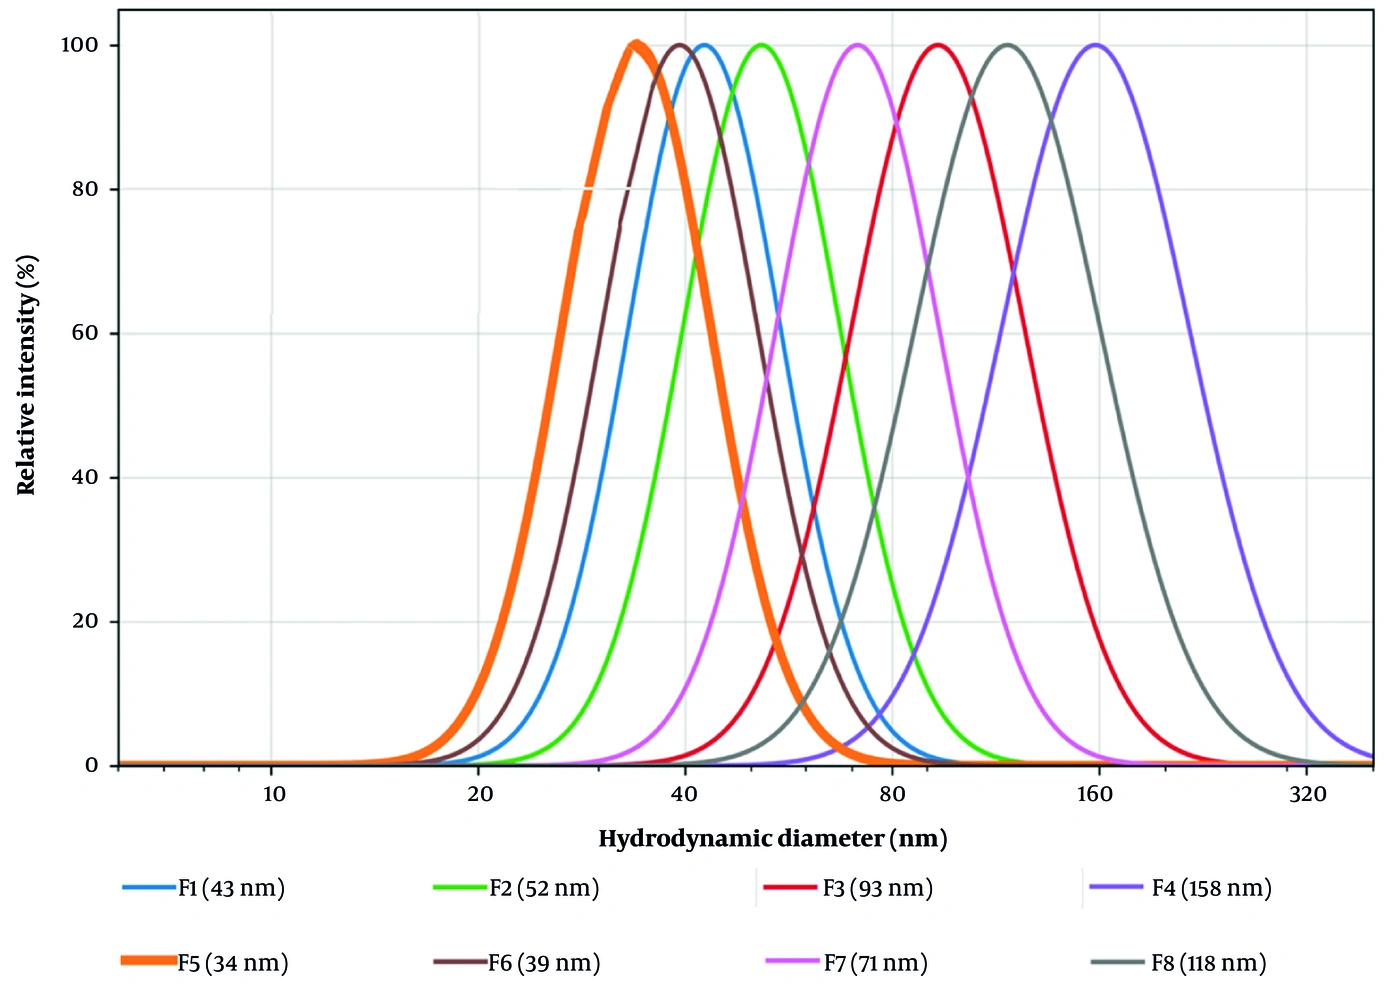
Figure 3.
DLS droplet-size distributions of the eight curcumin microemulsions. Low-oil formulations (F5, F6, F1, F2) show narrow, left-shifted peaks, while high-oil formulations shift toward larger diameters. F5 (bold) is the smallest and most monodisperse.
4.5. Factorial Modelling and Model Adequacy
All effects were tested against the pooled pure-error mean square derived from triplicate measurements at each design point (16 degrees of freedom). For droplet size, the pure-error mean square was 1.251 nm2, corresponding to a pooled measurement SD of 1.12 nm, or approximately 1.5% of the grand mean of 76.0 nm. Every main effect and interaction influenced droplet size (all P < 0.0001; Table 7). Oil content (A) was the dominant factor (effect +68.15 nm), the water phase (B) had a positive effect (+31.35 nm), a higher surfactant proportion (C) reduced size (−20.85 nm), and the strongest interaction was A × B (+24.20 nm). PDI followed the same hierarchy, with oil content again showing the leading effect (+0.1125). The very large F ratios for these two responses reflect the precision of the DLS measurement rather than an unusually good model: replicate SDs were 0.58 to 2.00 nm against factor effects of 5.5 to 68 nm, yielding an intrinsically high signal-to-noise ratio for the dominant terms. Ninety-five percent confidence intervals for every coefficient are provided in Table 7 and are narrow for the same reason.
Table 7.
Analysis of Variance of Formulation Variables on Droplet Size, Tested Against the Pooled Pure-Error Term (N = 3 Per Design Point, 16 Degrees of Freedom) a
| Term | Effect (nm) | Coefficient | 95% CI on coefficient | df | MS | F | P-Value |
|---|---|---|---|---|---|---|---|
| Oil content (A) | +68.15 | +34.08 | 33.59 to 34.56 | 1 | 27866.500 | 22273 | < 0.0001 |
| Water phase (B) | +31.35 | +15.68 | 15.19 to 16.16 | 1 | 5896.900 | 4713 | < 0.0001 |
| Smix ratio (C) | −20.85 | −10.43 | −10.91 to −9.94 | 1 | 2608.300 | 2085 | < 0.0001 |
| A × B | +24.20 | +12.10 | 11.62 to 12.58 | 1 | 3513.800 | 2809 | < 0.0001 |
| A × C | −10.30 | −5.15 | −5.63 to −4.67 | 1 | 636.500 | 509 | < 0.0001 |
| B × C | −5.50 | −2.75 | −3.23 to −2.27 | 1 | 181.500 | 145 | < 0.0001 |
| A × B × C | −3.65 | −1.83 | −2.31 to −1.34 | 1 | 79.900 | 64 | < 0.0001 |
| Pure error | – | – | – | 16 | 1.251 | – | – |
a Effect = mean response at the high level minus mean response at the low level; the regression coefficient is one-half of the effect. MS = mean square. The residual (error) term is pure error pooled from the triplicate measurements at each of the eight design points, corresponding to a measurement SD of 1.12 nm. Because all seven terms are significant, the model is saturated and no lack-of-fit test is estimable for this response; adequacy is illustrated instead by the half-normal effect plot and the replicate precision shown in Figure S1 in the Supplementary File. Reduced models and lack-of-fit tests for the permeation responses are given in Table S2 in the Supplementary File.
The permeation responses behaved differently. For steady-state flux, only oil content (effect −1.193 µg/cm2/h, P = 0.0018) and the A × B interaction (−0.828, P = 0.0199) were significant; the water phase approached, but did not reach, significance (P = 0.083), and the Smix ratio was not significant (P = 0.884). For the diffusion coefficient, only the Smix ratio was significant (effect +42.5 × 10⁻³ cm2/h, P = 0.0365). Because these two responses were not saturated, reduced models retaining only the significant terms were refitted and tested for lack of fit.
The reduced flux model was Jss = 5.901 − 0.596·A − 0.414·A·B, with R2 = 0.827 and adjusted R2 = 0.758. Its lack-of-fit mean square (0.528, 5 degrees of freedom) did not differ significantly from the pure-error mean square (0.615, 16 degrees of freedom), giving F = 0.86 and P = 0.529; thus, the reduced model is adequate. The reduced model for the diffusion coefficient, D = 125.25 + 21.25·C, yielded R2 = 0.527 with a lack-of-fit F of 0.78 and P = 0.598, again indicating no significant lack of fit, although the lower R2 reflects the substantially greater replicate variability of the derived diffusion coefficient. Residual plots, normal probability plots, a half-normal effect plot for droplet size, and the replicate precision underlying the pure-error term are presented in Figure S1 in the Supplementary File; reduced-model summaries and lack-of-fit tests are compiled in Table S2 in the Supplementary File. Residuals were symmetrically distributed about zero, showed no trend with fitted values, and lay close to the normal reference line. All p-values reported here were recomputed consistently against the pooled pure-error term and differ only marginally from those in the previous version of this manuscript.
These factor–response relationships are visualized as response surfaces in Figure 4A-F and summarized as a Pareto chart of effects on droplet size in Figure 5. In every response-surface panel, the Smix factor (C) is displayed at the high coded level of +1, the surfactant-rich 3:1 ratio, while oil (A) and water (B) vary from the low coded level of −1 to the high coded level of +1. The surfaces are interpolations between the four corner points of each face and should be interpreted as a visual summary of ranked effects, rather than as a fitted response surface capable of locating an interior optimum.
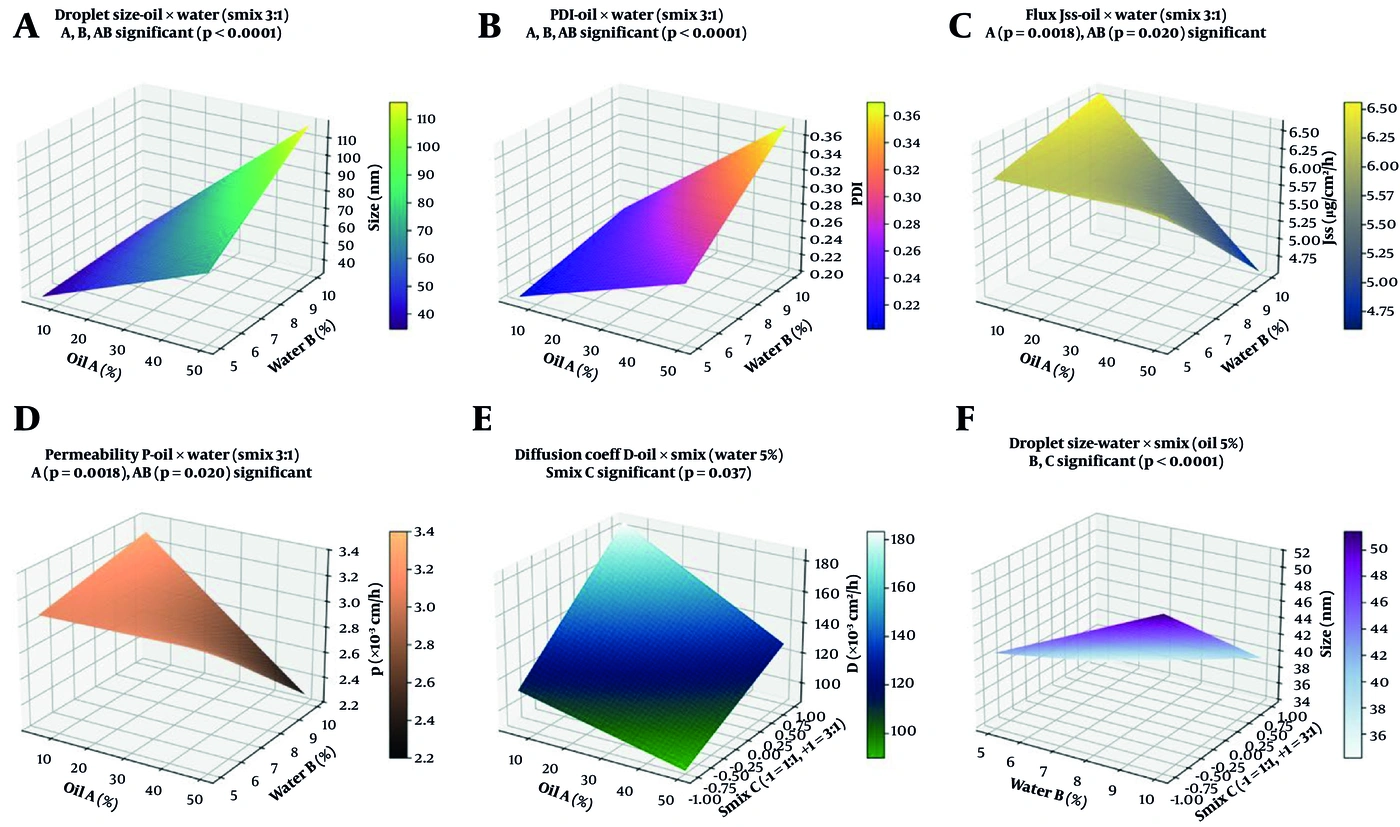
Figure 4.
Response-surface plots for the significant factor-response relationships. (A) Droplet size and (B) PDI versus oil and water (Smix 3:1); (C) steady-state flux Jss and (D) permeability coefficient P versus oil and water (P = 0.0018; A × B P = 0.020); (E) diffusion coefficient D versus oil and Smix (Smix ratio P = 0.037); (F) droplet size versus water and Smix at low oil. Throughout, coded factor C is held at its +1 high level (Smix 3:1), while oil (A) and water (B) run from −1 to +1. Panel D has been redrawn on the corrected permeability scale (Table 8).
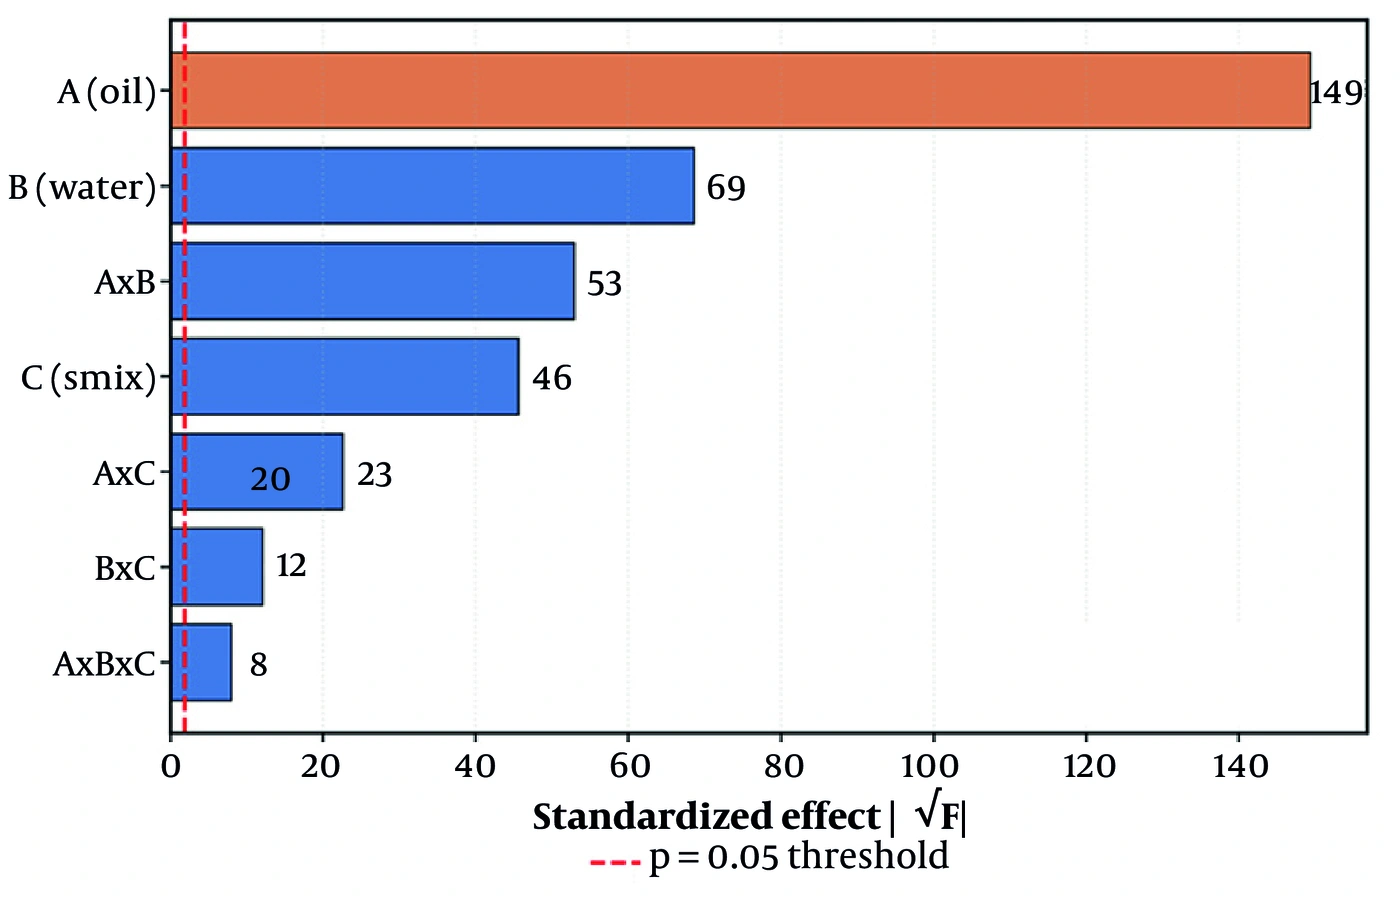
Figure 5.
Pareto chart of factor effects on droplet size. Oil content (A) dominates all other terms; the dashed line marks the P = 0.05 threshold.
The ordinary least-squares fits yielded the following coded polynomial models, in which each factor is expressed on the dimensionless −1/+1 scale (A = oil content, B = water phase, C = Smix ratio) and each regression coefficient equals one-half of the corresponding factorial effect reported in Table 7. For droplet size (nm):
For the polydispersity index:
For the steady-state flux (µg/cm2/h), the saturated model was:
Within the eight compositions tested, the flux model was highest at the low-oil vertex, where F5 and its low-oil counterparts are located. Because the design contains no center points, this identifies the best-performing corner of the tested space rather than a predicted optimum.
4.6. Viscosity
Viscosity ranged from 35.90 ± 1.05 cP (F5) to 200.93 ± 7.09 cP (F4) at 37 °C. All formulations exhibited mild shear-thinning, with viscosity gradually decreasing from 10 to 100 rpm. Even the most viscous system remained sufficiently low for comfortable topical spreading, while the low-oil formulations were notably fluid (Table 9).
Table 9.
Viscosity of Curcumin Microemulsions at 37 °C (N = 3) a
| Formulation | Viscosity (cP) | Formulation | Viscosity (cP) |
|---|---|---|---|
| F1 | 46.38 ± 1.52 | F5 | 35.90 ± 1.05 |
| F2 | 55.65 ± 1.23 | F6 | 43.70 ± 1.02 |
| F3 | 133.15 ± 4.33 | F7 | 113.03 ± 6.00 |
| F4 | 200.93 ± 7.09 | F8 | 179.23 ± 5.99 |
a Values are expressed as mean ± SD.
4.7. In Vitro Release and Release Kinetics
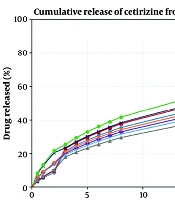
All microemulsions released curcumin more efficiently than the aqueous suspension, which liberated 2.84% at 24 h. Cumulative release from the microemulsions ranged from 78.74% (F8) to 94.95% (F5) over 24 h, with an initial rapid phase followed by sustained diffusion-controlled release; F5 was highest at every time point. The comparative kinetic analysis is shown in Table 10 and, in full, in Table 4. The Korsmeyer-Peppas model best described most formulations, whereas F5 was best described by the Higuchi model (R2 = 0.9994, n = 0.417) (45, 46). In all cases, the release exponent n was below 0.45, consistent with Fickian, diffusion-driven transport (47, 48).
Table 10.
Release Parameters and Best-Fit Kinetic Models of the Formulations (N = 3)
| Formulation | 24-h Release (%) | Best-fit Model | R² | Peppas n |
|---|---|---|---|---|
| F1 | 89.75 | Korsmeyer–Peppas | 0.9994 | 0.408 |
| F2 | 86.69 | Korsmeyer–Peppas | 0.9969 | 0.416 |
| F3 | 85.25 | Korsmeyer–Peppas | 0.9944 | 0.429 |
| F4 | 83.19 | Korsmeyer–Peppas | 0.9928 | 0.446 |
| F5 | 94.95 | Higuchi | 0.9994 | 0.417 |
| F6 | 81.47 | Korsmeyer–Peppas | 0.9810 | 0.404 |
| F7 | 87.98 | Korsmeyer–Peppas | 0.9926 | 0.400 |
| F8 | 78.74 | Korsmeyer–Peppas | 0.9852 | 0.310 |
| Comparator (aqueous) | 2.84 | – | – | – |
4.8. Ex Vivo Skin Permeation
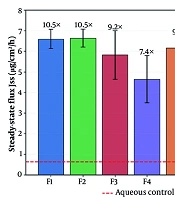
Across the rat skin barrier, the microemulsions delivered curcumin approximately one order of magnitude more effectively than the aqueous comparator, whose steady-state flux was 0.63 ± 0.10 µg/cm2/h. Microemulsion Jss values ranged from 4.55 to 6.64 µg/cm2/h, corresponding to ex vivo enhancement ratios of 7.2 to 10.5 relative to the comparator (Figure 6). The low-oil formulations again showed the highest flux and permeability. F5 exhibited the shortest lag time (0.82 ± 0.36 h) and the highest apparent diffusion coefficient (185 ± 72 × 10−3 cm2/h). In absolute terms, F5 achieved approximately 132.7 µg/cm2 of cumulative 24-h permeation versus approximately 11.1 µg/cm2 for the comparator (Table 8, Figure 7).
Table 8.
Ex Vivo Skin Permeation Parameters of the Formulations (N = 3) a
| Formulation | Jss (µg/cm²/h) | Tlag (h) | D ( × 10⁻³ cm²/h) | P ( × 10⁻³ cm/h) | 24-h cumulative (µg/cm²) | ER (Jss) |
|---|---|---|---|---|---|---|
| F1 | 6.60 ± 0.47 | 1.25 ± 0.33 | 112 ± 26 | 3.30 ± 0.24 | 130.93 ± 0.13 | 10.50 |
| F2 | 6.64 ± 0.44 | 1.32 ± 0.32 | 106 ± 23 | 3.32 ± 0.22 | 121.40 ± 0.28 | 10.50 |
| F3 | 5.82 ± 1.18 | 1.57 ± 0.32 | 89 ± 19 | 2.91 ± 0.59 | 109.46 ± 0.16 | 9.20 |
| F4 | 4.64 ± 1.15 | 1.53 ± 0.88 | 109 ± 55 | 2.32 ± 0.58 | 84.57 ± 0.16 | 7.40 |
| F5 | 6.16 ± 0.60 | 0.82 ± 0.36 | 185 ± 72 | 3.08 ± 0.30 | 132.73 ± 0.18 | 9.80 |
| F6 | 6.59 ± 0.43 | 1.20 ± 0.28 | 116 ± 26 | 3.30 ± 0.22 | 131.41 ± 0.14 | 10.50 |
| F7 | 6.21 ± 0.97 | 1.24 ± 0.59 | 127 ± 59 | 3.11 ± 0.48 | 116.57 ± 0.18 | 9.90 |
| F8 | 4.55 ± 0.55 | 0.94 ± 0.37 | 158 ± 52 | 2.28 ± 0.28 | 94.90 ± 0.23 | 7.20 |
| Comparator | 0.63 ± 0.10 | 1.69 ± 0.86 b | 92 ± 36 b | 0.32 ± 0.05 | 11.14 ± 0.18 | 1.00 |
a Values are expressed as mean ± SD. P was calculated as Jss / C0 with C0 = 2 mg/mL, the curcumin concentration in the applied formulation (0.2% w/w). ER (Jss) is calculated relative to the aqueous comparator flux of 0.63 µg/cm2/h and matches the values annotated in Figure 7.
b the lag time and the derived apparent diffusion coefficient of the aqueous comparator are obtained by extrapolating a near-flat profile (11.14 µg/cm2 over 24 h); their standard deviations exceed the differences between them and the microemulsion values, and they are reported for completeness only. They are regression artifacts rather than meaningful transport parameters and are not used in any comparison. Note also that two of the four descriptors are not independent measurements: D is calculated as h2/6·Tlag and is an algebraic transform of Tlag, and because C0 is identical for every run, P = Jss/C0 is exactly proportional to Jss (correlation 1.000). The four tabulated descriptors therefore carry two independent quantities, Jss and Tlag, and P and D are reported for comparability with the literature rather than as additional evidence.
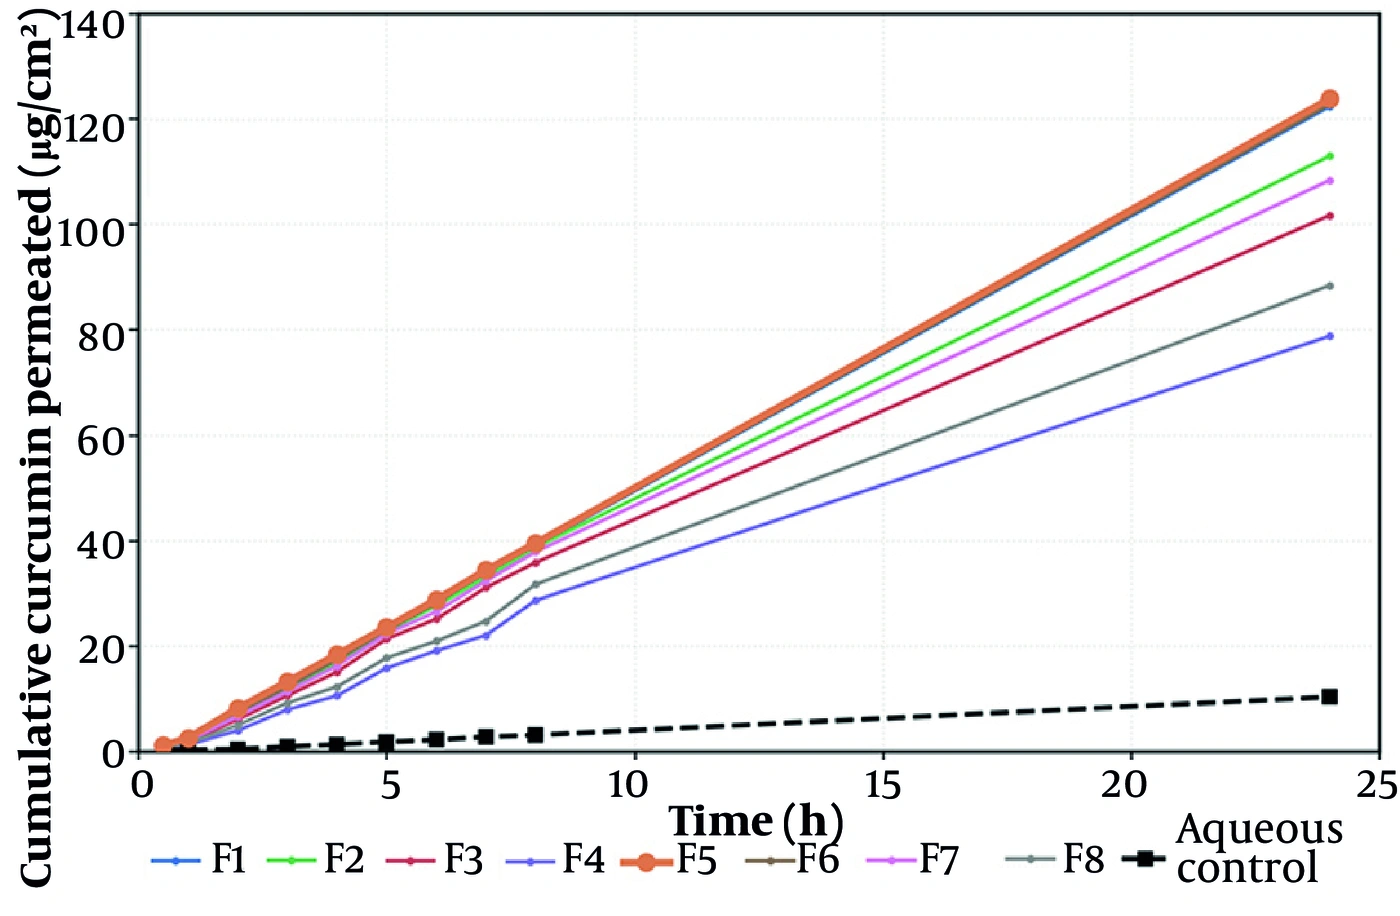
Figure 6.
Steady-state flux (Jss) of the eight formulations compared with the aqueous comparator (dashed line). Enhancement ratios (fold vs. comparator) are annotated above each bar. Error bars represent SD (n = 3).
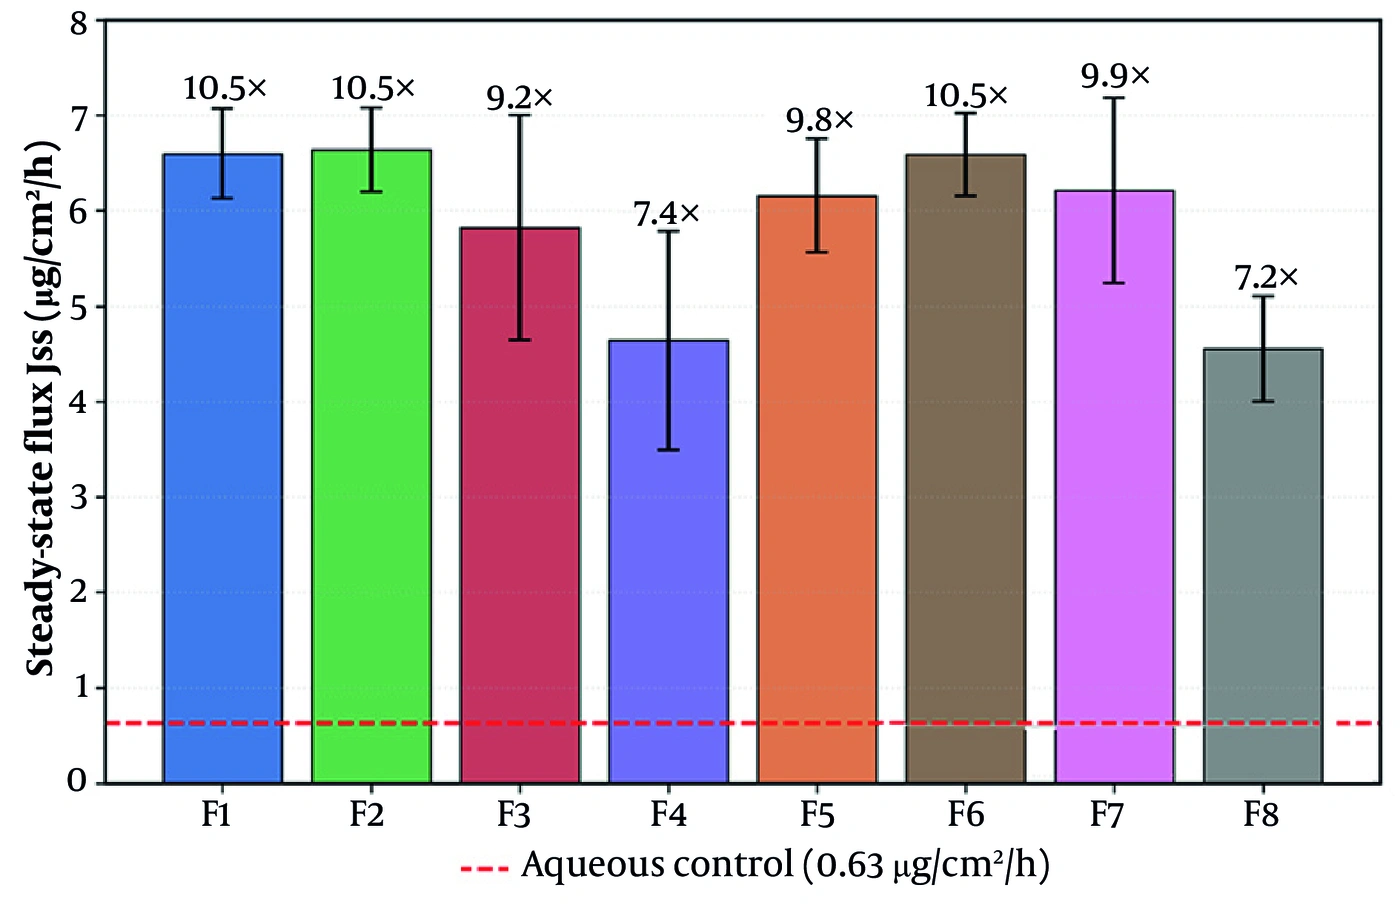
Figure 7.
Cumulative curcumin permeated per unit area (µg/cm2) versus time over 24 h across excised rat skin. The microemulsions form a tight high-flux band well separated from the near-flat aqueous comparator (dashed); F5 (bold) sits at the top of the band.
Two observations require comment. First, the apparent diffusion coefficient is calculated as D = h2/6·Tlag, making it an algebraic transform of lag time rather than an independent measurement; thus, the shortest lag time and highest apparent D for F5 represent the same finding expressed in two ways and are reported as such rather than as independent lines of evidence. Second, the lag time of the aqueous comparator (1.69 ± 0.86 h) lies within the range spanned by the microemulsions, which is initially unexpected. The comparator profile is near-flat, rising to only 11.14 µg/cm2 over 24 h, so the x-intercept is obtained by extrapolating a line with a very small slope. Its standard deviation (± 0.86 h) exceeds the difference between it and any microemulsion, and the derived D for the comparator (92 ± 36 × 10−3 cm2/h) carries the same uncertainty. The comparator lag time and diffusion coefficient are therefore regression artifacts of a near-zero-slope profile rather than physically meaningful transport parameters, and they are not used in any comparison. Only Jss and cumulative permeation, which are well determined for the comparator, are used to calculate enhancement ratios.
The permeability coefficients reported in Table 8 were recalculated using a donor concentration of 2 mg/mL, corresponding to the 0.2% w/w curcumin loading. Because this correction rescales the entire column by a constant factor, the ranking of the formulations, the ANOVA on P, and the significance of oil content and the A × B interaction are unchanged. The enhancement ratios in Table 8 were likewise recomputed consistently from the tabulated comparator flux of 0.63 µg/cm2/h and now agree with the values annotated in Figure 6.
4.9. Physical and Chemical Stability
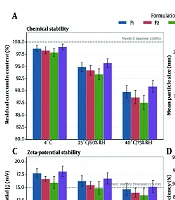
Stability was evaluated only for the lead formulation F5. Over the six-month storage period under ICH Q1A(R2) long-term conditions (25 ± 2 °C / 60 ± 5% RH, light-protected), the two-point comparison (Month 0 versus Month 6) showed minimal change. Droplet size changed from 34.0 ± 1.0 nm at Month 0 to 34.4 ± 1.1 nm at Month 6, an increase of 1.18%; the PDI remained unimodal, and there was no macroscopic phase separation, with the system retaining full optical clarity. Residual curcumin recovered at Month 6 was 99.9% of the nominal loading. Because no other composition was subjected to stability testing, no statement can be made regarding the comparative storage behavior of the high-oil or Smix 1:1 systems; the sentence in the previous version reporting greater size growth and incipient phase separation for F4 and F8 has been removed, as these measurements were not performed. These two measured time points describe the net change over the storage interval for F5. They do not define a degradation profile, and no shelf life is inferred. The numerical Month-0 and Month-6 values (mean ± SD, n = 3) are provided in Table S1 in the Supplementary File.
5. Discussion
A full factorial screen of this size is useful because it ranks the compositional variables that control performance. In this dataset, one variable, oil content, dominates the others, and the discussion below describes how the measured responses relate to it and why F5 was selected as the lead among the eight compositions tested (7, 33).
Consider first the diffusion coefficient, the response that the ANOVA associated with the Smix ratio (P = 0.037) rather than with oil content. Shifting F5 to the 3:1 ratio increases its surfactant content to 67.50% w/w of the formulation, corresponding to 75% of the Smix phase, while limiting the co-surfactant to 22.50% w/w; in contrast, its 1:1 counterpart F1 contains an even 45.00%/45.00% split (Table 1). A surfactant-dominant interface of this type would be expected to form a denser, more closely packed nonionic film at the oil–water boundary (24, 28), and such packing is the conventional explanation for the smaller droplet sizes and the higher apparent mobility observed at the 3:1 ratio (33, 34). We did not measure interfacial tension, interfacial packing density, or film rigidity in these systems; therefore, this account is presented as a hypothesis consistent with the size and phase-behavior data rather than as a demonstrated mechanism. It is also important to note that the apparent diffusion coefficient is derived from the lag time by D = h2/6·Tlag and is not an independent measurement; accordingly, the association between Smix ratio and D is equivalently an association between Smix ratio and lag time.
The flux model requires a separate comment. In Eq. 3, the Smix ratio carries a small negative coefficient (−0.024) that was not statistically significant (P = 0.884), which might appear inconsistent with the surfactant-rich composition of the lead formulation. However, the two responses are governed by different quantities. Steady-state flux was determined primarily by oil content (effect −1.193, P = 0.0018) and by the A × B interaction (−0.828, P = 0.0199), which together describe droplet size and bulk vehicle resistance. Once oil was held at its low level, further surfactant enrichment produced no measurable difference in flux. The role attributed to the high surfactant load is therefore thermodynamic, expressed through droplet curvature and lag time rather than through the flux term, and this interpretation remains a hypothesis in the absence of direct interfacial or biophysical measurements.
The lag-time data are consistent with the bulk rheology. F5 combines a high surfactant fraction with the lowest oil content of the series (5%). The oil phase, rather than the surfactant, provides the dispersed volume around which viscosity-generating micellar networks form (24, 28). At 5% oleic acid/Transcutol P, little oil is available to form such networks, and the system remained an ultra-low-viscosity fluid at 35.90 ± 1.05 cP. A low-viscosity vehicle imposes minimal unstirred-boundary-layer resistance, allowing the drug to reach and begin to partition into the barrier quickly (50), which is consistent with the shortest lag time in the study (0.82 h). The high-oil system F4 (200.93 cP) showed the opposite behavior. Viscosity was measured at 37 °C only; therefore, the temperature dependence of this behavior, and its relationship to the 25 °C storage condition used for stability, were not characterized.
An earlier version of this discussion attributed part of the transport advantage to the interfacial charge of the droplet surface and to electrostatic adhesion to the corneocyte surface. Because zeta potential was not measured in these systems, that argument is not supported by the data presented here and has been removed. The data do support that the smallest and most narrowly distributed droplets were also the fastest permeating, and that droplet size and vehicle viscosity, both controlled by oil content, are sufficient to account for the observed ranking without invoking a surface-charge mechanism.
Underlying all three parameters is the removal of curcumin's dissolution limitation. Every microemulsion out-released the aqueous suspension by more than an order of magnitude, 2.84% versus up to 94.95% at 24 h, because molecular dissolution at the oil–water interface removes the solubility ceiling that defines BCS IV behavior (9, 12), and the Fickian release exponents (n < 0.45) are consistent with diffusion-controlled liberation (47, 48). The ex vivo enhancement of roughly 7- to 10.5-fold over the aqueous comparator is unlikely to arise from solubilization alone, as several excipients are recognized barrier modulators: oleic acid has been reported to disorder the ceramide lamellae, Transcutol and propylene glycol to partition into and plasticize the barrier, and the surfactant blend to fluidize intercellular lipids (30, 32, 35, 36). We did not measure barrier lipid organization; therefore, the relative contributions of solubilization and barrier modulation cannot be separated on the basis of the present data.
The comparison used here requires an explicit caveat. The comparator was an aqueous suspension of a BCS class IV compound with negligible intrinsic permeation; thus, it serves as a non-solubilized negative control establishing the baseline attributable to the drug alone. It is not a positive control, and the enhancement ratios reported here should not be interpreted as demonstrating superiority over an existing product. No marketed or established topical curcumin formulation, such as a commercial cream or hydrogel, was tested in parallel. This is a significant limitation of the study design, and the absence of such a comparator means that the clinical or formulation-development significance of the enhancement cannot be established from these data. For context, conventional topical vehicles such as simple hydrogels, creams, and ointments have generally been reported to deliver curcumin at low fluxes because they neither dissolve the drug molecularly nor fluidize the stratum corneum (38); however, this is a literature comparison across different laboratories, membranes, and protocols and is not equivalent to a head-to-head experiment.
Compared with vesicular and lipid-nanoparticle carriers, curcumin-loaded nanostructured lipid carriers and liposomes, and analogous liposomal systems for related polyphenols such as naringenin, can achieve meaningful enhancement over free drug, with reported skin fluxes frequently between roughly 0.09 and 2.5 µg/cm2/h and often favoring retention over transport (19, 20, 52). The microemulsions studied here reach single-digit fluxes while forming spontaneously, without the hydration, sonication, extrusion, or high-pressure homogenisation required for those systems (24, 25), and the lead formulation showed little change over six months of storage, with a 1.18% drift in droplet size and recovery of 99.9% of its nominal curcumin loading (26, 27). Stability was assessed for F5 only; therefore, this statement pertains to the lead formulation and is not a comparison across the series. The counterweight is the high surfactant load of the lead formulation (67.50% w/w of the formulation, equivalent to 75% of the Smix), which, together with the greater permeability of rat skin, indicates that these results represent an ex vivo proof of concept rather than a projection of human clinical performance. Formal cutaneous-tolerability evaluation is required before any clinical development (30, 37, 53, 54).
5.1. Limitations
Several limitations should be considered when interpreting these results.
Design. The 23 factorial contains no center points and no design-level replication. It can rank main effects and interactions and identify the best-performing composition among those tested, but it cannot detect curvature and cannot locate a true optimum. F5 is therefore reported as a lead formulation selected among eight screened compositions, rather than as an optimized formulation.
Comparator. The aqueous suspension is a non-solubilized negative control. No commercial or conventional topical curcumin product was tested in parallel; therefore, the enhancement ratios describe the difference between a solubilizing vehicle and free drug rather than an advantage over an existing formulation.
Structural characterization. Characterization relied on DLS, phase mapping, rheology, and direct content determination. Morphological confirmation by cryo-TEM and electrokinetic characterization by zeta potential were not performed. The justification provided in Section 3.5 is based on the established physical chemistry of single-phase isotropic microemulsions rather than on direct measurements in these systems.
Analytical specificity. Quantification used a validated but non-separative UV method. The argument that the 425 nm band is specific to intact curcumin is based on the known absorption of its degradation products rather than on chromatographic confirmation in the present receptor samples. HPLC cross-validation would be required before these values are considered absolute analytical measures.
Drug content. A direct assay of curcumin content at time zero was not performed. The nominal loading of 0.2% w/w was therefore used as the reference concentration for the permeability coefficients and for the six-month chemical stability figure. The justification for treating the nominal loading as the actual loading is provided in Section 3.5 and is based on the solubilization capacity of the excipient system and the absence of any separation step during preparation; however, this is an inference rather than a measurement. A content assay would be required to confirm it.
Receptor conditions. The receptor medium was unmodified phosphate buffer, in which curcumin has very low equilibrium solubility, and the concentration reached at the 24-h endpoint exceeded the conventional 10% sink threshold. The quantitative analysis in Section 3.8 and Table S3 in the Supplementary File shows that the concentration gradient driving transport was nonetheless preserved to within 1% of the donor concentration under the most unfavorable assumption that all transported drug remained dissolved, and to within 0.05% on a dissolved-concentration basis, and that the late-phase deviation from linearity does not scale with receptor concentration and is therefore not attributable to receptor saturation. The direction of any residual bias is conservative; thus, the reported fluxes and enhancement ratios represent lower bounds. Because all runs shared an identical receptor configuration, the ranking remains internally valid. Absolute permeability values should nonetheless be treated as vehicle-comparison measures rather than as transferable constants, and a co-solvent- or surfactant-modified receptor medium is the appropriate configuration for future quantitative permeation work with this compound. We did not verify the physical state of curcumin in the receptor phase and cannot exclude the possibility that some fraction deposited at the membrane surface; the linearity of the cumulative profiles to 24 h and the absence of any concentration-dependent deviation across the series argue against a material effect, but this remains an inference.
Stability. Physicochemical stability was assessed for the lead formulation F5 only, and at two time points only, Month 0 and Month 6, under ICH long-term conditions. This does not satisfy the multiple-time-point requirement of ICH Q1A(R2), does not resolve intermediate degradation kinetics, does not support the estimation of a shelf life, and does not allow comparison of the storage behavior of the eight compositions. Stability was also assessed on the liquid microemulsion prior to any gel incorporation.
Mechanistic interpretation. The mechanistic accounts offered above, including interfacial film packing, chemical potential at the membrane, and barrier lipid fluidization, are hypotheses consistent with the observed size, viscosity, and transport data. They were not tested directly; techniques such as FTIR, DSC, small-angle scattering, or interfacial tensiometry would be required to establish them.
Model. Excised rat skin is markedly more permeable than human skin; therefore, absolute flux values will not transfer directly to the clinic, although the rank ordering should (18, 50). The barrier-integrity screening applied here supports the internal validity of that ranking by excluding compromised specimens. Confirmatory studies using human skin or reconstructed epidermis, in vivo anti-inflammatory efficacy testing, formal in vivo skin-irritation assessment (Draize test) and human patch testing, and extended multi-point stability testing under both long-term and accelerated conditions are the logical next steps before F5 advances toward a finished topical product.
5.2. Conclusions
A 23 full factorial screen resolved and ranked the formulation variables governing curcumin microemulsion performance and produced a clear selection rule among the compositions tested: a higher surfactant proportion (Smix 3:1) was associated with the higher apparent diffusion coefficient and the shorter lag time, whereas a lower oil content yielded higher skin flux and permeability and lower vehicle viscosity. The lead formulation F5 (5% oil, 5% water, Smix 3:1) best combined the desirable attributes across the measured responses: the smallest droplets (34.0 ± 1.0 nm), the lowest PDI (0.201 ± 0.004), the lowest viscosity (35.90 cP), the highest 24-h release (94.95%, Higuchi kinetics, R2 = 0.9994), the shortest lag time (0.82 h), the largest cumulative permeation (approximately 133 µg/cm2), and, on a six-month two-point assessment conducted for this formulation alone, minimal physical and chemical change (+1.18% in droplet size; 99.9% of nominal content recovered). Relative to an aqueous curcumin suspension, the microemulsions increased steady-state flux by approximately 7- to 10.5-fold as an ex vivo screening ratio. No other composition achieved this profile, which is why F5 is identified as the lead among the eight compositions screened rather than as a mathematical optimum; the design used here cannot locate an optimum. These findings establish curcumin microemulsions, and F5 in particular, as a promising lead platform for an ex vivo and in vitro proof of concept of a topical curcumin product (4, 6, 27) and provide a data-driven starting point for subsequent in vivo efficacy and safety evaluation. Because the lead formulation carries a high total surfactant load (67.50% w/w of the formulation, equivalent to 75% of the Smix) and both Tween 80 and oleic acid can occasionally provoke mild irritation or barrier disruption with chronic use, formal in vivo cutaneous-tolerability testing, specifically the Draize skin-irritation test or human patch testing, is a mandatory next step before clinical translation.