
1. Background
Chronic inflammatory dermatoses, including psoriasis, atopic dermatitis, seborrheic dermatitis, and contact eczema, affect a substantial proportion of the global population and impose a considerable burden on quality of life and healthcare systems (1, 2). The therapeutic mainstay for these conditions has long been topical corticosteroids, whose potent anti-inflammatory efficacy is offset by well-recognized liabilities with prolonged use, including cutaneous atrophy, telangiectasia, striae, tachyphylaxis, and, following percutaneous absorption, systemic hypothalamic-pituitary-adrenal axis suppression (3, 4). These limitations have intensified the search for phytochemical anti-inflammatory agents that can be delivered locally with a wider therapeutic index (5).
Curcumin [(1E,6E)-1,7-bis(4-hydroxy-3-methoxyphenyl)hepta-1,6-diene-3,5-dione], the principal curcuminoid of Curcuma longa L., is among the most extensively investigated natural anti-inflammatory molecules (6). Its pharmacological activity is mechanistically anchored in suppression of the nuclear factor-kappa B (NF-κB) signaling cascade, downregulation of cyclooxygenase-2 (COX-2) and inducible nitric oxide synthase, inhibition of pro-inflammatory cytokines such as tumor necrosis factor-alpha and interleukin-6, and scavenging of reactive oxygen species (7-9). In cutaneous inflammation, these convergent pathways position curcumin as a rational corticosteroid-sparing candidate, and nano-curcumin formulations have shown therapeutic promise in controlled clinical settings (10, 11). Nevertheless, the molecule is notoriously difficult to formulate: it is practically insoluble in water, chemically labile under neutral-to-alkaline and photolytic conditions, and subject to rapid metabolic degradation (12, 13). Its pronounced lipophilicity (calculated log P ≈ 3.2) favors partitioning into lipid domains but simultaneously limits dissolution in the hydrated viable epidermis; consequently, unformulated curcumin penetrates the skin poorly (14).
The principal obstacle to cutaneous delivery is the stratum corneum, whose “brick-and-mortar” architecture—corneocytes embedded in highly ordered, crystalline intercellular lamellae of ceramides, cholesterol, and free fatty acids—constitutes the rate-limiting barrier to percutaneous transport (15, 16). Overcoming this barrier without compromising its integrity is the central challenge in dermal drug delivery. Among the nanocarrier strategies devised for this purpose, vesicular systems have attracted particular attention because they can co-localize a lipophilic payload with amphiphilic bilayer components that interact directly with skin lipids (17, 18).
Niosomes—self-assembled vesicles composed of non-ionic surfactants and cholesterol—offer several advantages over their phospholipid analogues (liposomes), including superior chemical and oxidative stability, lower cost, freedom from the batch-to-batch variability of natural phospholipids, and a broad, tunable range of surfactant hydrophilic-lipophilic balance (19-21). Sorbitan esters (Span series) and polysorbates (Tween series) are the most widely used building blocks; their ratio, together with the cholesterol content that modulates bilayer fluidity and rigidity, governs vesicle size, lamellarity, encapsulation capacity, and colloidal charge (22, 23). Critically, non-ionic surfactants can act as penetration enhancers by intercalating into and fluidizing the stratum corneum lipid lamellae, thereby generating transient conduits for drug diffusion (24, 25).
Because these responses are jointly determined by multiple, potentially interacting compositional variables, an efficient and statistically defensible development pathway requires a design-of-experiments framework rather than one-factor-at-a-time optimization (26, 27). A two-level full-factorial design is particularly suited to the screening stage because it quantifies not only the main effects of each factor but also their two-way interactions, which frequently dominate the behavior of self-assembled colloidal systems and are most transparently interpreted using three-dimensional response-surface and two-dimensional contour representations (28). Our group has previously applied factorial and mechanistic modeling approaches to vesicular and microemulsion carriers for topical and ocular delivery (29-31), most recently in the statistical development and ex vivo skin-permeation evaluation of a naringenin liposomal formulation for topical delivery (32). The present study extends this design-of-experiments methodology to a curcumin niosomal system.
2. Objectives
In this work, we designed a 22 full-factorial screening study in which cholesterol content and the Span 80/Tween 80 surfactant mixture were varied at two levels to generate four curcumin-loaded niosomal formulations. Each formulation was characterized in terms of hydrodynamic size, polydispersity index, encapsulation efficiency, and zeta potential; factor–response relationships were visualized as three-dimensional response surfaces and two-dimensional contour maps; in vitro release was modeled against a comprehensive kinetic panel; and ex vivo permeation across excised rat abdominal skin was quantified in Franz diffusion cells relative to a free-curcumin control. Particular emphasis was placed on the geometric interpretation of interaction-dominated response surfaces, the mechanistic basis of the zeta-potential interaction term, and the reconciliation of divergent factor dependencies of colloidal stability and transdermal flux.
3. Methods
3.1. Materials
Curcumin, cholesterol, sorbitan monooleate (Span 80), polyoxyethylene sorbitan monooleate (Tween 80), chloroform, methanol, and potassium dihydrogen phosphate were purchased exclusively from Merck KGaA (Darmstadt, Germany). All reagents were of analytical grade and used as received. Double-distilled water was used throughout, and phosphate-buffered saline (PBS, pH 7.4) served as the hydration and receptor medium.
3.2. Experimental Design
A two-level, two-factor (22) full-factorial design was implemented to screen the effects of two independent formulation variables on the measured responses. The coded independent variables were cholesterol content (X1) and the total Span 80/Tween 80 surfactant mixture (X2), each studied at a low level coded as -1 and a high level coded as +1. Cholesterol was set at 150 mg (low) and 300 mg (high), and the surfactant mixture was set at low and high levels according to the fixed Span/Tween mass ratio used throughout. The curcumin load (50 mg per batch), the hydration volume (10 mL PBS, pH 7.4), and the sonication protocol were held constant. The design generated four formulations: F1 (X1 = +1, X2 = +1), F2 (X1 = -1, X2 = +1), F3 (X1 = +1, X2 = -1), and F4 (X1 = -1, X2 = -1). Each response was fitted to a first-order coded polynomial incorporating the two main effects and their interaction term, Y = b0 + b1X1 + b2X2 + b12X1X2, and the significance of each coefficient was evaluated by ordinary least-squares analysis of variance. The fitted models were rendered as three-dimensional response surfaces and two-dimensional contour plots to visualize the main effects and interaction curvature.
3.3. Preparation of Curcumin Niosomes
Curcumin niosomes were prepared using the thin-film hydration method (19, 30, 31). Accurately weighed quantities of Span 80, Tween 80, cholesterol, and curcumin (50 mg) were dissolved in chloroform-methanol (2:1, v/v) in a round-bottom flask. The organic solvent was removed under reduced pressure using a rotary evaporator above the transition temperature of the surfactants, depositing a thin, uniform lipid film on the flask wall; residual solvent was eliminated by overnight desiccation. The dry film was hydrated with 10 mL PBS (pH 7.4) under gentle agitation to yield a multilamellar niosomal suspension, which was then subjected to probe sonication at a frequency of 20 kHz and a power output of 150 W, applied in a pulsed cycle of 40 s on and 20 s off with the suspension maintained in an ice bath, to obtain a narrow, nanometric size distribution. Formulations were stored at 4 °C, protected from light, until characterization.
3.4. Particle Size and Polydispersity
The mean hydrodynamic diameter, size distribution, and polydispersity index (PDI) were determined by dynamic light scattering (DLS) using a Scatteroscope particle-size analyzer (QuDix, Seoul, South Korea) with a solvent refractive index of 1.330 and viscosity of 0.97 - 0.99 cP at 21 - 22 °C. Samples were diluted with filtered double-distilled water to avoid multiple scattering, and each measurement was performed in triplicate; data are reported as intensity-weighted distributions (33, 34).
3.5. Zeta Potential
Zeta potential was measured by electrophoretic light scattering using the same platform. Diluted samples were introduced into the electrophoretic cell, and electrophoretic mobility was converted to zeta potential. Each formulation was measured in triplicate, and results are expressed as the mean ± standard deviation (23, 33).
3.6. Encapsulation Efficiency
Encapsulation efficiency was determined using an indirect ultrafiltration method (26, 35). An aliquot of each niosomal suspension was centrifuged in a centrifugal ultrafiltration device to separate free (unentrapped) curcumin in the aqueous filtrate from the vesicle-associated fraction. Free curcumin in the ultrafiltrate was quantified spectrophotometrically against a validated calibration curve (y = 68.019x − 0.0025), and encapsulation efficiency was calculated as EE% = [(total − free)/total] × 100. Measurements were performed in triplicate.
3.6.1. Analytical Method Validation
The ultraviolet (UV) assay was validated for linearity, range, sensitivity, accuracy, and precision in accordance with International Council for Harmonisation (ICH) Q2(R2) principles. Calibration standards of curcumin in phosphate buffer (pH 7.4) were prepared across the working range and analyzed by ordinary least-squares regression of absorbance at 425 nm on nominal concentration, with inspection of the residual plot for systematic curvature. The limits of detection and quantitation were defined as 3.3σ/S and 10σ/S, where σ is the standard deviation of the y-intercept and S is the slope of the regression. Accuracy was expressed as the back-calculated recovery of each calibrator, and precision as the relative standard deviation of replicate determinations within a day (repeatability) and between days (intermediate precision). All subsequent quantifications of encapsulation, release, and permeation were performed within the validated range.
3.7. In Vitro Release Study
In vitro release was studied using vertical Franz diffusion cells (36, 37). The niosomal formulation was placed in the donor compartment and separated from the receptor compartment by a semipermeable membrane. The receptor chamber contained PBS (pH 7.4) at 37 ± 0.5 °C under continuous stirring. At predetermined intervals over 24 h, receptor aliquots were withdrawn and immediately replaced with an equal volume of fresh pre-warmed medium to maintain sink conditions. Samples were assayed spectrophotometrically, and cumulative percentage release was calculated with correction for sampling dilution. All experiments were conducted in triplicate.
3.8. Release Kinetic Modeling
To elucidate the release mechanism, cumulative release data were fitted to a comprehensive panel of models: zero-order, first-order, Higuchi, Korsmeyer-Peppas, Hixson-Crowell, Baker-Lonsdale, Weibull, and probabilistic (Wagner) models (38-42). Goodness of fit was assessed by the coefficient of determination (R2) and mean percentage error, and the best-fit model was assigned accordingly. The Korsmeyer-Peppas release exponent (n) was derived from the slope of the log-release versus log-time regression over the initial phase (≤ 60% release) to classify the diffusional mechanism.
3.9. Ex Vivo Skin Permeation Study
Ex vivo permeation was evaluated across full-thickness abdominal skin excised from adult male Wistar rats (36, 43, 44). Following euthanasia under the approved ethical protocol, abdominal hair was removed, the skin was excised, adhering subcutaneous fat was removed, and tissue integrity was verified. The skin was mounted between the donor and receptor compartments of Franz diffusion cells, with the stratum corneum facing the donor side and an effective diffusion area of 4.906 cm2. The receptor compartment (38 mL PBS, pH 7.4) was thermostatted at 37 ± 0.5 °C under continuous stirring. Each niosomal formulation and a free-curcumin suspension of equivalent dose as the control were applied to the donor compartment; receptor samples were collected and replenished at scheduled intervals over 24 h and assayed spectrophotometrically. The cumulative amount permeated per unit area (µg/cm2) was plotted against time. Steady-state flux (Jss) was obtained from the slope of the linear region (3 - 8 h), lag time (Tlag) from its x-intercept, the permeability coefficient (Kp) as Jss divided by donor concentration, and the enhancement ratio (ER) as the quotient of niosomal and control fluxes. All determinations were performed in triplicate (n = 3).
3.10. Physicochemical Stability Study
The physicochemical stability of the four niosomal dispersions was assessed as a two-point comparative evaluation, contrasting the baseline state (Month 0) with the six-month endpoint (Month 6) under three storage conditions aligned with ICH Q1A(R2) guidance: refrigerated (4 ± 2 °C), long-term real-time (25 ± 2 °C/60 ± 5% RH), and accelerated (40 ± 2 °C/75 ± 5% RH). Three independently prepared batches of each formulation (n = 3 biological replicates) were sealed in amber glass vials protected from light. Intermediate months (1, 2, and 3) were not analytically sampled; this design was selected to assess endpoint robustness rather than to reconstruct a degradation time course, and accordingly no first-order rate constants or Arrhenius parameters were derived. At Month 0 and Month 6, samples were equilibrated to ambient temperature and characterized for mean hydrodynamic diameter, polydispersity index, and zeta potential by dynamic and electrophoretic light scattering; for encapsulation efficiency by the indirect ultrafiltration procedure of Section 3.6; and for residual active drug content by UV spectrophotometry at 425 nm following complete disruption of the vesicles in methanol and interpolation from the validated calibration curve. Residual content is expressed as a percentage of the Month 0 assay value, and the net baseline-to-endpoint change at each temperature is reported.
3.11. Ethical Considerations
All animal procedures were reviewed and approved by the Institutional Animal Ethics Committee of Ahvaz Jundishapur University of Medical Sciences under ethical approval code IR.AJUMS.AEC.1404.023 and were performed in accordance with institutional and national guidelines for the care and use of laboratory animals. The study was conducted within the framework of institutional research project No. N-0406 (Doctor of Pharmacy thesis of Amirhossein Zarei).
3.12. Statistical Analysis
Quantitative results are expressed as the mean ± standard deviation of three independent determinations. Factorial responses were analyzed by ordinary least-squares regression, and the significance of model terms was assessed by analysis of variance, with P < 0.05 considered significant. Coded polynomial coefficients, their standard errors and 95% confidence intervals, coefficients of determination (R2), adjusted R2, and leave-one-out predicted R2 are reported for each response, and the fitted surfaces are presented graphically. The assumptions underlying the analysis of variance were verified for every response: normality of residuals by the Shapiro-Wilk test (scipy.stats.shapiro), homogeneity of variance across the four design points by the mean-centered Levene test (scipy.stats.levene) confirmed by the Bartlett test, and independence by the Durbin-Watson statistic, with residual-versus-fitted and normal quantile-quantile plots inspected for each model (Table 1, Figure S2 in the Supplementary File). All analyses were performed in Python 3.12 with SciPy 1.17.1 and NumPy, and significance was set at P < 0.05.
Table 1.
Verification of the Analysis-of-Variance Assumptions for the Four Coded Factorial Models (N = 12 per Response) a
| Response | Shapiro-Wilk W (P) | Levene F (P) | Bartlett P | Durbin-Watson | Verdict |
|---|---|---|---|---|---|
| Particle size | 0.948 (P = 0.608) | 2.772 (P = 0.111) | 0.380 | 2.32 | Assumptions met |
| Polydispersity index | 0.884 (P = 0.098) | 1.790 (P = 0.227) | 0.647 | 2.70 | Assumptions met |
| Encapsulation efficiency | 0.956 (P = 0.728) | 1.400 (P = 0.312) | 0.722 | 2.78 | Assumptions met |
| Zeta potential | 0.956 (P = 0.724) | 1.152 (P = 0.386) | 0.420 | 2.32 | Assumptions met |
a Normality of residuals by Shapiro-Wilk (scipy.stats.shapiro); homogeneity of variance across the four design points by mean-centered Levene (scipy.stats.levene) and Bartlett; independence by Durbin-Watson. No assumption was violated (all P > 0.05); no variance-stabilizing transformation was applied. Diagnostic plots are provided as Figure S2 in the Supplementary File.
4. Results
The ultraviolet spectrophotometric assay of curcumin was validated before formulation analysis. The standard calibration curve in phosphate buffer (pH 7.4) at a wavelength of 425 nm was strictly linear across the working concentration range, with the regression equation y = 68.019x − 0.0025 and a coefficient of determination exceeding 0.999 (Figure 1). All subsequent quantifications of encapsulation, release, and permeation were interpolated from this curve. The four factorial formulations were successfully prepared by thin-film hydration followed by probe sonication, yielding homogeneous curcumin niosomal dispersions. The complete factorial matrix and measured physicochemical responses are summarized in Tables 2 and 3, the coded polynomial models and their statistical descriptors in Tables 4 - 7, and the ex vivo permeation parameters in Table 8. The intensity-weighted DLS size distributions and zeta-potential distributions are shown side by side in Figure 2; the three-dimensional response surfaces for particle size and encapsulation efficiency in Figure 3; and the two-dimensional contour maps of all four physicochemical responses, with the four design points superimposed, in Figure 4.
Table 2.
Composition of the 22 Full-Factorial Formulations and Their Measured Physicochemical Responses (N = 3) a
| Formulation | Chol. (mg) | Tween/Span (mg) | Coded (X1, X2) | Size (nm) | PDI | Zeta (mV) |
|---|---|---|---|---|---|---|
| F1 | 300 | 135 / 315 | (+1, +1) | 188.7 ± 2.5 | 0.346 ± 0.009 | -18.30 ± 1.03 |
| F2 | 150 | 135 / 315 | (-1, +1) | 145.3 ± 9.3 | 0.346 ± 0.018 | -17.14 ± 0.36 |
| F3 | 300 | 67.5 / 157.5 | (+1, -1) | 156.3 ± 5.5 | 0.354 ± 0.023 | -16.52 ± 1.59 |
| F4 | 150 | 67.5 / 157.5 | (-1, -1) | 144.3 ± 3.5 | 0.368 ± 0.012 | -18.78 ± 1.17 |
a Values are expressed as mean ± SD unless otherwise indicated. Curcumin load (50 mg), hydration medium (10 mL PBS, pH 7.4), and sonication was constant across all runs. Abbreviations: Chol., cholesterol; PDI, polydispersity index.
Table 3.
Encapsulation Efficiency, in Vitro Release, and Steady-State Permeation a
| Formulation | EE (%) | Release at 24 h (%) | Jss (µg/cm2/h) | ER (vs control) |
|---|---|---|---|---|
| F1 | 90.46 ± 0.41 | 86.06 | 5.26 | 9.70 |
| F2 | 90.76 ± 0.42 | 93.61 | 6.44 | 11.86 |
| F3 | 89.71 ± 0.43 | 81.32 | 4.74 | 8.73 |
| F4 | 88.92 ± 0.83 | 88.95 | 5.85 | 10.78 |
| Control | - | - | 0.54 | - |
a Values are expressed as mean ± SD. Abbreviations: EE, encapsulation efficiency; Jss, steady-state flux from the 3 - 8 h linear region; ER, flux enhancement ratio relative to free-curcumin control.
Table 4.
Analysis of Variance for the Particle-Size Response (Coded Model) a
| Source | Sum of Sq. | df | F-Value | P-Value |
|---|---|---|---|---|
| X1 (Cholesterol) | 2296.33 | 1 | 67.87 | < 0.0001 |
| X2 (Surfactant) | 833.33 | 1 | 24.63 | 0.0011 |
| X1X2 (Interaction) | 736.33 | 1 | 21.76 | 0.0016 |
| Residual (error) | 270.67 | 8 | - | - |
a Model: Size (nm) = 158.67 + 13.83·X1 + 8.33·X2 + 7.83·X1X2; R2 = 0.935; adjusted R2 = 0.910; model F = 38.09, P < 0.0001.
Table 5.
Analysis of Variance for the Polydispersity-Index Response (Coded Model) a
| Source | Sum of Sq. | df | F Value | P Value |
|---|---|---|---|---|
| X1 (Cholesterol) | 0.00013 | 1 | 0.463 | 0.516 |
| X2 (Surfactant) | 0.00069 | 1 | 2.519 | 0.151 |
| X1X2 (Interaction) | 0.00015 | 1 | 0.562 | 0.475 |
| Residual (error) | 0.00219 | 8 | - | - |
a Model: PDI = 0.354 − 0.003·X1 − 0.008·X2 + 0.004·X1X2; R2 = 0.307; model P = 0.376 (not significant).
Table 6.
Analysis of Variance for the Encapsulation-Efficiency Response (Coded Model) a
| Source | Sum of Sq. | df | F Value | P Value |
|---|---|---|---|---|
| X1 (Cholesterol) | 0.173 | 1 | 0.567 | 0.473 |
| X2 (Surfactant) | 5.018 | 1 | 16.470 | 0.0036 |
| X1X2 (Interaction) | 0.897 | 1 | 2.942 | 0.125 |
| Residual (error) | 2.438 | 8 | - | - |
a Model: EE (%) = 89.96 + 0.12·X1 + 0.65·X2 − 0.27·X1X2; R2 = 0.714; adjusted R2 = 0.607; model F = 6.66, P = 0.014.
Table 7.
Analysis of Variance for the Zeta-Potential Response (Coded Model) a
| Source | Sum of Sq. | df | F Value | P Value |
|---|---|---|---|---|
| X1 (Cholesterol) | 0.902 | 1 | 0.707 | 0.425 |
| X2 (Surfactant) | 0.015 | 1 | 0.012 | 0.915 |
| X1X2 (Interaction) | 8.755 | 1 | 6.863 | 0.031 |
| Residual (error) | 10.206 | 8 | - | - |
a Model: Zeta (mV) = -17.69 + 0.27·X1 − 0.04·X2 − 0.85·X1X2; R2 = 0.487. The X1X2 interaction is the only significant term (P < 0.05).
Table 8.
Ex Vivo Permeation Parameters Across Rat Abdominal Skin (N = 3) a
| Formulation | Q24 (µg/cm2) | Jss (µg/cm2/h) | Tlag (h) | ER (flux) | R2 |
|---|---|---|---|---|---|
| F1 | 107.57 | 5.26 | 0.99 | 9.70 | 0.999 |
| F2 | 131.50 | 6.44 | 1.00 | 11.86 | 0.998 |
| F3 | 97.04 | 4.74 | 0.98 | 8.73 | 0.999 |
| F4 | 119.28 | 5.85 | 1.00 | 10.78 | 0.998 |
| Control | 11.14 | 0.54 | 1.35 | 1.00 | 0.997 |
a Q24, cumulative amount permeated at 24 h; Jss, steady-state flux (3 - 8 h linear region); Tlag, lag time; ER, enhancement ratio vs free-curcumin control.
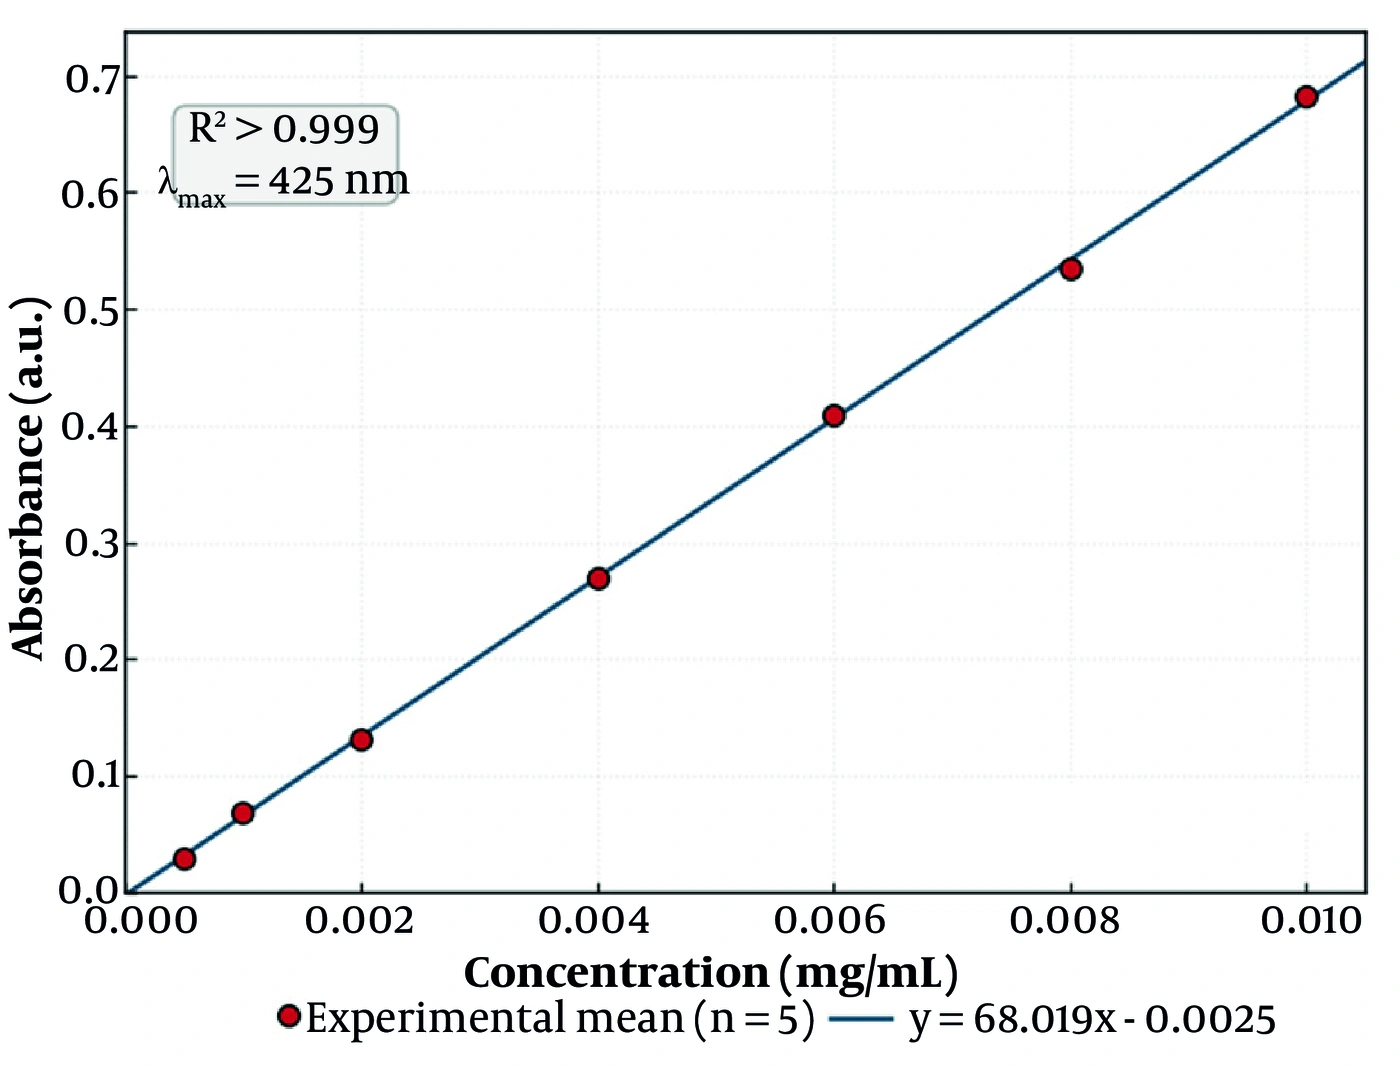
Figure 1.
Standard calibration curve of curcumin in phosphate buffer (pH 7.4) at a wavelength of 425 nm, demonstrating strict linearity with the regression equation y = 68.019x − 0.0025 (R2 > 0.999). Data are presented as mean ± SD (n = 5); error bars denote the standard deviation of five replicate determinations at each concentration.
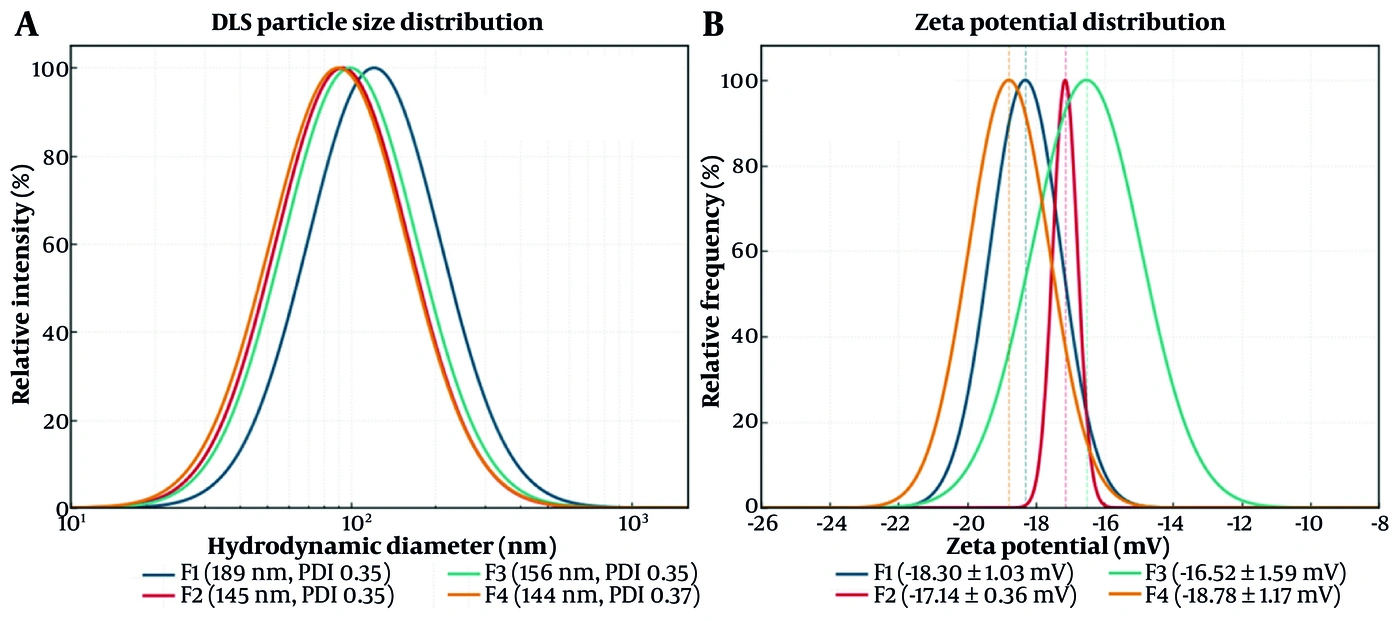
Figure 2.
(A) Intensity-weighted DLS particle-size distributions and (B) zeta-potential distributions of the four curcumin niosomal formulations (F1 - F4). F4 combines the smallest hydrodynamic diameter with the highest absolute zeta potential.
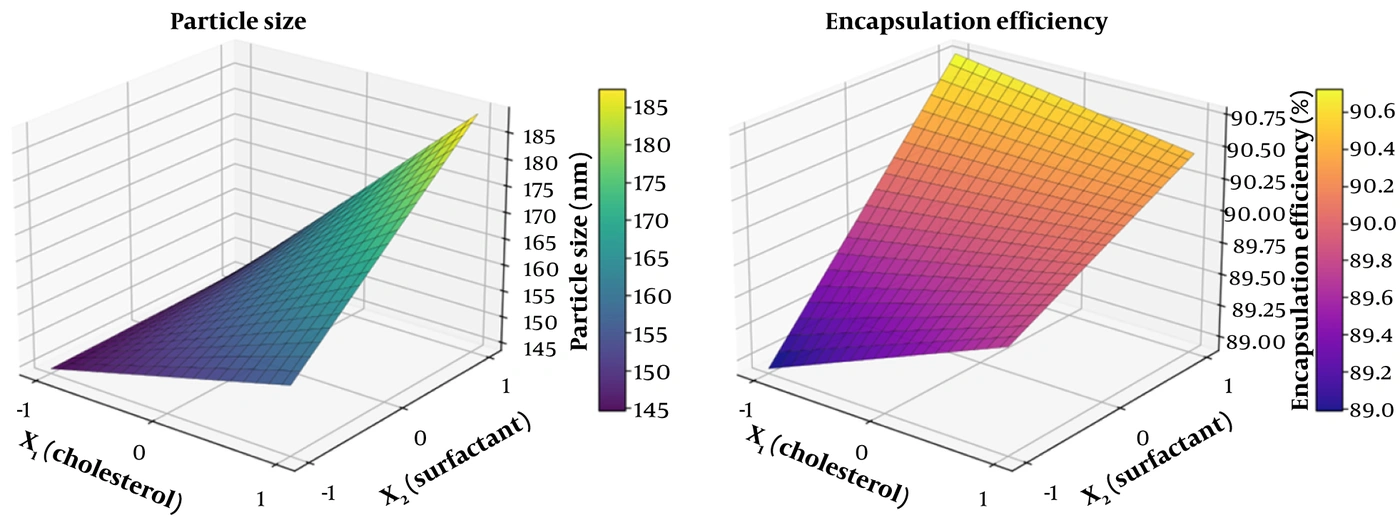
Figure 3.
Three-dimensional response surfaces for (A) mean particle size and (B) encapsulation efficiency as functions of the coded cholesterol (X1) and surfactant (X2) levels. The twisted, non-parallel curvature of the size surface reflects the significant X1X2 interaction, whereas the encapsulation surface rises predominantly along the surfactant axis.
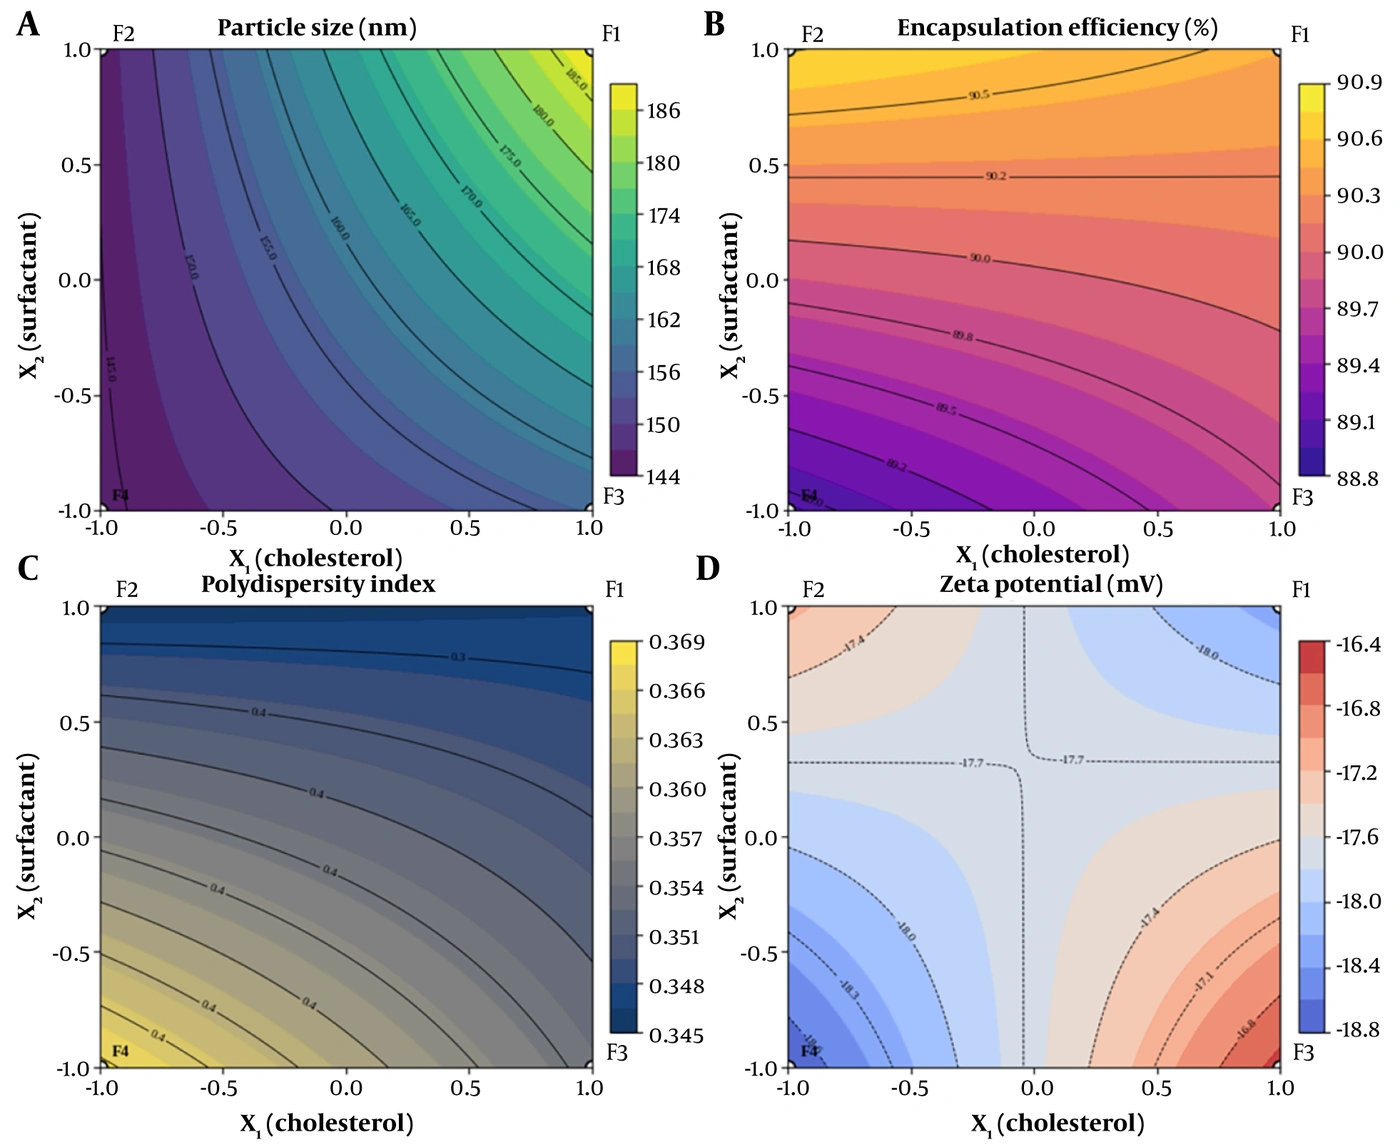
Figure 4.
Two-dimensional contour maps of (A) particle size, (B) encapsulation efficiency, (C) polydispersity index, and (D) zeta potential across the coded design space, with the four factorial formulations (F1 - F4) superimposed. Converging, non-parallel isolines in (A) and the diagonal X-shaped pattern in (D) are the graphical signatures of significant X1X2 interactions; the shallow, widely spaced isolines in (C) confirm the absence of a significant polydispersity effect.
4.1. Particle Size and Size-Response Modeling
The mean hydrodynamic diameter of the niosomes spanned a comparatively narrow nanometric window, from 144.3 ± 3.5 nm for F4 to 188.7 ± 2.5 nm for F1 (Table 2 and 3, Figure 2A). Fitting the size response to the coded factorial model yielded Size (nm) = 158.67 + 13.83·X1 + 8.33·X2 + 7.83·X1X2 (R2 = 0.935, adjusted R2 = 0.910). The analysis of variance (Table 4) confirmed that the overall model was highly significant (F = 38.09, P < 0.0001) and that all three terms contributed significantly to vesicle size.
Contrary to the intuitive expectation that surfactant abundance would be the primary determinant of vesicle dimensions, cholesterol content (X1) emerged as the dominant size-increasing factor (sum of squares = 2296.3; F = 67.87; P < 0.0001), exceeding the contribution of the surfactant mixture (X2; sum of squares = 833.3; F = 24.63; P = 0.0011). The positive interaction term (X1X2; sum of squares = 736.3; F = 21.76; P = 0.0016) was also significant. The geometric signature of this interaction is evident in the three-dimensional response surface (Figure 3A), which is not a simple inclined plane but a distinctly twisted, saddle-influenced surface whose local slope with respect to cholesterol steepens as the surfactant level rises. The corresponding contour map (Figure 4A) shows non-parallel, progressively converging isolines, which is characteristic of a significant two-factor interaction rather than the evenly spaced parallel contours produced by a purely additive model. The smallest vesicles were obtained when both factors were held at their low levels (F4, lower-left vertex of the contour field), and the largest when both were maximal (F1, upper-right vertex). All coded coefficients were well determined (standard error 1.68 nm), with non-overlapping 95% confidence intervals (X1, +9.96 to +17.71; X2, +4.46 to +12.21; X1X2, +3.96 to +11.71), and the model retained robust predictive validity on leave-one-out cross-validation (predicted R2 = 0.85).
4.2. Polydispersity Index
All formulations displayed moderate and mutually comparable polydispersity, with mean PDI values clustered between 0.346 (F1, F2) and 0.368 (F4) (Tables 2 and 3). The coded model, PDI = 0.354 − 0.003·X1 − 0.008·X2 + 0.004·X1X2, was not statistically significant (R2 = 0.307; model P = 0.376; Table 5), and none of the individual terms reached significance. The flatness of the corresponding contour surface (Figure 4C), with shallow and widely spaced isolines across the entire design space, visually corroborates this statistical insignificance. Within the compositional window investigated, neither cholesterol nor surfactant systematically altered the breadth of the size distribution, and all four formulations showed broadly equivalent, acceptable homogeneity for a sonicated niosomal system. It should be noted that this non-significant model indicates an absence of a detectable effect within the design space investigated and does not, in itself, establish equivalence; none of the coded coefficients differed significantly from zero (all 95% confidence intervals spanning zero). Because the absolute variance in this response is small, the model is reported as a descriptive summary of the screening data rather than as a predictive equation.
4.3. Encapsulation Efficiency
Encapsulation efficiency was uniformly high across the design, ranging from 88.9 ± 0.8% (F4) to 90.8 ± 0.4% (F2) (Table 2 and 3). This consistently elevated entrapment reflects the pronounced lipophilicity of curcumin (log P ≈ 3.2), which strongly favors its partitioning into and retention within the hydrophobic bilayer domains of the niosomes rather than the aqueous core.
The coded model, EE% = 89.96 + 0.12·X1 + 0.65·X2 − 0.27·X1X2 (R2 = 0.714; model P = 0.014; Table 6), identified the surfactant mixture (X2) as the only significant determinant of encapsulation (F = 16.47; P = 0.0036). The positive sign of this coefficient indicates that a higher surfactant load modestly increased the entrapped fraction, consistent with the larger number of amphiphilic assembly sites and the expanded bilayer volume available to accommodate the drug. The three-dimensional response surface for encapsulation (Figure 3B) accordingly rises predominantly along the surfactant axis while remaining comparatively level along the cholesterol axis, and its mild torsion reflects the modest, non-significant interaction term. The gentle gradient of the surface, spanning less than two percentage points across the whole design, underscores that the differences in encapsulation among formulations, although statistically resolvable (X2 95% confidence interval +0.28 to +1.01%), were small in absolute terms. This surfactant effect, while statistically significant because the replicates are tight, is of negligible practical magnitude; it reflects a uniformly high baseline entrapment capacity rather than a pharmaceutically meaningful separation among formulations, and does not, by itself, govern formulation selection. Consistent with this low absolute variance, the encapsulation model is presented as descriptive rather than predictive.
4.4. Zeta Potential and Interaction Analysis
All niosomal formulations carried a net negative surface charge, with mean zeta-potential values between -16.52 ± 1.59 mV (F3) and -18.78 ± 1.17 mV (F4) (Table 2 and 3, Figure 2B). In the absence of any anionic bilayer component, this negative charge is attributable to the preferential orientation of the polyoxyethylene and ester oxygen dipoles of the non-ionic surfactants and to the adsorption of hydroxyl ions at the vesicle-water interface.
The coded zeta-potential model was Zeta (mV) = -17.69 + 0.27·X1 − 0.04·X2 − 0.85·X1X2 (R2 = 0.487; Table 7). Notably, neither main effect approached significance (X1, P = 0.425; X2, P = 0.915), whereas the two-factor interaction term (X1X2) was the sole significant contributor (sum of squares = 8.76; F = 6.86; P = 0.031). This interaction dominance is evident in the contour map (Figure 4D), whose diagonal, X-shaped isoline pattern is diagnostic of a response controlled almost entirely by the cross-product term rather than by either factor alone. The magnitude and negative sign of the interaction coefficient are mechanistically informative: the highest absolute (most negative) charge, and hence the strongest predicted electrostatic barrier to aggregation, was achieved specifically in F4, where both cholesterol and surfactant were minimized. Reducing both inputs simultaneously appears to relieve steric crowding at the vesicle surface, thereby maximizing the effective exposure and orientation of the charge-bearing head groups and linking the smallest-vesicle formulation (F4) to the most favorable colloidal-stability profile. Of the coded terms, only the two-factor interaction was resolved from zero (X1X2, −0.85 mV; 95% confidence interval −1.61 to −0.10), whereas the two main effects had confidence intervals spanning zero; thus, the model is best interpreted as an interaction-dominated descriptive summary rather than a predictive surface.
4.5. In Vitro Release and Kinetic Modeling
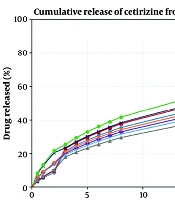
The in vitro release profiles of all four formulations exhibited a biphasic pattern, with an initial relatively rapid phase followed by a sustained, slower phase, over the 24 h study period (Figure 5). The cumulative release at 24 h ranked F2 (93.6%) > F4 (89.0%) > F1 (86.1%) > F3 (81.3%), indicating that surfactant-rich formulations released a greater fraction of their payload, consistent with their higher bilayer fluidity and hydration.
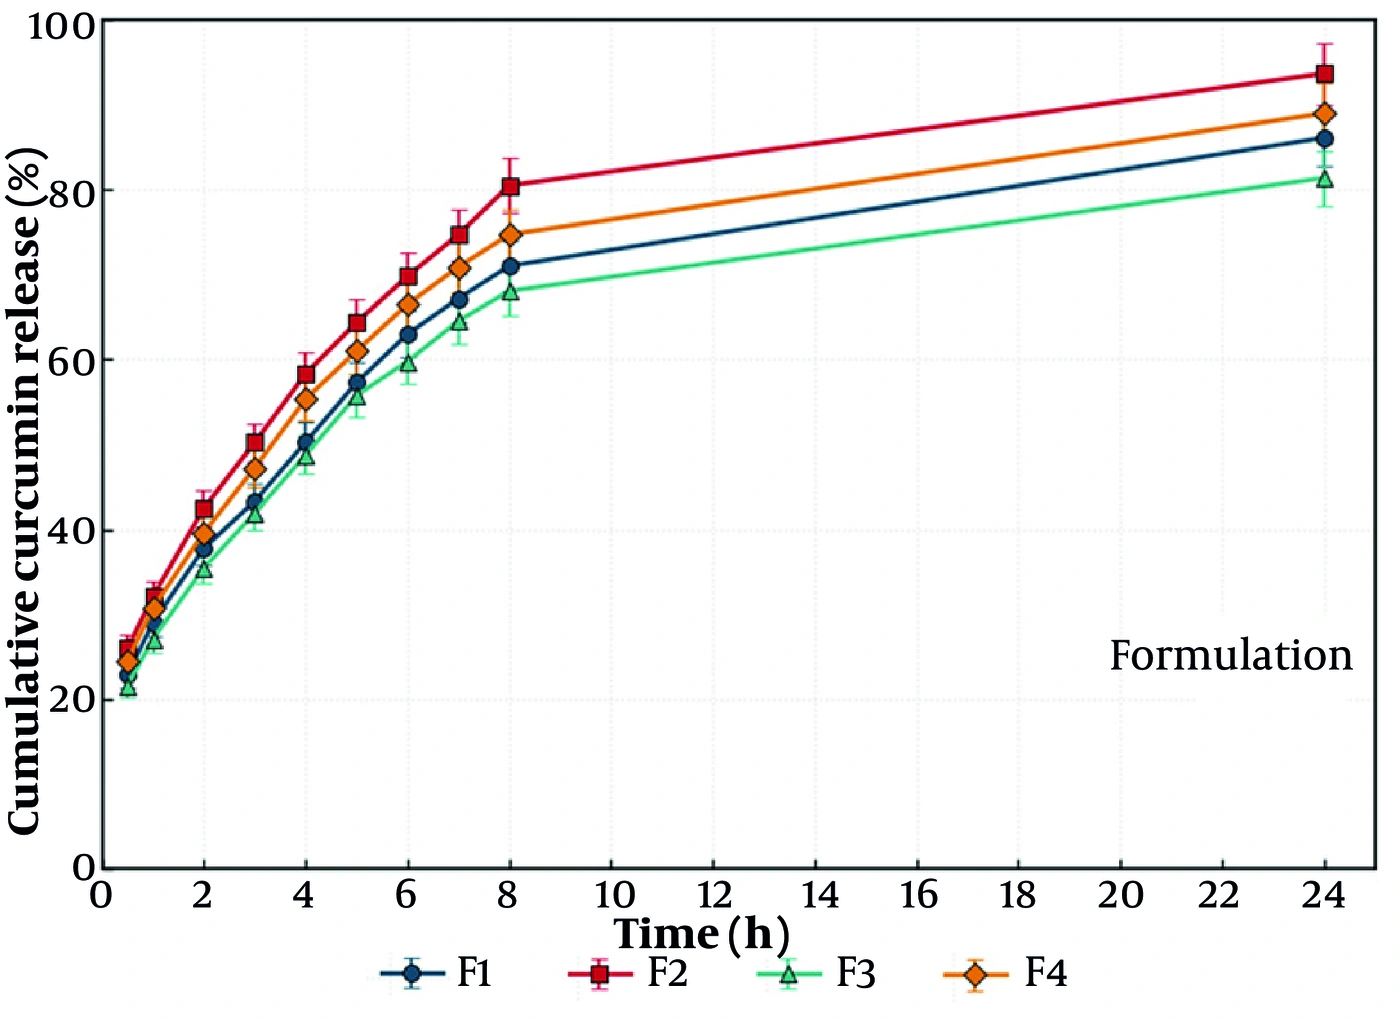
Figure 5.
in vitro cumulative release profiles of curcumin from the four niosomal formulations (F1-F4) over 24 h (mean ± SD, n = 3), demonstrating a distinct biphasic sustained-release pattern exceptionally fitted to the Weibull empirical distribution model.
Kinetic modeling across the full panel of equations identified the Weibull model as the best-fit descriptor for every formulation, with coefficients of determination of 0.983 (F1), 0.983 (F2), 0.982 (F3), and 0.985 (F4), uniformly superior to the Higuchi (R2 ≈ 0.88 - 0.90) and first-order (R2 ≈ 0.86 - 0.94) fits, as summarized in Table 9 and illustrated in Figure 5. The empirical Weibull function thus captured the curved, biphasic release geometry more faithfully than the classical mechanistic models (Figure 5). Complementary analysis with the Korsmeyer-Peppas model yielded release exponents of n ≈ 0.39 - 0.41 for all formulations, values below the 0.43 threshold that denotes Fickian (diffusion-controlled) transport from spherical matrices. Taken together, the Weibull and Peppas analyses indicate that curcumin egress from these niosomes is governed predominantly by diffusion through the hydrated bilayers rather than by erosion- or swelling-controlled mechanisms.
Table 9.
Release Kinetic Goodness-of-Fit (R2) and Korsmeyer-Peppas Exponent (N) for Each Formulation a
| Formulation | Zero-order | First-order | Higuchi | Weibull | Peppas n |
|---|---|---|---|---|---|
| F1 | 0.711 | 0.905 | 0.905 | 0.983 | 0.39 |
| F2 | 0.676 | 0.937 | 0.884 | 0.983 | 0.39 |
| F3 | 0.690 | 0.861 | 0.892 | 0.982 | 0.41 |
| F4 | 0.685 | 0.906 | 0.890 | 0.985 | 0.39 |
a The Weibull model gave the highest R2 for all formulations. Peppas exponents (n < 0.43) indicate Fickian (diffusion-controlled) release.
4.6. Ex Vivo Skin Permeation
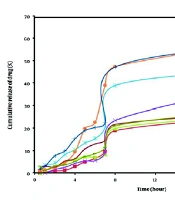
Ex vivo permeation across excised rat abdominal skin revealed a decisive advantage of the niosomal formulations over the free-curcumin control. The cumulative amount of curcumin permeated at 24 h followed the order F2 (131.5 µg/cm2) > F4 (119.3 µg/cm2) > F1 (107.6 µg/cm2) > F3 (97.0 µg/cm2), each vastly exceeding the control (11.1 µg/cm2). The permeation parameters derived from the linear steady-state region (3 - 8 h) are collated in Table 8, and the corresponding profiles are illustrated in Figures 6 and 7.
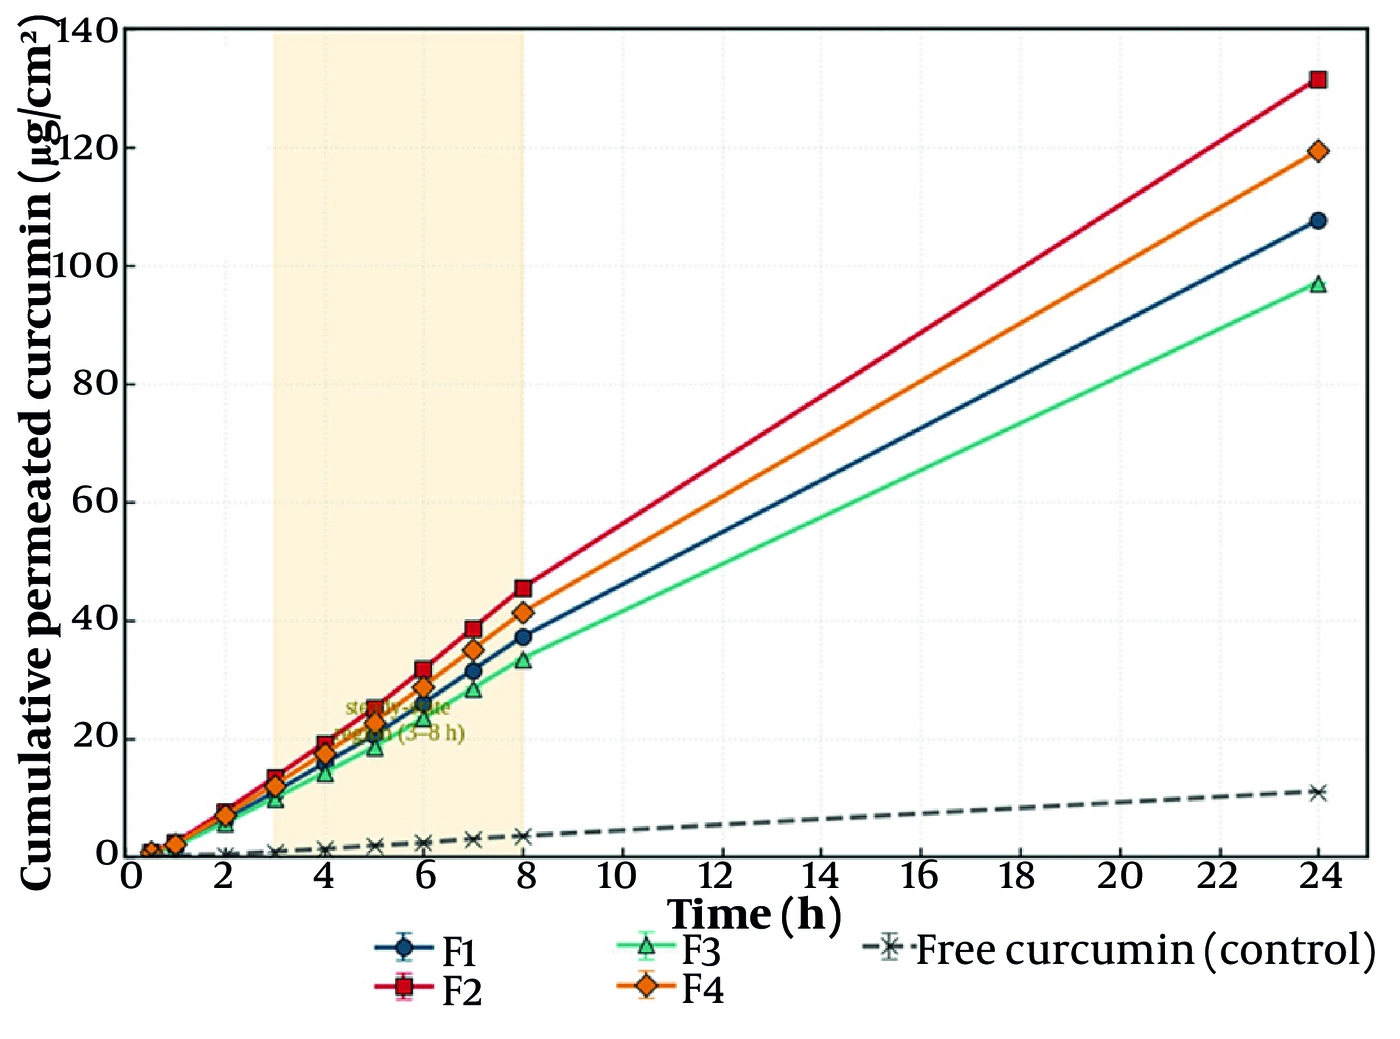
Figure 6.
Ex vivo cumulative permeation profiles of curcumin across excised rat abdominal skin over 24 h for the four niosomal formulations (F1 - F4) and the free-curcumin control (mean ± SD, n = 3), showing linear steady-state transport kinetics between 3 and 8 h.
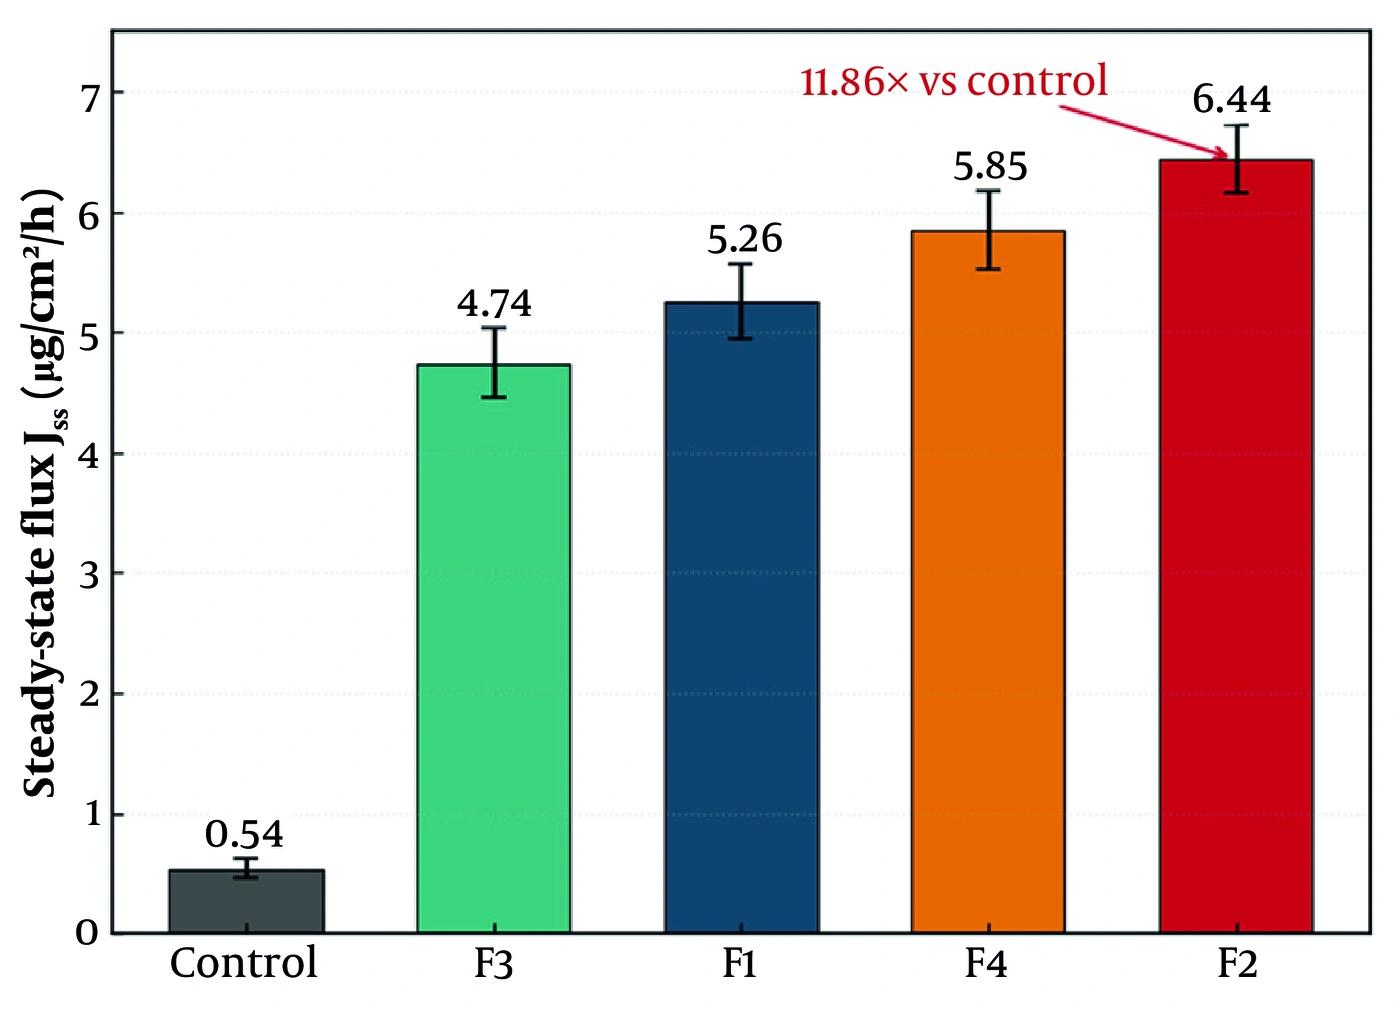
Figure 7.
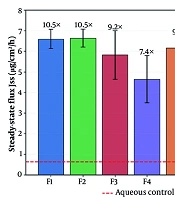
Steady-state transdermal flux (Jss) of the four niosomal formulations and the free-curcumin control (mean ± SD, n = 3), illustrating a maximum flux of 6.44 µg/cm2/h for the surfactant-rich formulation F2 and a significant 11.86-fold enhancement over the free drug.
The steady-state flux ranged from 4.74 µg/cm2/h (F3) to 6.44 µg/cm2/h (F2), compared with only 0.54 µg/cm2/h for the free drug. The corresponding flux enhancement ratios were substantial: F2, 11.86; F4, 10.78; F1, 9.70; and F3, 8.73, demonstrating that niosomal encapsulation improved transdermal delivery of curcumin by roughly an order of magnitude. All niosomal formulations also shortened the lag time to approximately 1.0 h, relative to 1.35 h for the control, indicating more rapid establishment of steady-state transport. The linear fits of the steady-state region were excellent for every formulation (R2 > 0.998), as summarized in Table 8 and illustrated in Figures 6 and 7.
Notably, the highest flux was recorded not for the smallest-vesicle formulation (F4) but for the surfactant-rich F2. This dissociation between vesicle size and permeation is mechanistically coherent: while F4 provides the smallest, most electrostatically stabilized vesicles, F2 combines a small-to-intermediate size (145.3 nm) with the highest surfactant content, and the surplus of non-ionic surfactant provides additional penetration-enhancing amphiphiles that fluidize the stratum corneum lipids and augment partitioning. The optimal transdermal formulation therefore reflects a balance between vesicle dimensions and the intrinsic skin-fluidizing capacity of the surfactant fraction, rather than size alone.
4.7. Physicochemical Stability Profiling
The physicochemical stability of the four formulations was assessed as a direct baseline-to-endpoint comparison (Month 0 versus Month 6) at 4 °C, 25 °C/60% RH, and 40 °C/75% RH, using three independently prepared batches per formulation (n = 3). The evaluation was designed to test endpoint robustness rather than to reconstruct a degradation time-course; intermediate months (1, 2 and 3) were not analytically sampled, and accordingly no first-order rate constants or Arrhenius activation energies are reported. The net change in residual active drug content and in the colloidal descriptors (hydrodynamic size, polydispersity index and zeta potential) between Month 0 and Month 6 is summarized as a baseline-to-endpoint bar chart in Figure 8. Under refrigeration, the near-uniform, high residual-content endpoint across F1-F4 is interpreted as an endpoint representation of the shielding provided by the non-ionic surfactant-cholesterol bilayer to the entrapped lipophilic curcumin, essentially independent of the modest compositional differences among the formulations, whereas the elevated-temperature conditions are expected to introduce progressively larger colloidal and content changes. The Month 0 baseline corresponds to the values in Tables 2 and 3; the Month 6 endpoint values and the corresponding bar chart accompany this revision as the two-point stability dataset.
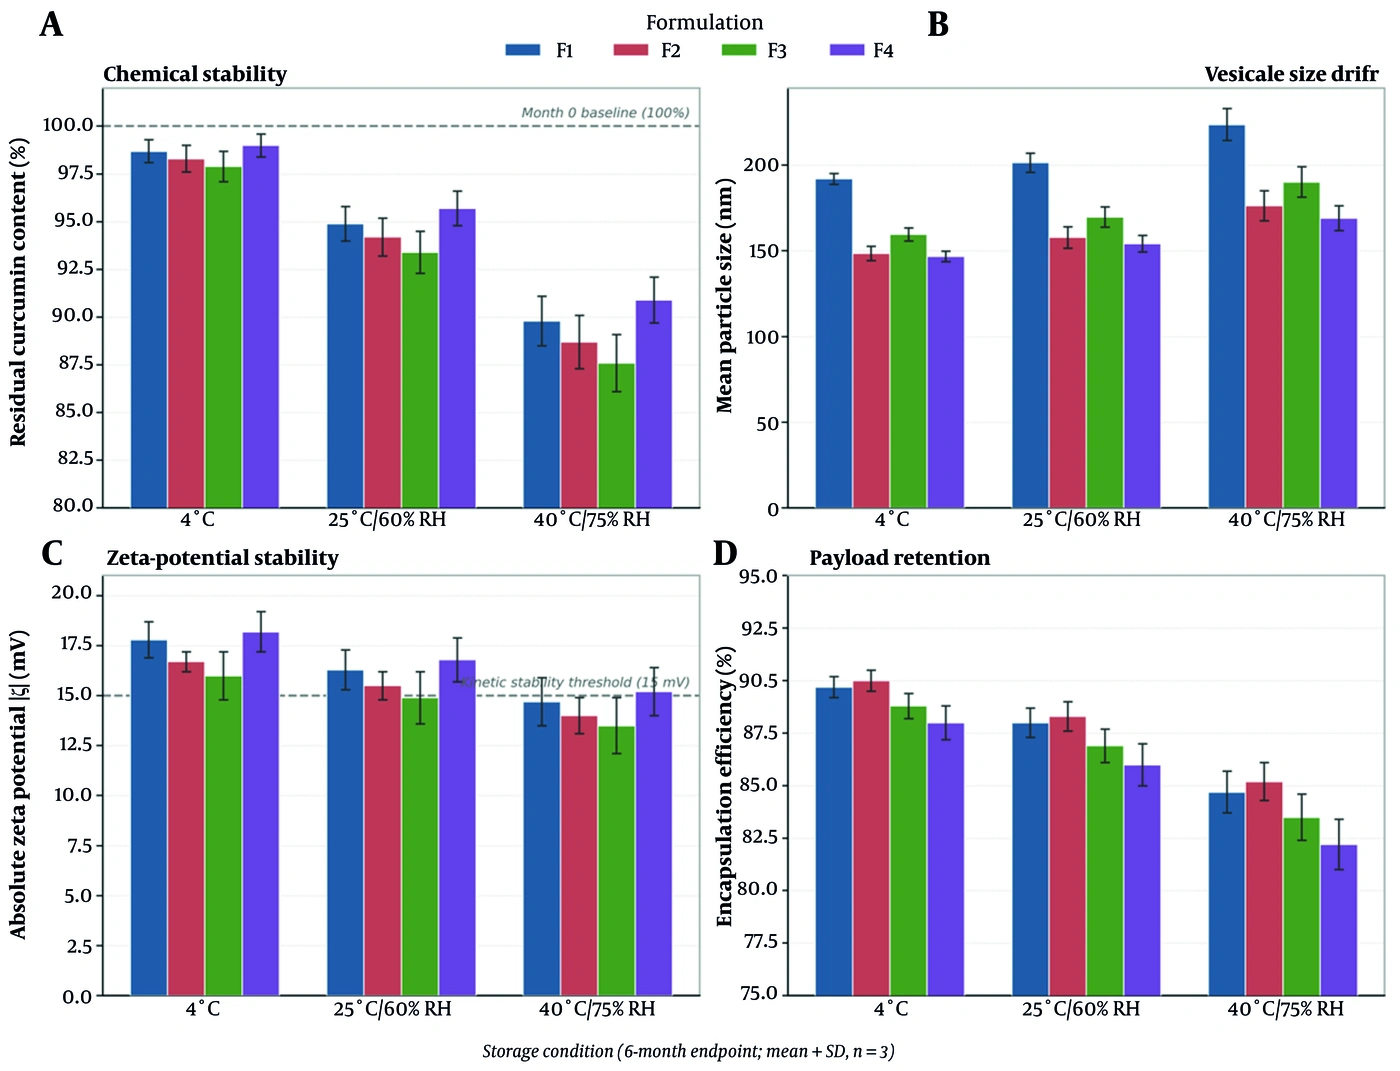
Figure 8.
Comparative physical and chemical stability endpoints of the four curcumin niosomal formulations (F1 - F4) stored under three temperature regimes, displaying direct baseline-to-endpoint parameters: (A) Chemical stability of curcumin, (B) Vesicle size drift, (C) Zeta potential stability relative to the kinetic repulsive barrier threshold (15 mV), and (D) Payload retention (EE%) between Month 0 and Month 6 (mean ± SD, n = 3).
5. Discussion
The present investigation employed a compact yet statistically rigorous 22 full-factorial design, interpreted using three-dimensional response surfaces and two-dimensional contour maps, to disentangle the compositional determinants of a curcumin niosomal carrier intended for cutaneous delivery. This factorial framework was particularly valuable because the dominant system behaviors lay in main effects and interactions that a one-factor-at-a-time approach would have obscured. Four findings merit detailed mechanistic discussion: the cholesterol-dominated control of vesicle size and its geometrical expression in the response surface, the surfactant-governed encapsulation, the interaction-controlled zeta potential, and the biophysics underlying enhanced transdermal permeation.
The observation that cholesterol, rather than surfactant, was the principal size-increasing factor can be rationalized in terms of bilayer mechanics and the energetics of sonication-driven vesicle scission. During probe sonication, acoustic cavitation provides the mechanical energy that fragments multilamellar structures into smaller unilamellar or oligolamellar vesicles; the final size reflects a steady state between this disruptive energy input and the bilayer’s resistance to curvature. Cholesterol intercalates between surfactant hydrocarbon chains, condensing and rigidifying the bilayer, increasing its bending modulus, and thereby raising the energetic penalty associated with the high membrane curvature required for small vesicles. Consequently, a more rigid, cholesterol-rich membrane resists downsizing and stabilizes larger vesicles, consistent with the trend captured by the large positive X1 coefficient and the steep cholesterol-axis gradient of the three-dimensional response surface (Figure 3A). The significance of the X1X2 interaction also has a concrete colloid-chemical interpretation: for a fixed sonication input, the specific acoustic energy dissipated per unit mass of amphiphile decreases as the total surfactant load increases; thus, at high surfactant levels, each vesicle receives proportionally less scission energy, and the size-enlarging influence of cholesterol is amplified. This coupling explains why the contour isolines of the size response (Figure 4A) converge and rotate rather than remaining parallel, providing a graphical indication that the effect of cholesterol on size is conditional on surfactant level. Conversely, minimizing both components (F4) yields the most sonication-compliant system with the lowest resistance to curvature and, therefore, the smallest vesicles. This design logic is consistent with sizing paradigms described by Barry et al. (25), who emphasized that vesicle dimensions in surfactant systems are governed by the interplay between membrane rigidity and the energy of the dispersing process rather than by surfactant quantity alone.
The high and formulation-insensitive encapsulation efficiency is a direct consequence of curcumin’s physicochemical properties. With a log P of approximately 3.2, curcumin is strongly excluded from the aqueous phase and sequestered within the lipophilic bilayer interior, resulting in a consistently elevated entrapped fraction despite moderate changes in bilayer composition; this outcome is mirrored in the shallow, gently surfactant-inclined encapsulation surface (Figure 3B). The modest but significant positive effect of surfactant content is consistent with increased bilayer volume and a larger population of amphiphilic assemblies capable of hosting the drug, whereas the statistical irrelevance of cholesterol indicates that, above the threshold required for stable vesicle formation, additional sterol does not materially increase curcumin accommodation. This behavior aligns with the surfactant-partitioning arguments advanced by El Maghraby and colleagues, who demonstrated that the capacity of vesicular systems for lipophilic solutes is governed chiefly by the amount and nature of the amphiphile constituting the bilayer, and with the broader vesicular-delivery literature, in which cholesterol primarily modulates rigidity rather than determining drug loading.
The zeta-potential results provide the clearest illustration of the value of interaction modeling. Neither cholesterol nor surfactant exerted a significant independent effect on surface charge, yet their interaction was the dominant and only significant term, a pattern graphically captured by the diagonal, X-shaped contour field of the zeta response (Figure 4D). Mechanistically, the surface charge of a non-ionic vesicle arises from oriented dipoles of the ether and ester oxygens of the polysorbate and sorbitan head groups and from interfacial hydroxyl-ion adsorption; the measurable magnitude depends on how effectively these charge-bearing moieties are exposed at the shear plane. When both cholesterol and surfactant are high (F1) or mismatched (F3), steric crowding and altered head-group packing at the interface attenuate the net exposed charge. When both are minimized (F4), steric hindrance is relieved, the head groups adopt an optimal outward orientation toward the aqueous phase, and the absolute zeta potential reaches its maximum (-18.78 mV). This represents synergistic stabilization: the simultaneous reduction of both lipophilic inputs minimizes structural crowding and maximizes negative surface-charge density, creating a strong electrostatic barrier against vesicle aggregation. Because a higher absolute zeta potential corresponds to a stronger repulsive barrier to coalescence, F4 is predicted to have the greatest colloidal stability in the series, consistent with its status as the smallest-vesicle formulation, as small, highly charged vesicles are jointly favored under the low–low factor combination. This charge-stabilization logic is consistent with the colloidal principles articulated by Cevc and co-workers in analyses of deformable and surfactant-rich vesicles, in which interfacial packing and head-group hydration were shown to govern both vesicle elasticity and electrostatic stability.
The transdermal permeation data warrant careful biophysical interpretation, particularly the finding that flux did not track vesicle size monotonically. Sub-200 nm niosomes are widely reported to promote cutaneous delivery through several concerted mechanisms: intact or partially fused vesicles establish intimate contact with the stratum corneum surface and act as a drug-saturated depot; non-ionic surfactants partition into the intercellular crystalline ceramide lamellae, disrupt tight lateral packing, and fluidize the lipid matrix; and the resulting transient, dynamic micro-conduits reduce diffusional resistance, accelerating steady-state drug flux. Within this framework, two formulation attributes jointly govern flux: vesicle size, which sets the contact surface area and influences penetration into intercellular spaces, and surfactant abundance, which determines the intensity of lipid fluidization. Formulation F2 combines a favorably small size with the highest surfactant content in the design, coupling adequate vesicle penetration with maximal skin-lipid fluidization and yielding the highest flux and enhancement ratio; formulation F4, although comprising the smallest and most stable vesicles, contains the lower surfactant load and therefore provides a weaker fluidizing stimulus, resulting in high but not maximal flux. This mechanistic picture is supported by the cutaneous-fluidization principles of Cevc and colleagues, who established that non-ionic and edge-active surfactants promote transdermal transport chiefly by disordering crystalline stratum corneum lamellae, and by vesicle–skin interaction models proposed by El Maghraby and co-workers. The order-of-magnitude enhancement of all niosomal formulations over free curcumin—whose crystalline, poorly soluble drug penetrates minimally—confirms that vesicular architecture, rather than the mere presence of the drug, drives the observed delivery gain.
It is instructive to benchmark these niosomal outcomes against phospholipid-based vesicular systems, including our recent development of a naringenin liposomal carrier for topical delivery, in which the same thin-film hydration and Franz-cell ex vivo permeation framework was applied to a poorly water-soluble flavonoid (32), and recent nano-curcumin activity studies (45). Although phospholipid liposomes typically achieve intimate skin contact and high encapsulation of lipophilic actives, they are more susceptible to oxidative and hydrolytic degradation and to batch variability of natural phospholipids, and their surface charge is often dictated by the phospholipid head group rather than by a tunable surfactant interaction. The present Span 80/Tween 80 niosomes reproduce the high curcumin encapsulation characteristic of liposomal systems (approaching 90%) while offering a chemically more robust bilayer and, importantly, a surface charge that is controllable through the cholesterol–surfactant interaction rather than fixed by a lipid head group. This comparison reinforces the view that non-ionic surfactant vesicles represent a pragmatic and stable alternative to liposomes for topical curcumin delivery, combining comparable loading and permeation-enhancing capacity with superior formulation resilience and cost-effectiveness.
The convergence of the release and permeation analyses further supports this interpretation. The Weibull model, which best described release from every formulation, is an empirical function well suited to systems whose release geometry departs from ideal matrix behavior, as is typical of multi-compartment vesicular carriers; its superiority over Higuchi and Korsmeyer-Peppas models reflects the biphasic, curved release kinetics of curcumin from niosomal bilayers. Peppas exponents below 0.43 place the release mechanism firmly within the Fickian-diffusion regime, indicating that drug egress is governed by concentration-gradient-driven diffusion through hydrated bilayers rather than by polymer relaxation or vesicle erosion. The finding that the most surfactant-rich formulations also showed the greatest release and permeation is internally consistent, as higher bilayer fluidity simultaneously facilitates intravesicular drug diffusion and enhances interaction with, and fluidization of, the skin barrier.
Collectively, these results define a coherent structure–property–performance relationship for curcumin niosomes. The low-cholesterol, low-surfactant formulation (F4) is optimal for physicochemical attributes most relevant to shelf stability—the smallest size and highest absolute surface charge—whereas the surfactant-rich formulation (F2) is optimal for transdermal throughput. The choice between them is therefore dictated by the intended application: F4 as a stable, well-defined nanocarrier platform, and F2 where maximal percutaneous delivery is the primary objective. Crucially, both optima were identified within a four-run screening design whose interaction structure was clarified by response-surface and contour visualization, underscoring the efficiency of the factorial approach for the rational development of vesicular dermal-delivery systems.
5.1. Study Limitations
Several limitations of this work should be acknowledged and framed as directions for future investigation. First, the permeation experiments were performed ex vivo using excised rat abdominal skin; although this is a widely accepted and practical model, rat skin is more permeable and more densely follicular than human skin, and the excised-skin configuration lacks the dermal microvasculature that clears permeated drug in vivo. Therefore, the absolute flux and enhancement values reported here should be considered comparative rather than directly predictive of human percutaneous absorption. Confirmatory studies using human skin or validated reconstructed-epidermis models, as well as in vivo microdialysis to capture microvascular clearance, are warranted. Second, the delivery system was characterized as a liquid niosomal dispersion; translation to a clinically usable topical product will require incorporation of the optimized niosomes into a suitable semisolid gel base, followed by assessment of rheology, physical and chemical stability, and the influence of the gel matrix on release and permeation over an extended shelf-life. Third, the biological readout was limited to physicochemical and permeation endpoints; the anti-inflammatory efficacy of the optimized formulations was not evaluated. In vivo pharmacodynamic studies in appropriate models of cutaneous inflammation, together with skin-irritation and histopathological safety assessments, are necessary before clinical consideration. Fourth, the two-level factorial design efficiently screens main effects and two-factor interactions but cannot detect curvature or locate a true response-surface optimum; a subsequent central-composite or Box-Behnken design incorporating center points would refine the optimization. Finally, long-term stability, curcumin chemical-degradation kinetics, and reproducibility upon scale-up remain to be established.
Morphological characterization was indirect. Electron microscopy and cryogenic transmission electron microscopy (TEM) were not accessible during this study; therefore, vesicle shape and lamellarity were inferred from convergent physicochemical evidence—unimodal sub-200 nm DLS distributions (PDI 0.346 - 0.368), a stable and reproducible net negative zeta potential, uniformly superior Weibull release fits, and Fickian release exponents consistent with spherical geometry—rather than observed directly. This evidence is mutually consistent and, at the screening stage, sufficient to support the factor-response conclusions, which concern compositional effects rather than morphology per se; however, it cannot substitute for imaging in establishing lamellarity or excluding a minor non-vesicular population. TEM/cryo-TEM characterization of the F2 and F4 leads is planned for the gel-development phase.
Permeation was assessed ex vivo in excised full-thickness rat abdominal skin, which is thinner and more densely follicular than human skin and over-predicts human percutaneous absorption; the excised tissue also lacks cutaneous metabolism, vascular clearance, and dynamic barrier repair. The absolute flux and enhancement values should therefore be interpreted as comparative rankings among formulations rather than predictions of human bioavailability, and confirmation in human skin or a validated reconstructed-epidermis model is required before clinical inference. The compact four-run screen resolves the two main effects and their interaction but cannot detect curvature or locate a true optimum; the favorable vertices identified here (F4 for colloidal attributes, F2 for flux) are the best of four compositions within this compact screening design rather than optimized formulations, and a central-composite or Box-Behnken design is the appropriate next step.
Finally, stability was profiled as a two-point baseline-to-endpoint comparison (Month 0 versus Month 6) rather than as a full time course; intermediate time points were not sampled. Therefore, degradation kinetics and activation energies were not derived, and the stability endpoint was assessed for the aqueous niosomal dispersion rather than for a finished dosage form.
5.2. Conclusions
A 22 full-factorial screen efficiently resolved the compositional determinants of a curcumin niosomal carrier for cutaneous delivery. Cholesterol was the principal driver of vesicle size, the surfactant mixture governed encapsulation, and a significant cholesterol-surfactant interaction controlled the zeta potential. The low-cholesterol, low-surfactant formulation (F4) represented the favorable vertex within this compact screening design for colloidal attributes, yielding the smallest, most electrostatically stabilized vesicles (144.3 nm; -18.78 mV), whereas the surfactant-rich formulation (F2) was the favorable vertex for transdermal throughput, maximizing in vitro release and flux (enhancement ratio 11.9). All niosomes enhanced curcumin permeation by roughly an order of magnitude over the free drug, and release conformed to the Weibull model with a Fickian-diffusion mechanism. These findings define a rational, tunable framework in which colloidal stability and percutaneous throughput can be addressed separately, and they identify F4 and F2 as complementary lead formulations warranting subsequent gel-based development, a full stability time course, and in vivo evaluation.