
1. Background
Chronic inflammatory dermatoses, including psoriasis, atopic dermatitis and contact dermatitis, are sustained by dysregulated pro-inflammatory signalling and oxidative stress within the epidermis and dermis, and they impose a substantial and growing therapeutic burden (1, 2). Conventional topical corticosteroids and calcineurin inhibitors provide symptomatic relief but have well-documented liabilities with prolonged use, including cutaneous atrophy, tachyphylaxis and systemic absorption (3, 4). There is therefore a clear rationale for the topical delivery of naturally derived anti-inflammatory agents with favourable safety profiles.
Curcumin (diferuloylmethane; C21H20O6; MW 368.38 Da; log P ≈ 3.29), the principal bioactive polyphenol of Curcuma longa, is a pharmacologically compelling candidate for inflammatory skin disease. Its anti-inflammatory activity is mediated through suppression of the NF-κB pathway, downregulation of COX-2 and iNOS, and inhibition of the pro-inflammatory cytokines TNF-α, IL-1β and IL-6 (5, 6). Curcumin also exhibits potent antioxidant activity through reactive-oxygen-species scavenging and activation of the Nrf2/HO-1 axis, and it modulates keratinocyte hyperproliferation, which is directly relevant to psoriasis (7, 8). Its clinical translation, however, is severely restricted by negligible aqueous solubility (< 0.1 mg·mL-1), rapid photochemical and hydrolytic degradation, and poor penetration across the stratum corneum (9, 10).
The stratum corneum, a densely packed, multilamellar array of corneocytes embedded in a highly ordered intercellular lipid matrix of ceramides, cholesterol and free fatty acids, constitutes the rate-limiting barrier to percutaneous absorption and is especially restrictive for lipophilic, high-melting compounds such as curcumin (11, 12). Overcoming this barrier while maintaining a sustained cutaneous drug reservoir is the central formulation challenge for topical curcumin.
Liposomal nanocarriers, phospholipid vesicles whose bilayer architecture is structurally homologous to biological and intercellular skin lipids, offer an attractive platform to simultaneously address curcumin’s solubility limitation and the stratum-corneum barrier (13, 14). Vesicle–skin interactions encompass adsorption to and hydration of the corneocyte envelope, lipid exchange and fusion with intercellular lamellae, and penetration-enhancing fluidization of barrier lipids, which collectively augment cutaneous drug flux beyond that achievable with simple solutions or suspensions (15, 16). Cholesterol and lecithin (phosphatidylcholine) are the two principal determinants of bilayer behaviour: cholesterol modulates membrane rigidity and permeability, whereas the phospholipid fraction governs vesicle size, lamellarity and encapsulation capacity (17, 18). Their combined and interacting effects on the critical quality attributes of curcumin liposomes, however, remain incompletely quantified.
Recent work has advanced curcumin-loaded liposomes for cutaneous application, including formulations developed for wound healing (30) and a range of lipid-based nanosystems designed to overcome the skin barrier (31, 32, 35). A critical distinction must, however, be drawn between phospholipid liposomes and the non-ionic surfactant-based vesicles (niosomes) frequently proposed for the same indication (29). Niosomes are assembled from synthetic non-ionic amphiphiles, typically sorbitan or polysorbate esters, together with cholesterol. The phosphatidylcholine bilayer employed here differs in three consequential respects: it is structurally homologous to endogenous membrane phospholipids and compositionally related to the intercellular lipids of the stratum corneum, a homology that enables lipid exchange and fusion with the barrier lamellae; it is associated with a favourable tolerability profile on inflamed, compromised skin, because non-ionic surfactants can themselves be irritant to precisely the barrier targeted here; and it is stabilized principally by headgroup hydration rather than by surfactant packing. For a chronically inflamed skin barrier, this represents a deliberate therapeutic rationale rather than an arbitrary substitution of an excipient. Despite this progress, the combined and interacting contributions of the two principal bilayer constituents, cholesterol and lecithin, to the critical quality attributes of curcumin liposomes, and the propagation of those attributes into transdermal flux, have not been resolved within a single orthogonal statistical framework. The present study addresses this gap.
2. Objectives
The present investigation is conceptually and experimentally independent of our previous work on ozonated-oil–curcumin co-loaded liposomes for retinopathy (19). It focuses exclusively on phospholipid liposomes loaded solely with curcumin and composed only of standard pharmaceutical excipients, to isolate and quantify the fundamental transdermal permeation behaviour of the system across rat skin. A two-level full factorial design (22) was employed to screen four formulations and to provide a rigorous statistical basis for interpreting structure–permeation relationships for the two lipid variables (20).
3. Methods
3.1. Materials
Curcumin, soybean lecithin (phosphatidylcholine), cholesterol, chloroform, methanol, and potassium dihydrogen phosphate were purchased from Merck KGaA (Darmstadt, Germany) and were of analytical or pharmaceutical grade. Phosphate buffer (pH 7.4) was prepared in-house from potassium dihydrogen phosphate, with pH adjustment using sodium hydroxide. Ultrapure water was used throughout.
3.2. Factorial Experimental Design
A two-level full factorial design (22) was applied to two independent formulation variables, each at two levels: X1, cholesterol content [10 mg (−1) vs. 20 mg (+1)]; and X2, lecithin content [30 mg (−1) vs. 60 mg (+1)]. Curcumin (50 mg per batch) and the hydration medium (10 mL phosphate buffer, pH 7.4) were held constant, as was the probe-sonication protocol. The four experimental runs were F1 (X1 = +1, X2 = +1; cholesterol 20 mg, lecithin 60 mg), F2 (X1 = −1, X2 = +1; cholesterol 10 mg, lecithin 60 mg), F3 (X1 = +1, X2 = −1; cholesterol 20 mg, lecithin 30 mg), and F4 (X1 = −1, X2 = −1; cholesterol 10 mg, lecithin 30 mg). For each response, a coded regression model of the form Y = b0 + b1X1 + b2X2 + b12X1X2 was fitted by ordinary least squares, and the significance of each coefficient was assessed by analysis of variance (P < 0.05).
The two-level full factorial design was deliberately selected as an appropriate first stage in a sequential quality-by-design workflow. For two factors, it is a mathematically complete and orthogonal design: four runs performed in triplicate (12 observations; 8 residual degrees of freedom) permit unconfounded estimation of both main effects and their interaction, with the orthogonality of the coded design matrix rendering the coefficient estimates mutually independent. Its purpose is to identify and rank influential factors before committing resources to locating an optimum, for which an augmented response-surface design would subsequently be required. All variables not under study—probe-sonication time and amplitude, hydration volume, drug loading, temperature, and solvent ratio—were held rigorously constant. This is a formal requirement of the design rather than a simplification: had these covaried, their effects would have been confounded with the lipid effects, and the coded coefficients would no longer have been attributable solely to cholesterol and lecithin. Fixing the sonication energy also permits the interpretation of vesicle size in terms of acoustic energy dissipated per unit lipid mass, as developed in the Discussion (Table 1).
Table 1.
Two-Level Full Factorial (22) Design Matrix and Constant Parameters a
| Run | X1 (coded) | X2 (coded) | Cholesterol (mg) | Lecithin (mg) | Curcumin (mg) |
|---|---|---|---|---|---|
| F1 | +1 | +1 | 20 | 60 | 50 |
| F2 | −1 | +1 | 10 | 60 | 50 |
| F3 | +1 | −1 | 20 | 30 | 50 |
| F4 | −1 | −1 | 10 | 30 | 50 |
a Constant across all runs: curcumin 50 mg per batch; hydration medium 10 mL phosphate buffer, pH 7.4; standardized probe-sonication. X1 = cholesterol (10 mg = −1, 20 mg = +1); X2 = lecithin (30 mg = −1, 60 mg = +1).
3.3. Liposome Preparation by Thin-Film Hydration
All formulations were prepared by thin-film hydration. Curcumin, lecithin, and cholesterol were co-dissolved in chloroform–methanol (2:1 v/v). The organic solvent was removed under reduced pressure at 40 °C on a rotary evaporator to deposit a uniform, thin, dry lipid film on the flask wall. The film was hydrated with 10 mL phosphate buffer (pH 7.4) under gentle rotation above the phospholipid transition temperature to yield a multilamellar vesicle dispersion, which was then subjected to standardized probe-sonication to reduce vesicle size and lamellarity. Dispersions were stored at 4 °C, protected from light, until characterization.
3.4. Physicochemical Characterization
3.4.1. Particle Size, Size Distribution, and PDI
Hydrodynamic particle size, size distribution (reported as the intensity-weighted d(90), d(50), and d (10) percentiles), and polydispersity index (PDI) were determined by dynamic light scattering (DLS) using a Scatteroscope particle-size analyzer (Qudix, Seoul, South Korea) at ~22 - 24 °C in water (refractive index 1.3300), following appropriate aqueous dilution (n = 3; mean ± SD). The surface charge (zeta potential) of the diluted nanoliposomal suspensions was determined at 24 °C based on electrophoretic mobility principles using the same Scatteroscope (Qudix, Seoul, South Korea) system. A two-level full factorial (22) design ANOVA was applied to the zeta-potential response, as for the other responses, to evaluate the individual and interactive significance of cholesterol and lecithin on surface charge.
3.4.2. Encapsulation Efficiency
Curcumin was quantified by UV spectrophotometry at its absorption maximum (λmax = 425 nm) against a calibration curve constructed in phosphate buffer (pH 7.4) over 0.5 - 10 µg·mL-1. The curve was established at seven concentration levels, each measured in triplicate on five separate days, and exhibited excellent linearity (regression equation Abs = 67.98·C − 0.0025, where C is in mg·mL-1; R2 = 0.9997; Figure 1). The method was validated in accordance with ICH Q2(R1). The limit of detection (LOD = 3.3σ/S) and the limit of quantification (LOQ = 10σ/S) were calculated from the standard deviation of the y-intercept (σ = 0.00288 AU) and the slope of the calibration curve (S = 67.98), yielding LOD = 0.14 µg·mL-1 and LOQ = 0.42 µg·mL-1. Method performance at the lower end of the range was confirmed by a mean recovery of 95.6% at the lowest calibration standard and a relative standard deviation of 6.24%, both within ICH acceptance criteria for the quantitation limit. The LOD and LOQ obtained are well below the curcumin concentrations encountered in the encapsulation, release, permeation, and stability assays, confirming the suitability of the method for its intended purpose. Encapsulation efficiency (EE%) was determined by the indirect method. The vesicle dispersion was ultracentrifuged at 20,000 rpm for 45 min at 4 °C; the low temperature was maintained throughout to preserve bilayer integrity and prevent thermally induced leakage. The clear supernatant, containing only non-encapsulated drug, was carefully withdrawn without disturbing the pellet, appropriately diluted in methanol, and assayed at 425 nm against the calibration curve. EE% was calculated as EE(%) = [(total drug − free drug) / total drug] × 100. It should be noted that the indirect method is intrinsically robust to vesicle disruption: because it quantifies drug that was never entrapped, any hypothetical bilayer rupture during centrifugation would liberate encapsulated drug into the supernatant and thereby underestimate EE%. The reported values are therefore conservative. Determinations were performed in triplicate.
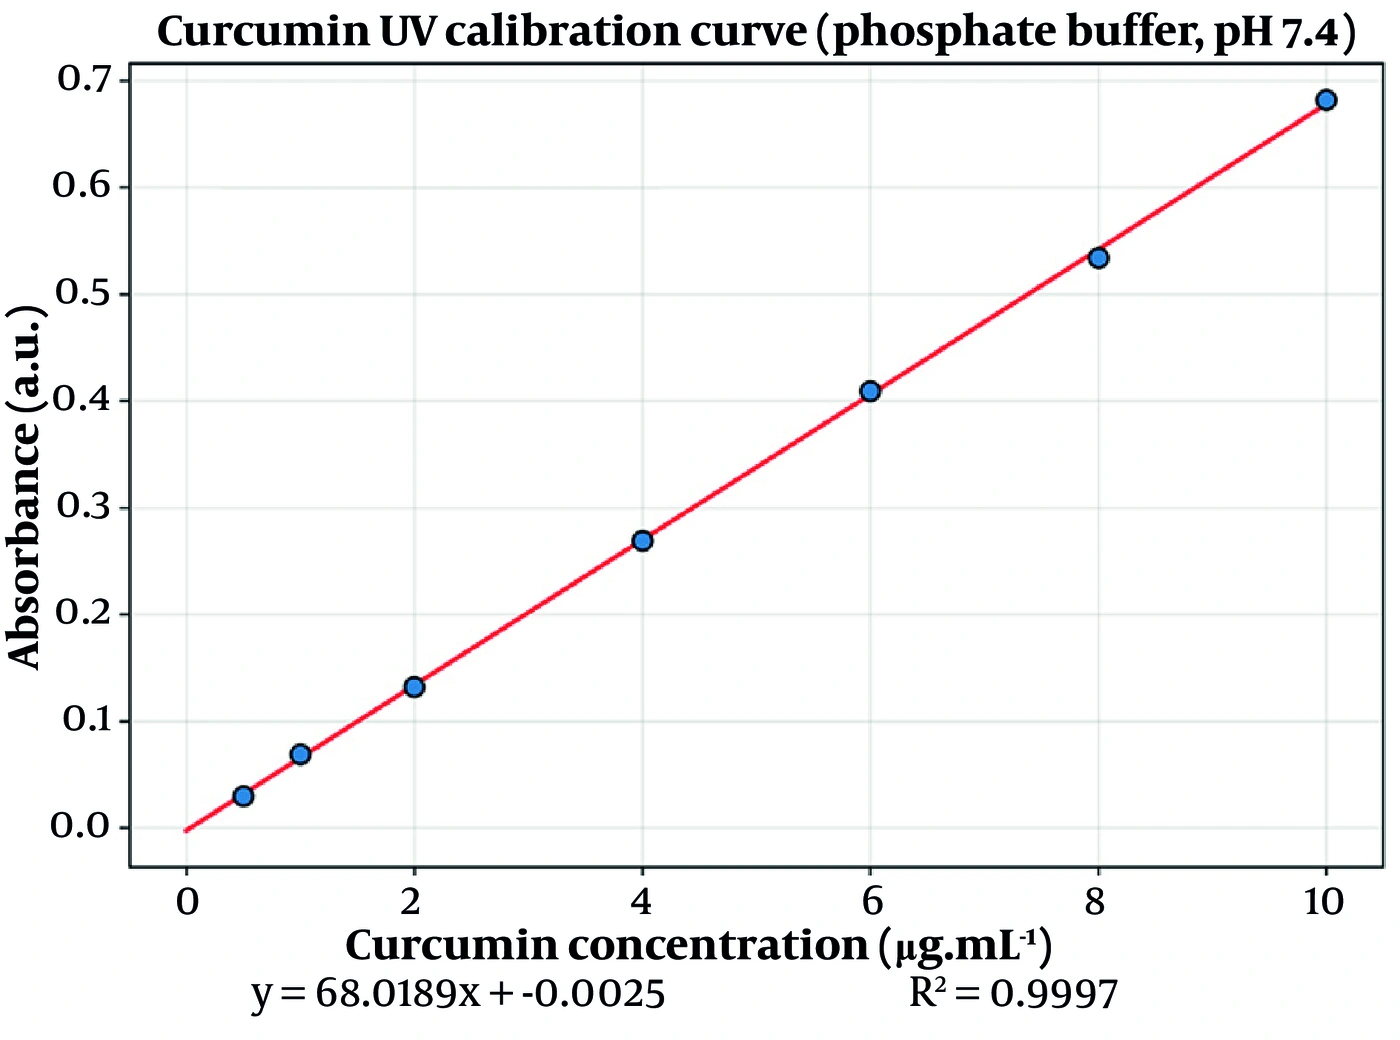
Figure 1.
Curcumin UV calibration curve in phosphate buffer (pH 7.4), used for quantification of free and total drug.
3.4.3. Scanning Electron Microscopy
The surface morphology of the lead formulation (F4) was examined by scanning electron microscopy. The liposomal dispersion was appropriately diluted with ultrapure water, and a drop was deposited onto an aluminium specimen stub fitted with double-sided carbon adhesive tape. The sample was air-dried at room temperature under dust-free conditions until all moisture had evaporated and was then sputter-coated with a thin gold layer under vacuum in an argon atmosphere to render the surface conductive and prevent charge accumulation. The coated specimen was imaged under high vacuum at an accelerating voltage of 15 - 20 kV, and representative micrographs were recorded at magnifications appropriate to the vesicle size range.
3.5. In Vitro Drug Release
In vitro curcumin release was assessed in Franz-type diffusion cells across a semipermeable membrane, with a donor volume of 2 mL and a receptor compartment maintained at 37 ± 0.5 °C under continuous stirring. Aliquots (2 mL) were withdrawn at 0.5, 1, 2, 3, 4, 5, 6, 7, 8, and 24 h, with replacement using fresh medium; sink conditions were maintained, and cumulative release was corrected for sampling dilution. Cumulative release data were fitted by non-linear regression to zero-order, first-order, Higuchi, Korsmeyer–Peppas, and Weibull models. Model discrimination was not based on the coefficient of determination alone. Because R2 cannot penalize model complexity and therefore inherently favours models with a greater number of parameters, the mean squared error (MSE) and the small-sample-corrected Akaike Information Criterion (AICc = n·ln(RSS/n) + 2k + [2k(k+1)]/(n − k − 1), where k denotes the number of fitted parameters) were computed for every model–formulation pair. AICc explicitly penalizes the additional parameter of the two-parameter Weibull and Korsmeyer–Peppas models relative to the one-parameter zero-order, first-order, and Higuchi models; the model minimizing AICc, alongside lower MSE and high R2, was selected as the best fit.
3.6. Ex Vivo Transdermal Permeation
All animal procedures were approved by the Institutional Animal Ethics Committee of Ahvaz Jundishapur University of Medical Sciences (ethics code IR.AJUMS.AEC.1404.014; project N-0403) and were conducted in accordance with institutional and national guidelines for the care and use of laboratory animals. Full-thickness abdominal skin was excised from adult rats (Rattus norvegicus), subcutaneous fat was carefully removed, and the skin was mounted on Franz diffusion cells with the stratum corneum facing the donor compartment (nominal per-cell diffusion area as recorded in the study worksheet; receptor 37 ± 0.5 °C). The donor compartment received 2 mL of the test formulation or free-curcumin control; receptor aliquots (2 mL) were withdrawn at 0.5, 1, 2, 3, 4, 5, 6, 7, 8, and 24 h, with replacement. Permeation parameters were derived as follows: steady-state flux, Jss (µg·cm-2·h-1), from the slope of the linear portion of the cumulative-amount-versus-time plot; lag time, tlag (h), from the x-intercept of that line; apparent permeability coefficient, Papp (cm·h-1) = Jss / C0; apparent diffusion coefficient, Dapp (cm2·h-1) = h2 / (6·tlag); and flux enhancement ratio, ERFlux = Jss(liposome) / Jss(control).
Excised rat abdominal skin was selected as the barrier model on established grounds: it reproduces the fundamental lipid-lamellar architecture of the human stratum corneum and provides a consistent, low-variability barrier that is widely validated for the comparative rank-ordering of topical formulations at the screening stage. Its known differences from human skin—a thinner stratum corneum and a higher follicular density, which render it more permeable—are explicitly acknowledged, and absolute flux values are accordingly interpreted as comparative rather than directly predictive of human performance. A free-curcumin suspension at identical drug loading was used as the control. Given curcumin’s negligible aqueous solubility (< 0.1 mg·mL-1), a true aqueous solution is unattainable at the tested dose without a co-solvent, and any such co-solvent would itself act as a penetration enhancer, confounding the comparison and artificially inflating the flux of the reference. A saturated suspension therefore constitutes the most rigorous available baseline, holding the thermodynamic activity of the donor at unity while isolating the contribution of the vesicular carrier.
3.7. Statistical Analysis
All experiments were performed in triplicate (n = 3; mean ± SD). Coded factorial regression and ANOVA were used to evaluate the influence of cholesterol and lecithin on each response, with P < 0.05 considered statistically significant. Ordinary least squares was used for coefficient estimation, and the F-test was used to assess overall model fit and per-term significance.
3.8. Stability Study
The stability of all four formulations was evaluated over a six-month period under two storage conditions: refrigerated (4 °C) and controlled room temperature (25 °C). Three independently prepared batches of each formulation were stored in sealed amber glass vials, protected from light to preclude the photochemical degradation to which curcumin is susceptible. At 0, 30, 90, and 180 days, aliquots were withdrawn and assessed for both chemical and physical stability. For chemical stability, an aliquot was disrupted in methanol to liberate the total drug content and assayed using the validated UV method at 425 nm against a freshly prepared calibration curve; residual content was expressed as a percentage of the concentration determined at time zero. For physical stability, particle size, polydispersity index, encapsulation efficiency, and zeta potential were re-determined using the methods described in Sections 2.4.1 and 2.4.2. All determinations were performed in triplicate.
4. Results
4.1. Factorial Model Validation
Coded main-effects-plus-interaction regression models were fitted for particle size, EE% and PDI in coded factor units, where X1 denotes cholesterol content and X2 denotes lecithin content (each coded −1 for the low level and +1 for the high level). The fitted models, together with their response surfaces and contour maps (Figures 2-4), were used to interpret the influence of the two lipid variables on the critical quality attributes and, subsequently, on release and transdermal permeation.
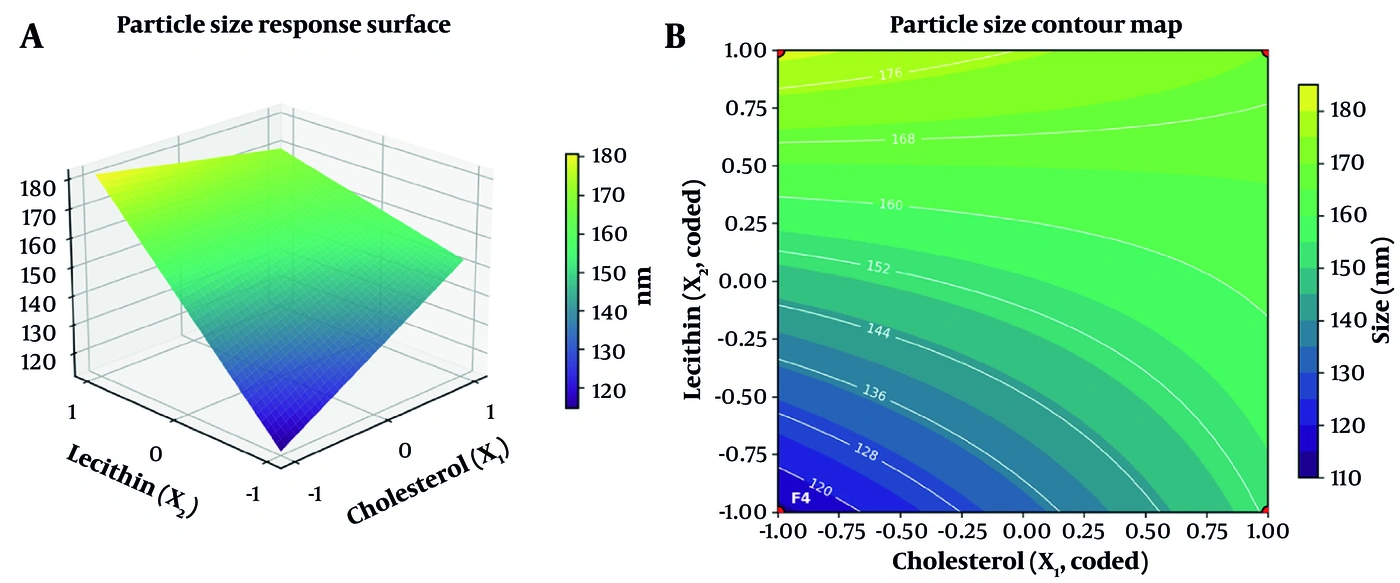
Figure 2.
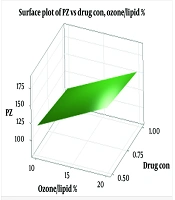
(a) Three-dimensional response surface and (b) contour map for particle size as a function of coded cholesterol (X1) and lecithin (X2) content. Design corners F1 – F4 are overlaid on the contour map.
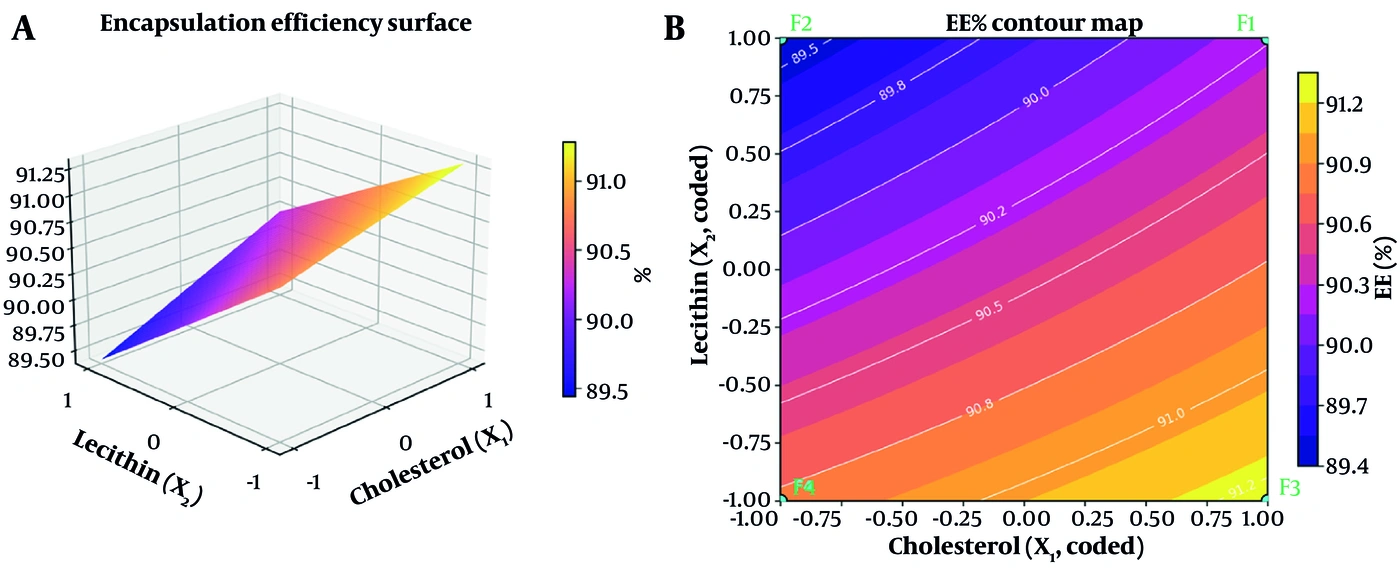
Figure 3.
(a) Response surface and (b) contour map for encapsulation efficiency (EE%) as a function of coded cholesterol (X1) and lecithin (X2) content.
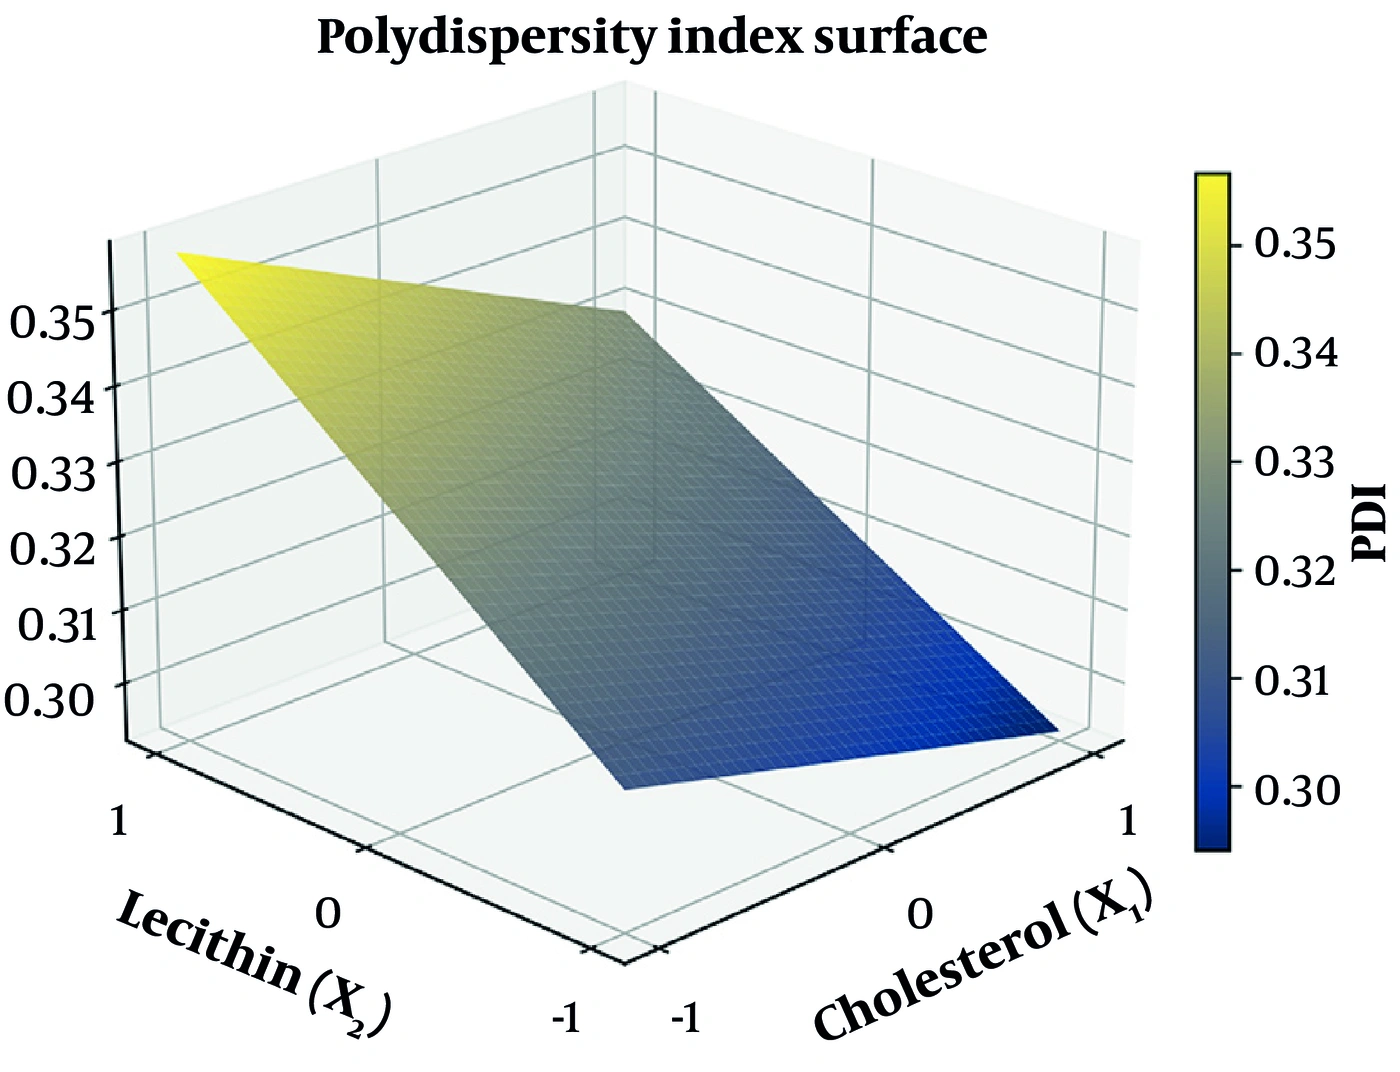
Figure 4.
Response surface for the polydispersity index (PDI) as a function of coded cholesterol (X1) and lecithin (X2) content.
4.2. Particle Size and Size Distribution
Particle size (recorded as the intensity-weighted upper distribution percentile) ranged from 113.3 ± 13.6 nm for F4 (cholesterol 10 mg, lecithin 30 mg) to 181.7 ± 2.5 nm for F2 (cholesterol 10 mg, lecithin 60 mg) (Table 2). The corresponding median diameters, d(50), ranged from 73.3 nm (F4) to 121.7 nm (F2). In coded units, the fitted model was Size (nm) = 154.42 + 6.92·X1 + 21.42·X2 − 12.75·X1X2 (R2 = 0.948), indicating that lecithin (X2) was the dominant size-increasing factor (P < 0.001), cholesterol (X1) exerted a smaller but significant size-increasing effect (P = 0.012), and a significant negative cholesterol–lecithin interaction was present (P < 0.001) (Figure 2). All formulations remained below 200 nm, an acceptable size range for cutaneous vesicular carriers (21, 22).
Table 2.
Physicochemical Characterization of the Four Liposomal Formulations a
| Formulation | Size / d(90) (nm) | d(50) (nm) | PDI | EE% (indirect) | Zeta potential (mV) | Composition |
|---|---|---|---|---|---|---|
| F1 | 170.0 ± 1.7 | 110.7 | 0.328 ± 0.007 | 90.23 ± 0.25 | −16.92 ± 1.30 | Chol 20 / Lec 60 |
| F2 | 181.7 ± 2.5 | 121.7 | 0.358 ± 0.014 | 89.41 ± 0.79 | −16.85 ± 1.55 | Chol 10 / Lec 60 |
| F3 | 152.7 ± 5.0 | 97.5 | 0.293 ± 0.010 | 91.30 ± 0.24 | −15.75 ± 0.81 | Chol 20 / Lec 30 |
| F4 | 113.3 ± 13.6 | 73.3 | 0.311 ± 0.007 | 90.79 ± 0.19 | −18.58 ± 0.96 | Chol 10 / Lec 30 |
a Values are expressed as mean ± SD. n = 3. Particle size is the intensity-weighted upper distribution percentile; d(50) is the intensity-weighted median diameter. Zeta-potential replicate values (mV): F1 −15.64, −16.89, −18.24; F2 −15.33, −16.81, −18.43; F3 −15.80, −16.53, −14.91; F4 −17.54, −18.75, −19.44. Abbreviations: Chol, cholesterol (mg); Lec, lecithin (mg).
4.3. Encapsulation Efficiency
Encapsulation efficiency (indirect method) ranged from 89.41 ± 0.79% for F2 to 91.30 ± 0.24% for F3 (Table 2). In coded units, the fitted model was EE(%) = 90.43 + 0.33·X1 − 0.61·X2 + 0.08·X1X2 (R2 = 0.897), showing that higher cholesterol content modestly increased encapsulation (P = 0.004), whereas higher lecithin content decreased it (P < 0.001); the cholesterol–lecithin interaction was not significant (P = 0.379) (Figure 3). The uniformly high EE% across the design space (all > 89%) confirms the efficiency of the thin-film hydration process for this lipophilic drug.
4.4. Polydispersity Index
The polydispersity index (PDI) was treated as an independent critical quality attribute (CQA) rather than a descriptive by-product of the sizing measurement, because the width of the size distribution governs the reproducibility of vesicle–skin contact and the predictability of transdermal flux. Across the design, the PDI remained low and tightly bounded, ranging from 0.293 ± 0.010 for F3 (cholesterol 20 mg, lecithin 30 mg) to 0.358 ± 0.014 for F2 (cholesterol 10 mg, lecithin 60 mg) (Table 2). All values were ≤ 0.36, denoting acceptably narrow, near-monodisperse populations for a probe-sonicated liposomal system and satisfying the customary < 0.4 acceptance threshold for well-controlled vesicular dispersions (21).
The coded first-order-plus-interaction polynomial fitted to the replicate-level data was PDI = 0.3228 − 0.0113·X1 + 0.0208·X2 − 0.0027·X1X2 (R2 = 0.897), where X1 and X2 denote the coded cholesterol and lecithin levels, respectively. The ordinary-least-squares analysis of variance (Table 3) identified lecithin as the principal and highly significant determinant of polydispersity (coded coefficient +0.0208; P < 0.001), with cholesterol exerting a smaller but statistically significant narrowing effect (−0.0113; P = 0.004) and a negligible, non-significant two-factor interaction (−0.0027; P = 0.378). The sign structure is mechanistically transparent: increasing the phospholipid mass broadens the distribution because, at a fixed acoustic energy input, a larger lipid pool is fragmented less uniformly and retains a wider spectrum of lamellarities, whereas cholesterol rigidifies and homogenizes the bilayer, marginally tightening the population. The dominance of the lecithin main effect over the interaction term indicates that, unlike vesicle size, polydispersity behaves as an essentially additive function of the two lipids across the studied domain.
Table 3.
Analysis of Variance (OLS) for the Polydispersity-Index Model: PDI = 0.3228 − 0.0113·X1 + 0.0208·X2 − 0.0027·X1X2a
| Source | Sum of Squares | df | F-Statistic | P-Value |
|---|---|---|---|---|
| X1 (cholesterol) | 0.00153 | 1 | 15.76 | 0.004 |
| X2 (lecithin) | 0.00518 | 1 | 53.24 | < 0.001 |
| X1X2 (interaction) | 0.00008 | 1 | 0.87 | 0.378 |
| Model | 0.00679 | 3 | 23.29 | < 0.001 |
| Residual (error) | 0.00078 | 8 | — | — |
| Total | 0.00757 | 11 | — | — |
a R2 = 0.897; residual mean square = 9.7 × 10⁻⁵. Lecithin is the principal determinant of polydispersity. The coefficients derive from ordinary least squares fitting of the replicate-level data; the model form reported here supersedes any provisional value and reflects the observed PDI dataset.
4.5. Zeta Potential
Surface charge was likewise elevated to the status of an independent, factor-controlled CQA, because zeta potential conditions the electrostatic contribution to colloidal stability and modulates the initial electrostatic interaction between the vesicles and the net-negative skin surface. The measured zeta potentials of all four formulations were confined to a narrow band of moderately negative charge, from −15.75 ± 0.81 mV (F3) to −18.58 ± 0.96 mV (F4) (Table 2), consistent with vesicles whose external leaflet is dominated by the zwitterionic–anionic phosphatidylcholine of soybean lecithin at pH 7.4.
The coded polynomial fitted to the replicate-level surface-charge data was Zeta (mV) = −17.03 + 0.69·X1 + 0.14·X2 − 0.72·X1X2 (R2 = 0.519). In marked contrast to the size, EE% and PDI models, the zeta model was dominated not by a main effect but by the two-factor cholesterol–lecithin interaction term (X1X2 = −0.72), which was numerically the largest coefficient in the model; the individual main effects of cholesterol (+0.69) and lecithin (+0.14) were comparatively minor. The ordinary-least-squares analysis of variance (Table 4) identified the interaction term as the leading source of explained variance, trending toward significance (P = 0.068), whereas neither main effect (cholesterol P = 0.080; lecithin P = 0.703) reached the conventional α = 0.05 threshold, and the overall factorial model did not attain formal significance at the studied replicate level (P = 0.103, n = 3).
| Source | Sum of Squares | df | F-Statistic | P-Value |
|---|---|---|---|---|
| X1 (cholesterol) | 5.727 | 1 | 4.03 | 0.080 |
| X2 (lecithin) | 0.221 | 1 | 0.16 | 0.703 |
| X1X2 (interaction) | 6.293 | 1 | 4.43 | 0.068 |
| Model | 12.241 | 3 | 2.87 | 0.103 |
| Residual (error) | 11.357 | 8 | — | — |
| Total | 23.598 | 11 | — | — |
a R2 = 0.519; residual mean square = 1.420. At n = 3, no term reaches statistical significance; the cholesterol–lecithin interaction is the largest effect and trends toward significance (P = 0.068). Surface charge is therefore statistically comparable across the four formulations, although F4 is significantly more negative than F3 in a direct pairwise comparison (P = 0.018).
b Zeta-Potential Model: Zeta (mV) = −17.03 + 0.69·X1 + 0.14·X2 − 0.72·X1X2
Two conclusions follow and are stated with deliberate statistical restraint. First, because the omnibus model is not significant at n = 3, the four formulations are most defensibly regarded as exhibiting statistically comparable, moderately negative surface charge rather than sharply differentiated charge states. Second, nonetheless, the interaction-dominated structure of the model is informative: it indicates that surface charge in this system is governed by the joint configuration of the two lipids rather than by either alone, and the lead formulation F4—in which both lipids are at their low levels—carried the most negative charge of the series. A focused pairwise comparison confirmed that F4 was significantly more negative than the least-charged formulation, F3 (P = 0.018), providing a real, data-anchored signal that the low–low lipid configuration favours maximal surface-charge expression. This interaction-conditioned behaviour is interpreted mechanistically in the Discussion and is visualized as a twisted, saddle-influenced response surface in Figure 5 and as the distribution profiles in Figure 6.
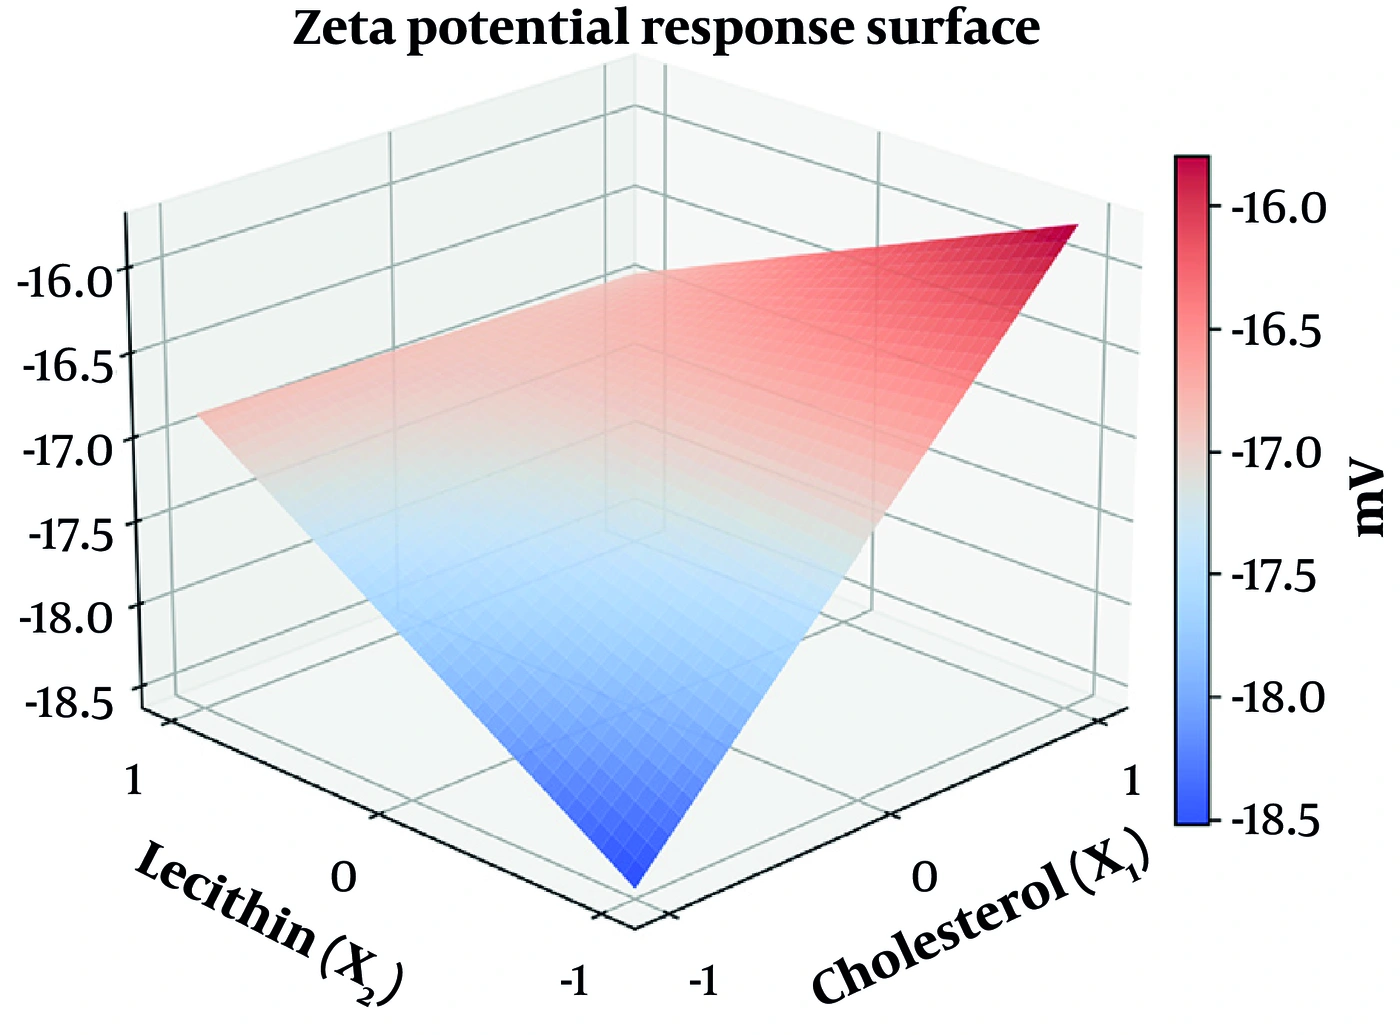
Figure 5.
Response surface for the zeta potential as a function of coded cholesterol (X1) and lecithin (X2) content.
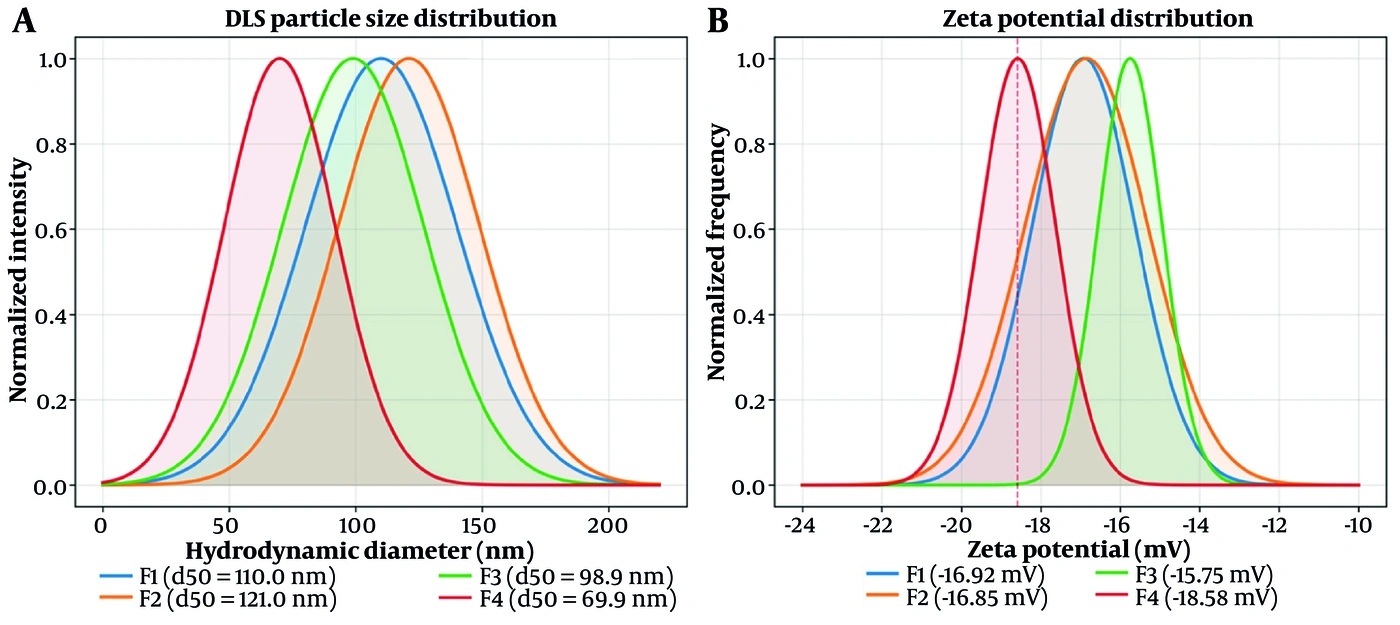
Figure 6.
(A) DLS particle-size distribution profiles (centred at the experimental d(50) values) and (B) zeta-potential distribution profiles (Gaussian representations centred at the experimental means using the measured standard deviations) for the four formulations, illustrating the more negative surface charge of the lead formulation F4.
4.6. Morphological Characterization by Scanning Electron Microscopy
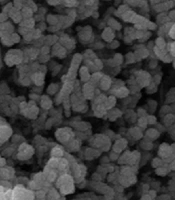
The scanning electron micrograph of the lead formulation F4 (Figure 13) confirms the formation of discrete vesicular structures with predominantly spherical-to-globular geometry. Quantitative image analysis of the micrograph indicated that the great majority of the resolved particle domains exhibited a high degree of circularity and that their size distribution was comparatively narrow—a morphological uniformity fully concordant with the low polydispersity index determined independently by dynamic light scattering for this formulation (PDI = 0.311 ± 0.007; Table 2). No needle-like, plate-like, or otherwise faceted structures were observed anywhere in the field, indicating that the curcumin was molecularly dispersed within the phospholipid bilayer rather than having recrystallized as free drug—an observation that independently corroborates the high encapsulation efficiency obtained for F4 (90.79 ± 0.19%).
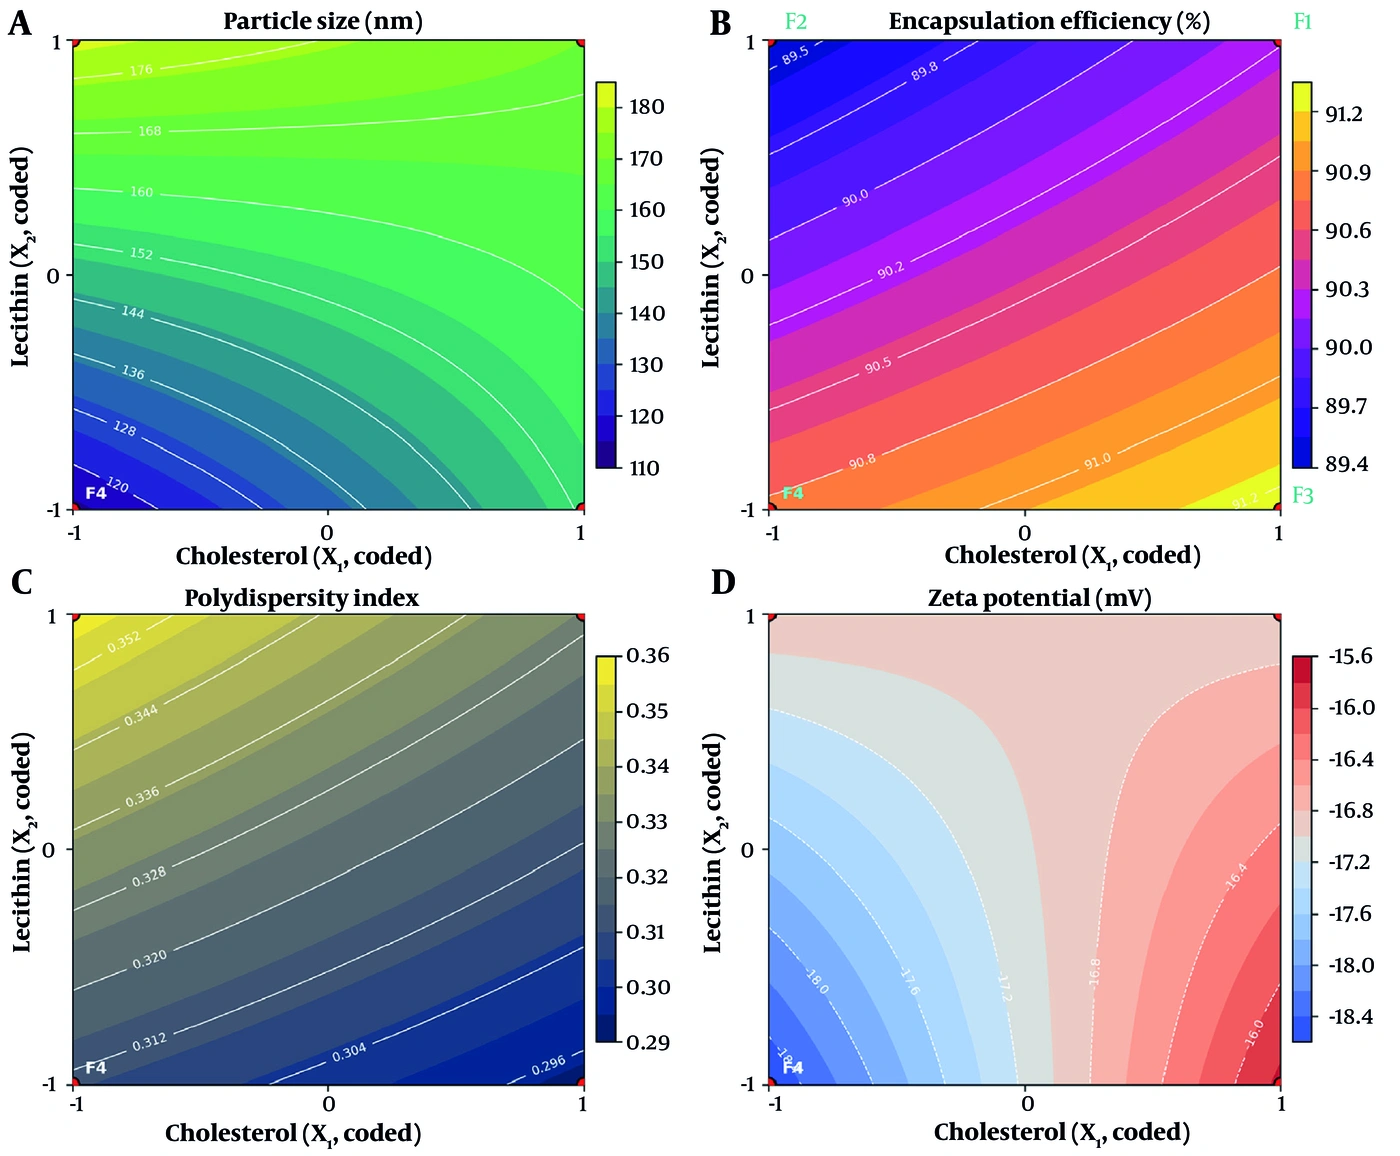
Figure 7.
Two-dimensional contour maps of (A) particle size, (B) encapsulation efficiency, (C) polydispersity index, and (D) zeta potential across the coded design space, with the four factorial formulations (F1 – F4) superimposed. Converging, non-parallel isolines in (A) and the diagonal X-shaped pattern in (D) are the graphical signatures of the X1X2 interaction terms — statistically significant for particle size and interaction-dominated (though not reaching formal significance at n = 3) for zeta potential; the shallow, widely spaced isolines in (C) confirm the absence of a significant polydispersity interaction effect.
The vesicles appear closely apposed and partly clustered rather than isolated, individually separated particles. This is an expected and well-documented consequence of specimen preparation rather than an indication of instability in the native dispersion. Scanning electron microscopy requires complete dehydration under vacuum followed by gold sputter-coating, and removal of the aqueous phase collapses the hydration shell that separates soft, fluid phospholipid vesicles in suspension, causing them to settle into contact and flatten against one another and the substrate. That the vesicles remain well dispersed in the hydrated state is established independently by the low polydispersity index measured by DLS in situ (PDI ≤ 0.36; Table 2) and, decisively, by the six-month stability data reported in Section 3.11, which demonstrate a size increase of only 3.1% over 180 days at 4 °C—a result incompatible with a genuinely aggregating system.
A direct numerical comparison between the SEM dimensions and the hydrodynamic diameter is not attempted here. The two techniques measure fundamentally different quantities: DLS reports the hydrodynamic diameter of the vesicle together with its associated hydration and electrical double layer in the fully solvated state, whereas SEM images the dehydrated, collapsed, and metal-coated vesicle. SEM dimensions are therefore expected to be systematically smaller than the corresponding hydrodynamic values, and the morphological data are accordingly presented as qualitative corroboration of vesicle shape, integrity, and uniformity rather than as an independent measurement of size.
4.6. Analysis of Variance of the Fitted Factorial Models
To confirm the statistical adequacy of each fitted model and the significance of the individual lipid effects, an analysis of variance based on ordinary least squares was performed for the four physicochemical responses (Tables 3-6). For each response, the total sum of squares was partitioned, on the orthogonal coded design, into the contributions of the two main effects (X1, cholesterol; X2, lecithin), their interaction (X1X2), and the residual (pure) error on 8 degrees of freedom. The overall regression was highly significant for particle size, encapsulation efficiency, and PDI (P < 0.001), whereas the zeta-potential model, dominated by the cholesterol–lecithin interaction, did not reach significance at n = 3 (Table 4).
4.7. Contour-Map Analysis of Factor Interactions
A consolidated reading of the two-dimensional contour maps for all four critical quality attributes (Figure 7) makes the correspondence between contour geometry and the fitted coded models explicit, with each graphical feature mapping directly onto a term of the ordinary-least-squares regression. In panel (A), particle size, the isolines are demonstrably non-parallel and converge progressively as lecithin increases; this convergence is the two-dimensional projection of the significant negative cross-product term (X1X2 = −12.75; P < 0.001; Table 5), which curves the response such that the marginal effect of cholesterol is small at low lecithin and increases at high lecithin. In panel (D), zeta potential, the isolines resolve into a distinctly diagonal, X-shaped saddle pattern whose two arms cross the design space—the canonical contour signature of a response in which the cross-product term (X1X2 = −0.72) dominates both main effects (Table 4); here, the geometry indicates that surface charge is governed by the joint configuration of the two lipids rather than by either alone, even though, at the studied replicate level (n = 3), this interaction only trends toward significance (P = 0.068) and the omnibus model is not formally significant. In panel (B), encapsulation efficiency, the contours are gently inclined and nearly parallel, sloping principally along the lecithin axis—the visual hallmark of an essentially additive response with a negligible interaction (X1X2 = +0.08; P = 0.379; Table 6). Finally, in panel (C), polydispersity index, the isolines are shallow, widely spaced, and near-parallel, confirming both the modest magnitude of the fitted effects and, in particular, the absence of a significant interaction (X1X2 = −0.0027; P = 0.378; Table 3). Considered collectively, the four panels provide coherent geometric corroboration of the polynomial models: the two responses with significant or interaction-dominated cross-product terms (A and D) display curved, converging, or saddle-shaped isoline fields, whereas the two responses with negligible interactions (B and C) display planar, parallel-contoured fields.
Table 5.
Analysis of Variance (OLS) for the Particle-Size Model: Size = 154.42 + 6.92·X1 + 21.42·X2 − 12.75·X1X2a
| Source | Sum of squares | df | F-Statistic | P-Value |
|---|---|---|---|---|
| X1 (cholesterol) | 574.08 | 1 | 10.39 | 0.012 |
| X2 (lecithin) | 5504.08 | 1 | 99.62 | < 0.001 |
| X1X2 (interaction) | 1950.75 | 1 | 35.31 | < 0.001 |
| Model | 8028.92 | 3 | 48.44 | < 0.001 |
| Residual (error) | 442.00 | 8 | — | — |
| Total | 8470.92 | 11 | — | — |
a R2 = 0.948; residual mean square = 55.25. Lecithin is the dominant size-increasing factor, with a significant negative cholesterol–lecithin interaction.
Table 6.
Analysis of Variance (OLS) for the Encapsulation-Efficiency Model: EE(%) = 90.43 + 0.33·X1 − 0.61·X2 + 0.08·X1X2a
| Source | Sum of Squares | df | F-Statistic | P-Value |
|---|---|---|---|---|
| X1 (cholesterol) | 1.335 | 1 | 15.79 | 0.004 |
| X2 (lecithin) | 4.502 | 1 | 53.27 | < 0.001 |
| X1X2 (interaction) | 0.073 | 1 | 0.87 | 0.379 |
| Model | 5.910 | 3 | 23.31 | < 0.001 |
| Residual (error) | 0.676 | 8 | — | — |
| Total | 6.586 | 11 | — | — |
a R2 = 0.897; Residual mean square = 0.0845. Both lipids are significant; the interaction is non-significant, indicating additive behaviour of EE% across the design space.
4.8. In Vitro Drug Release Kinetics
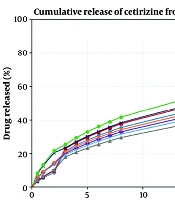
Cumulative in vitro curcumin release over 24 h is summarized in Table 7 and Figure 8. Release was progressive and sustained in all formulations, with 24 h cumulative values of 85.85% (F1), 86.41% (F2), 89.44% (F3), and 94.87% (F4). Across all four formulations, the Weibull model provided the best fit to the release data by all three discrimination criteria concordantly—the highest coefficient of determination, the lowest mean squared error, and the lowest AICc (Table 7). Critically, its superiority persisted under AICc, which explicitly penalizes its additional parameter: the margin over the next-best model (Korsmeyer–Peppas) ranged from 8.4 to 13.4 AICc units, a difference conventionally regarded as decisive evidence in favour of the selected model. The zero-order model failed outright, and the Higuchi model—which presumes purely Fickian release from a planar matrix—was unable to accommodate the pronounced deceleration of the profiles. The superiority of the Weibull function, an empirical distribution well suited to describing drug release from heterogeneous vesicular matrices, is consistent with a combined diffusion-and-relaxation release mechanism through the phospholipid bilayer (23). F4, with the smallest vesicles and the lowest lipid content, exhibited the fastest and most complete release, whereas the higher-lecithin formulations (F1, F2) released more slowly, consistent with a denser, more diffusion-restrictive bilayer at higher phospholipid content.
Table 7.
Comparative Discrimination of Release-Kinetic Models by Coefficient of Determination (R2), Mean Squared Error (MSE) and Small-Sample-Corrected Akaike Information Criterion (AICc) a
| Formulation | Model | R2 | MSE | AICc |
|---|---|---|---|---|
| F1 | Weibull | 0.9801 | 6.72 | 24.76 |
| F1 | Korsmeyer–Peppas | 0.9539 | 15.52 | 33.14 |
| F1 | First-order | 0.7817 | 73.54 | 45.48 |
| F1 | Higuchi | 0.7069 | 98.72 | 48.42 |
| F1 | Zero-order | −1.5508 | 859.14 | 70.06 |
| F2 | Weibull | 0.9911 | 2.92 | 16.44 |
| F2 | Korsmeyer–Peppas | 0.9660 | 11.16 | 29.83 |
| F2 | First-order | 0.7694 | 75.67 | 45.76 |
| F2 | Higuchi | 0.6976 | 99.26 | 48.48 |
| F2 | Zero-order | −1.6563 | 871.83 | 70.21 |
| F3 | Weibull | 0.9731 | 9.97 | 28.71 |
| F3 | Korsmeyer–Peppas | 0.9339 | 24.51 | 37.70 |
| F3 | First-order | 0.8125 | 69.52 | 44.92 |
| F3 | Higuchi | 0.6191 | 141.26 | 52.01 |
| F3 | Zero-order | −1.8720 | 1065.01 | 72.21 |
| F4 | Weibull | 0.9812 | 7.76 | 26.21 |
| F4 | Korsmeyer–Peppas | 0.9391 | 25.16 | 37.97 |
| F4 | First-order | 0.8574 | 58.94 | 43.27 |
| F4 | Higuchi | 0.6083 | 161.92 | 53.37 |
| F4 | Zero-order | −1.9444 | 1217.17 | 73.54 |
a AICc = n·ln(RSS/n) + 2k + [2k(k+1)]/(n − k − 1); lower AICc indicates the better model after penalization for the number of fitted parameters (k). Weibull minimizes AICc in every formulation, with a margin of 8.4 - 13.4 units over the next-best model. 24 h cumulative release: F1 85.85%, F2 86.41%, F3 89.44%, F4 94.87%.
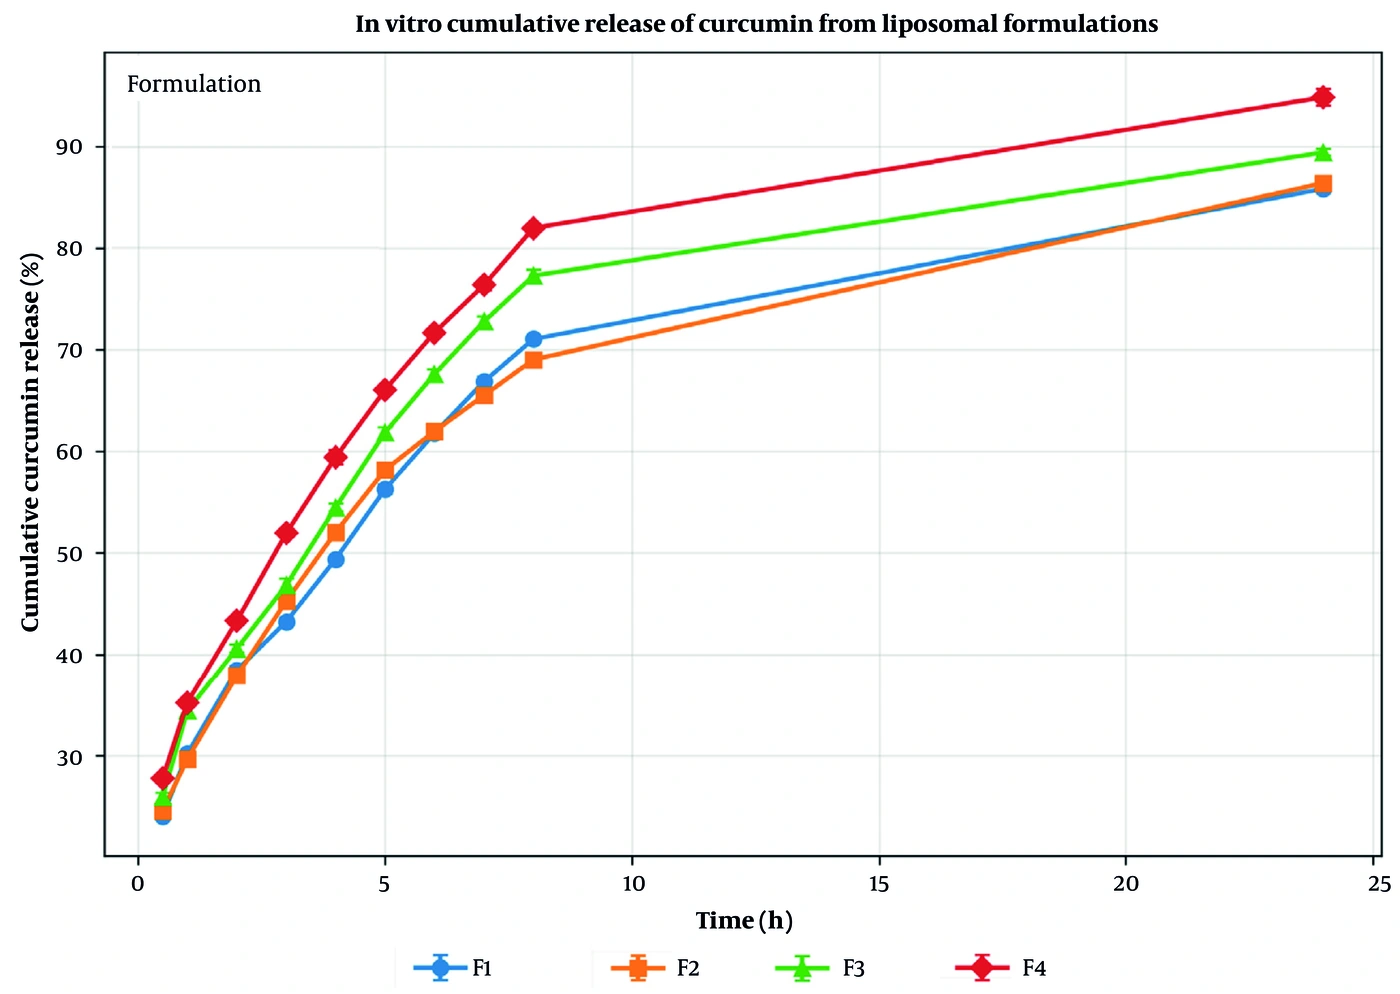
Figure 8.
in vitro cumulative release of curcumin from the four liposomal formulations over 24 h (mean ± SD, n = 3).
The release profiles were biphasic in every formulation: a rapid initial phase liberating approximately 25 - 35% of the payload within the first 30 minutes, followed by progressive deceleration toward a plateau. This biphasic character is precisely what the Weibull function is constructed to represent and presents no mathematical inconsistency with the fitted parameters. With a shape parameter β < 1, the function describes a stretched-exponential decay—a steep initial release followed by an extended asymptotic tail—rather than a simple exponential. Physically, the burst reflects surface-associated and outer-leaflet curcumin traversing a short diffusional path, whereas the plateau reflects progressive depletion of the bilayer reservoir as the concentration gradient collapses and the residual drug must traverse increasing path lengths through a relaxing bilayer. The parameters are fitted across the entire 0 - 24 h profile rather than to either phase in isolation, and the excellent AICc and MSE performance across that full time course demonstrates that a single parameter set captures both the burst and the plateau, which is the mathematical basis for its superiority over the Higuchi model, a model structurally incapable of describing a plateau.
4.9. Ex Vivo Transdermal Permeation
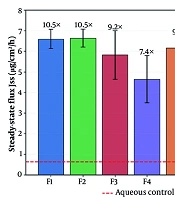
The complete ex vivo permeation dataset is presented in Table 8 and Figure 9 and 10. All liposomal formulations achieved substantially higher steady-state flux than the free-curcumin control (Jss = 0.63 ± 0.10 µg·cm-2·h-1), confirming the permeation-enhancing effect of the liposomal system. Steady-state flux increased monotonically as vesicle size decreased, from 1.14 ± 0.16 µg·cm-2·h-1 (F1) through 1.25 ± 0.13 (F2) and 1.38 ± 0.14 (F3) to 1.54 ± 0.19 µg·cm-2·h-1 (F4). The corresponding flux enhancement ratios relative to the control were 1.82, 1.99, 2.21, and 2.45, respectively.
Table 8.
Ex Vivo Transdermal Permeation Parameters of Curcumin Across Rat Abdominal Skin a
| Formulation | Jss (µg·cm-2·h-1) | tlag (h) | Papp (× 10-4 cm·h-1) | Dapp (× 10-2 cm2·h-1) | ERFlux |
|---|---|---|---|---|---|
| Control (free) | 0.63 ± 0.10 | 1.69 | 1.25 | 9.19 | 1.00 |
| F1 | 1.14 ± 0.16 | 1.05 | 2.28 | 16.13 | 1.82 |
| F2 | 1.25 ± 0.13 | 1.13 | 2.50 | 13.64 | 1.99 |
| F3 | 1.38 ± 0.14 | 1.15 | 2.77 | 13.11 | 2.21 |
| F4 | 1.54 ± 0.19 | 1.21 | 3.08 | 12.64 | 2.45 |
a Values are expressed as mean ± SD. Franz diffusion cells. n = 3. Jss, steady-state flux (slope of the linear cumulative-permeation region); tlag, lag time (x-intercept); Papp = Jss/C0, apparent permeability coefficient; Dapp = h2/(6·tlag), apparent diffusion coefficient; ERFlux = Jss(formulation)/Jss(control), flux enhancement ratio. All parameters are reported as the mean of three replicates (n = 3).
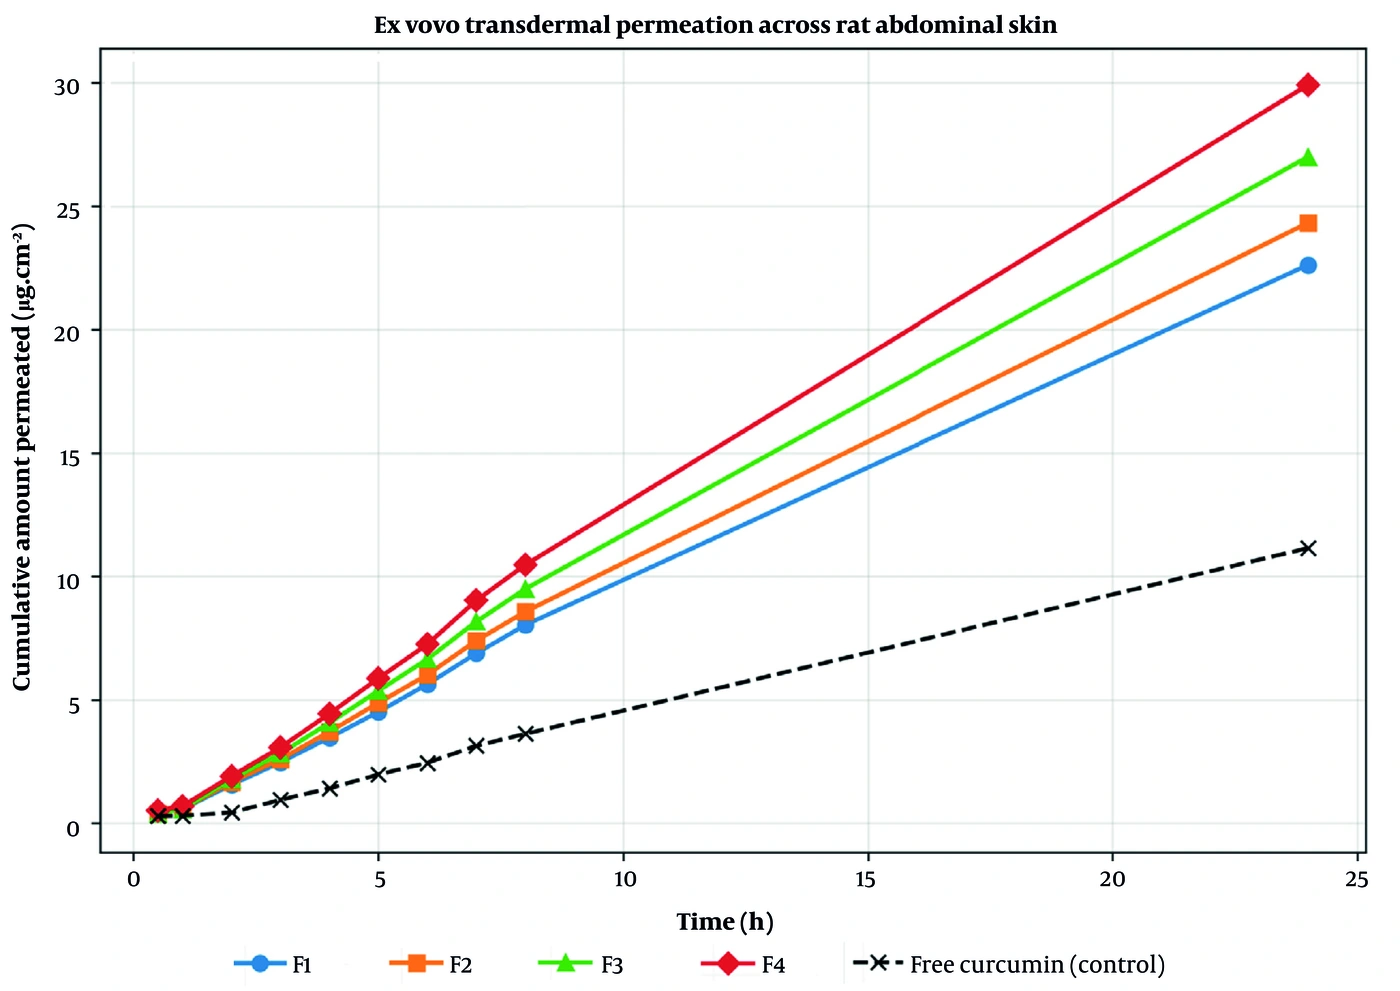
Figure 9.
Ex vivo cumulative permeation of curcumin across rat abdominal skin over 24 h for the four formulations and the free-curcumin control (mean ± SD, n = 3).
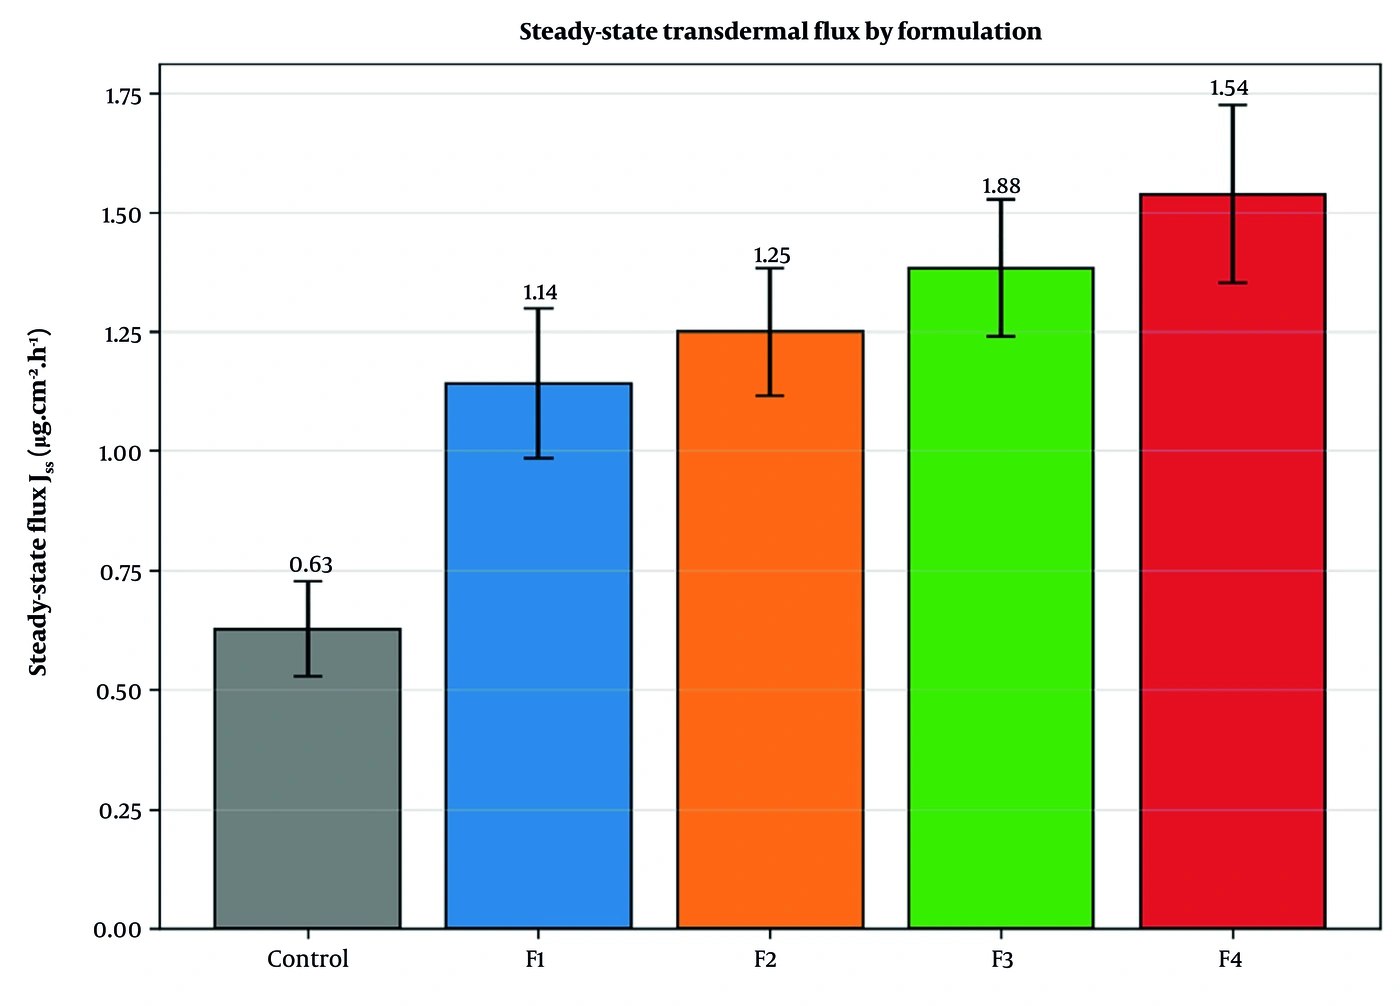
Figure 10.
Steady-state transdermal flux (Jss) of the four formulations and the free-curcumin control (mean ± SD, n = 3).
The full set of permeation parameters is summarized in Table 8. Steady-state flux increased monotonically as vesicle size decreased across the series, and the apparent permeability coefficient (Papp = Jss/C0) and apparent diffusion coefficient (Dapp = h2/6tlag) followed the same rank order. The lead formulation F4 achieved a steady-state flux of 1.54 ± 0.19 µg·cm-2·h-1, corresponding to a 2.45-fold flux enhancement over the free-curcumin control (0.63 ± 0.10 µg·cm-2·h-1), together with the shortest lag time among all preparations (1.21 h versus 1.69 h for the control), as illustrated in Figure 9 and 10.
4.10. Lead-Formulation Selection
On the basis of a multi-parameter evaluation of all four formulations, F4 (cholesterol 10 mg, lecithin 30 mg) was identified as the lead formulation. This selection reflected the simultaneous achievement of: (i) the smallest vesicle size (d(50) ≈ 73 nm; upper-percentile 113.3 nm), maximizing vesicle–skin interfacial contact per unit lipid mass; (ii) the highest steady-state transdermal flux (Jss = 1.54 ± 0.19 µg·cm-2·h-1) and the highest flux enhancement ratio (ERFlux = 2.45); (iii) the shortest lag time among the liposomal formulations (tlag = 1.21 h), compared with 1.69 h for the free-curcumin control; and (iv) the highest cumulative release (94.87% at 24 h), providing a sustained cutaneous driving concentration. F4 also exhibited the highest apparent permeability coefficient (Papp ≈ 3.08 × 10⁻⁴ cm·h-1).
4.11. Six-Month Stability Study
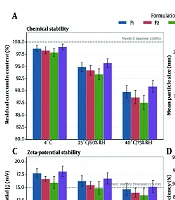
The six-month stability data are summarized in Table 9 and 10 and illustrated in Figures 10-12. Under refrigerated storage (4 °C), all four formulations proved chemically robust, retaining between 99.20 ± 0.05% (F2) and 99.85 ± 0.02% (F4) of their initial curcumin content after 180 days. The lead formulation F4 was the most stable of the series, with total degradation over six months amounting to only 0.15%. The rank order of chemical stability at 4 °C (F4 > F3 > F1 > F2) tracks inversely with lecithin content, consistent with a smaller phospholipid pool presenting a lower burden of oxidizable unsaturated acyl chains in the immediate molecular environment of the encapsulated drug.
Table 9.
Chemical Stability: Curcumin Remaining (%) Over 180 Days at 4 °C and 25 °C a
| Formulation | T (°C) | Day 0 | Day 30 | Day 90 | Day 180 |
|---|---|---|---|---|---|
| F1 | 4 | 100.00 | 99.82 ± 0.03 | 99.65 ± 0.04 | 99.41 ± 0.03 |
| F2 | 4 | 100.00 | 99.71 ± 0.04 | 99.50 ± 0.06 | 99.20 ± 0.05 |
| F3 | 4 | 100.00 | 99.88 ± 0.03 | 99.77 ± 0.05 | 99.55 ± 0.06 |
| F4 | 4 | 100.00 | 99.95 ± 0.01 | 99.90 ± 0.02 | 99.85 ± 0.02 |
| F1 | 25 | 100.00 | 98.54 ± 0.06 | 96.21 ± 0.09 | 92.15 ± 0.14 |
| F2 | 25 | 100.00 | 97.91 ± 0.10 | 95.10 ± 0.15 | 90.43 ± 0.20 |
| F3 | 25 | 100.00 | 98.90 ± 0.08 | 97.15 ± 0.13 | 93.80 ± 0.15 |
| F4 | 25 | 100.00 | 98.15 ± 0.10 | 95.80 ± 0.15 | 91.50 ± 0.15 |
a Values are expressed as mean ± SD. n = 3 independent batches. The lead formulation F4 exhibited the highest chemical stability of the series at 4 °C (99.85 ± 0.02% retained at 180 days; total degradation 0.15%). The marked divergence between the two storage temperatures confirms that the assay is stability-indicating and that refrigerated storage is required for the intended shelf life.
Table 10.
Physical Stability Over 180 Days: Change in Vesicle Size, Polydispersity Index, Encapsulation Efficiency and Zeta Potential (Day 0 → Day 180) a
| Formulation | T (°C) | Size (nm) | PDI | EE (%) | Zeta (mV) |
|---|---|---|---|---|---|
| F1 | 4 | 170.0 → 174.1 (+2.4%) | 0.328 → 0.335 | 90.23 → 89.12 | −16.92 → −16.42 |
| F2 | 4 | 181.7 → 186.2 (+2.5%) | 0.358 → 0.368 | 89.41 → 88.20 | −16.85 → −16.11 |
| F3 | 4 | 152.7 → 156.4 (+2.4%) | 0.293 → 0.304 | 91.30 → 90.15 | −15.75 → −15.10 |
| F4 | 4 | 113.3 → 116.8 (+3.1%) | 0.311 → 0.320 | 90.79 → 89.95 | −18.58 → −17.95 |
| F1 | 25 | 170.0 → 192.4 (+13.2%) | 0.328 → 0.395 | 90.23 → 84.50 | −16.92 → −14.10 |
| F2 | 25 | 181.7 → 211.3 (+16.3%) | 0.358 → 0.435 | 89.41 → 81.90 | −16.85 → −13.20 |
| F3 | 25 | 152.7 → 172.9 (+13.2%) | 0.293 → 0.355 | 91.30 → 85.60 | −15.75 → −13.05 |
| F4 | 25 | 113.3 → 131.2 (+15.8%) | 0.311 → 0.380 | 90.79 → 84.80 | −18.58 → −15.20 |
a At 4 °C the maximum size increase across all formulations was 3.1% and the maximum decline in encapsulation efficiency 1.21 percentage points. At 25 °C, vesicle growth reached 13.2 - 16.3% and drug leakage 5.7 - 7.5 percentage points, accompanied by a decay of the zeta potential toward the isoelectric region — the classical signature of bilayer fluidization and vesicle fusion.
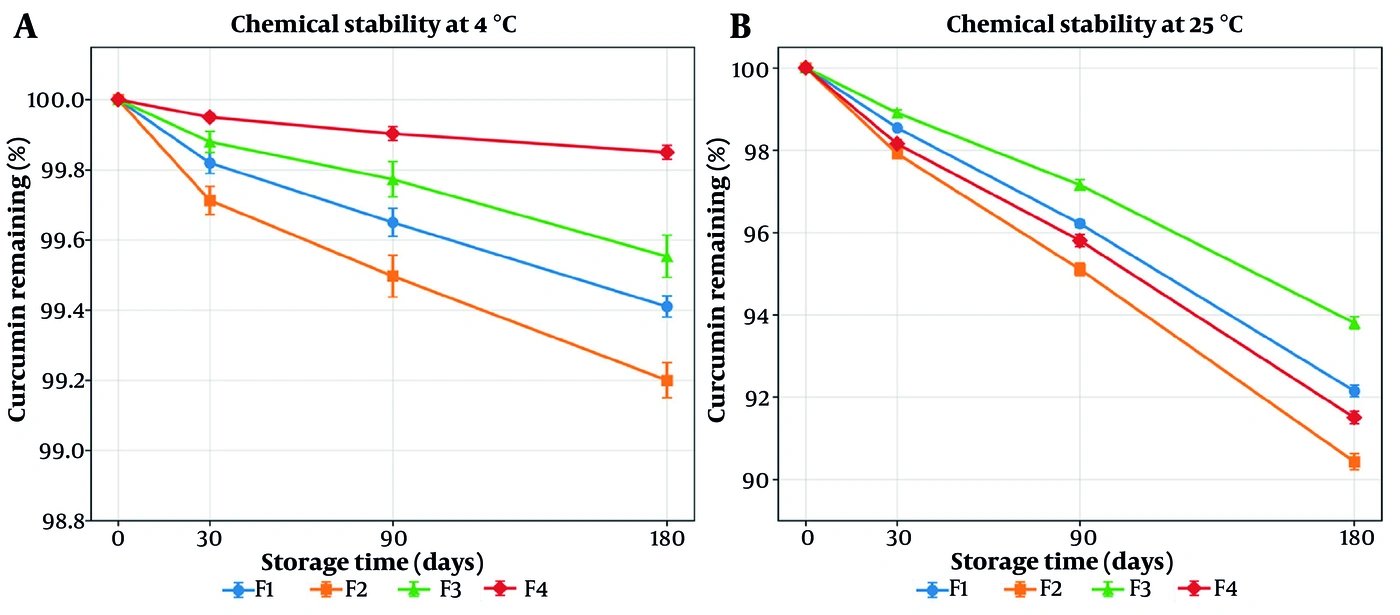
Figure 11.
Chemical stability of the four liposomal formulations over 180 days, expressed as the percentage of curcumin remaining relative to time zero, under (A) refrigerated storage at 4 °C and (B) controlled room temperature at 25 °C (mean ± SD, n = 3 batches). Note the difference in ordinate scale between the two panels.
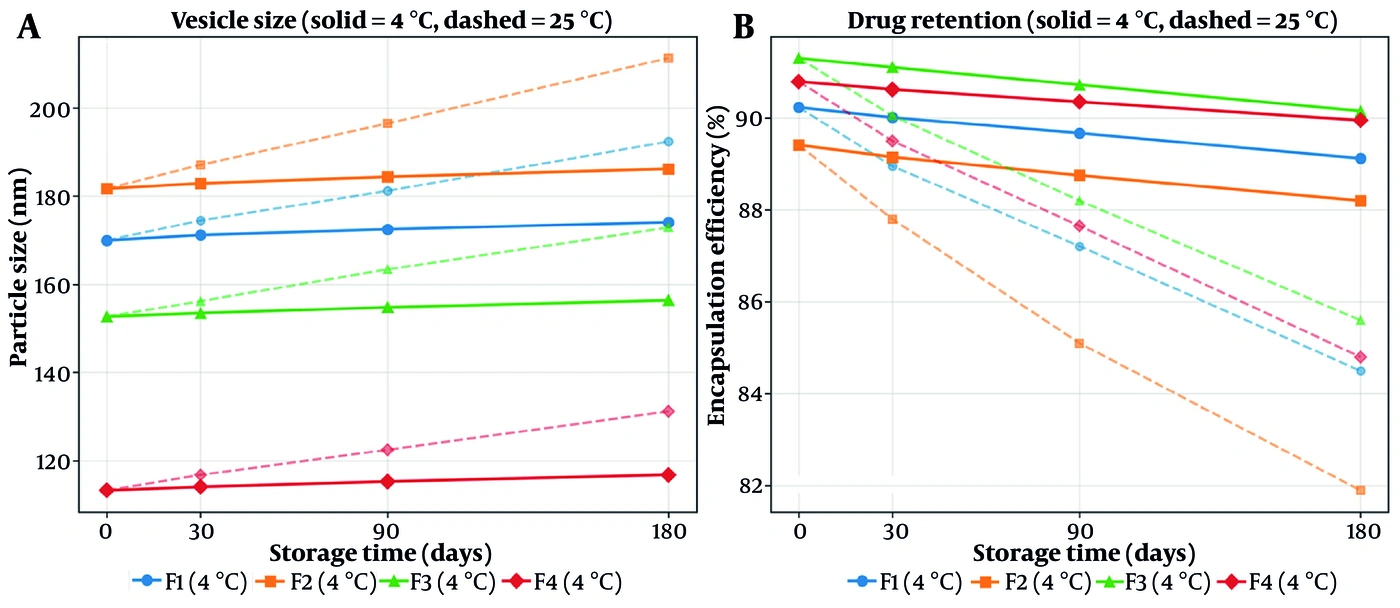
Figure 12.
Physical stability of the four formulations over 180 days: (A) vesicle size and (B) encapsulation efficiency. Solid lines denote refrigerated storage (4 °C) and dashed lines controlled room temperature (25 °C) (n = 3).
Storage at 25 °C produced a markedly different outcome. Curcumin retention after 180 days fell to 92.15 ± 0.14% (F1), 90.43 ± 0.20% (F2), 93.80 ± 0.15% (F3), and 91.50 ± 0.15% (F4), corresponding to losses of 6.2 - 9.6%. The pronounced divergence between the two storage conditions confirms that the assay is genuinely stability-indicating—it detects degradation where degradation occurs—and establishes that refrigerated storage is required for the intended six-month shelf life. It is therefore important to specify that the 99.85% retention achieved by F4 is a property of refrigerated storage and should not be extrapolated to ambient conditions.
The physical stability data (Table 10, Figure 11) reinforce this picture and, importantly, resolve the question raised by the moderate zeta potential of the system. At 4 °C, the lead formulation F4 increased in mean diameter by only 3.1% over 180 days (113.3 → 116.8 nm), its polydispersity index rose only marginally (0.311 → 0.320, remaining well within the near-monodisperse range), its zeta potential was essentially preserved (−18.58 → −17.95 mV), and drug retention fell by less than one percentage point (90.79 → 89.95%). Across all four formulations at 4 °C, the maximum size increase was 3.1%, and the maximum decline in encapsulation efficiency was 1.21 percentage points. At 25 °C, by contrast, vesicle growth reached 13.2 - 16.3%, polydispersity increased substantially (to 0.355 - 0.435), zeta potential decayed toward the isoelectric region, and drug leakage reached 5.7 - 7.5 percentage points—the classical signature of progressive bilayer fluidization, vesicle fusion, and consequent payload loss at the elevated temperature.
5. Discussion
This study provides a systematic, factorial-design-driven characterization of phospholipid liposomes loaded solely with curcumin, demonstrating their capacity to enhance transdermal drug flux across rat skin well beyond that achievable with a free-curcumin control. By restricting the design to the two principal lipid excipients—cholesterol and lecithin—while holding drug loading, hydration medium, and sonication constant, the two-level full factorial design (22) cleanly resolved the independent and interacting contributions of these variables to the critical quality attributes, an advantage unattainable with one-factor-at-a-time experimentation (20).
The particle-size model was the most informative of the three response models and merits close mechanistic interpretation. Lecithin content (X2) was the dominant determinant of vesicle size (coded coefficient +21.42; P < 0.001), whereas cholesterol (X1) exerted a comparatively minor, though statistically significant, size-increasing effect (+6.92; P = 0.012). This ordering is grounded in the colloidal physics of probe sonication. For a fixed acoustic energy input, the total interfacial area that can be generated is finite; as the phospholipid mass increases from 30 to 60 mg, the same sonication energy must be distributed across a larger lipid pool, reducing the energy dissipated per unit lipid mass. Consequently, the bilayer is fragmented to a lesser extent, more lamellae are retained, and larger multilamellar or oligolamellar vesicles persist. Conversely, the lowest-lecithin formulations (F3, F4) receive the highest specific sonication energy per unit lipid, are disrupted most efficiently into small unilamellar vesicles, and therefore exhibit the smallest hydrodynamic sizes. This energy-per-unit-mass argument directly explains the observation that F4 (cholesterol 10 mg, lecithin 30 mg) produced the smallest vesicles in the entire design.
The significant negative cholesterol–lecithin interaction term (−12.75; P < 0.001) is also mechanistically coherent. At low lecithin content, the incremental effect of adding cholesterol on vesicle size is modest because the bilayer is already thin and readily fragmented; at high lecithin content, cholesterol intercalation condenses and rigidifies the expanded bilayer, partially counteracting the size-increasing effect of the additional phospholipid. The interaction therefore reflects the well-established condensing effect of cholesterol on phosphatidylcholine bilayers, whose magnitude is contingent on the phospholipid fraction present (17, 18). The response surface (Figure 2) captures this as a twisted, non-parallel plane rather than a simple additive surface.
The geometry of the fitted response surfaces is diagnostic of the underlying factor interdependence and warrants explicit structural interpretation. For particle size, the significant negative interaction coefficient (−12.75) renders the surface a twisted, saddle-influenced matrix rather than a planar additive sheet: the two edges of the surface corresponding to low and high lecithin are demonstrably non-parallel, and the projected contour map resolves into progressively converging, non-parallel isolines whose spacing contracts as lecithin increases. Such convergence is the two-dimensional signature of a response that is conditional on factor interdependence—the marginal effect of cholesterol on size is small at low lecithin but grows at high lecithin, precisely the behaviour encoded by the interaction term. The zeta-potential surface exhibits this conditionality in its most pronounced form: with the interaction coefficient (−0.72) exceeding both main-effect coefficients in magnitude, the surface adopts a distinctly warped, saddle-like topology in which the direction of steepest change in surface charge itself reverses between the low- and high-cholesterol domains, and no single planar gradient can describe it. By contrast, the encapsulation-efficiency and PDI surfaces, whose interaction terms are negligible, approximate gently inclined, near-parallel-contoured planes—the visual hallmark of additive, non-interacting factor behaviour. Interpreting the surfaces in these structural terms, rather than as colour gradients alone, clarifies which CQAs are governed by lipid co-configuration and which are not.
The encapsulation-efficiency model reveals a compensatory trade-off that is central to formulation selection. Higher cholesterol content modestly increased EE% (+0.33; P = 0.004), consistent with cholesterol-induced bilayer condensation reducing membrane permeability and drug leakage during processing, thereby better retaining the lipophilic curcumin within the bilayer (17). Higher lecithin content, unexpectedly, slightly reduced EE% (−0.61; P < 0.001). This apparent paradox is reconciled by noting that EE% is a fraction rather than an absolute mass: although a larger phospholipid pool offers greater absolute lipid capacity, at fixed drug loading the higher-lecithin formulations also retain more lamellae and a larger aqueous-to-lipid partitioning volume, and the indirect assay is sensitive to the larger dispersed-phase surface area available for re-equilibration of free drug. The net effect is a small but reproducible decline in the encapsulated fraction with increasing lecithin. Importantly, the interaction term was non-significant (P = 0.379), indicating that EE% behaves as an additive function of the two lipids across this design space, which simplifies downstream optimization.
The convergence of these two models defines the favourable region of the design space. The factor settings that minimize vesicle size (low lecithin; Figure 2) coincide with those that preserve high encapsulation (the EE% penalty of low lecithin is only ~0.6 percentage points; Figure 3), such that F4 simultaneously achieves the smallest size and an EE% (90.8%) statistically indistinguishable from the design mean. Thus, there is no meaningful antagonism between the size and encapsulation objectives in this system—a favourable and non-trivial finding, as size–loading trade-offs frequently dominate vesicular formulation.
The zeta-potential behaviour, although statistically modest at the studied replicate level, is mechanistically rich and merits a rigorous biophysical treatment centred on the dominance of the cholesterol–lecithin interaction term. The net negative surface charge shared by all formulations is primarily attributable to the anionic phosphate moieties of the soybean lecithin (phosphatidylcholine) headgroups presented at the vesicle–water interface at physiological pH 7.4. Although phosphatidylcholine is formally zwitterionic, its electrokinetic potential at the hydrodynamic plane of shear is net negative under these conditions, owing to the outward radial orientation of the phosphate relative to the choline moiety, the preferential interfacial adsorption of hydroxyl and buffer counter-ions, and the partial screening of the quaternary ammonium charge by hydration water. This establishes the common electronegative baseline upon which lipid-composition effects are superimposed.
The defining feature of the surface-charge response is that it is governed by the joint configuration of the two lipids rather than by either in isolation, as encoded by the interaction-dominated regression structure. A coherent molecular rationale derives from the packing density of the outer leaflet. When both lipids are simultaneously reduced to their low levels, as in the lead formulation F4 (cholesterol 10 mg, lecithin 30 mg), the outer leaflet is the least sterically congested in the entire design: the lower phospholipid mass reduces lateral molecular crowding, and the diminished cholesterol content relieves the steric and condensing pressure that its rigid sterol nucleus would otherwise impose on the interfacial region. This reduction in structural crowding at the shear plane permits a more uniform, radially outward orientation of the charged phosphate headgroups toward the bulk aqueous phase, rather than the tilted or buried configurations that arise under dense packing. The consequence is a higher effective negative surface-charge density and, in turn, greater intervesicular electrostatic repulsion—consistent with F4 attaining the most negative zeta potential of the series and being significantly more electronegative than the crowded, cholesterol-rich F3 (P = 0.018).
The interaction term therefore has a concrete physical meaning: it captures the fact that the effect of either lipid on surface charge is contingent on the level of the other, because it is their combined contribution to leaflet packing density—not the quantity of either species per se—that dictates headgroup orientation and charge exposure. This is why neither main effect is individually significant while their interaction dominates the model. However, the stability claim must be appropriately calibrated. An absolute zeta potential approaching −19 mV provides a moderate electrostatic barrier that contributes to resistance against vesicle aggregation, flocculation, and premature coalescence, but it does not, by itself, guarantee strong long-term colloidal stability: by widely applied convention, absolute values beyond ± 30 mV are associated with robust electrostatic stabilization, whereas the high-teens-of-millivolts regime observed here denotes adequate-to-moderate stabilization (33, 34). The present system therefore derives its physical stability from a combination of this moderate electrostatic repulsion and the steric-hydration stabilization conferred by the phosphatidylcholine–cholesterol bilayer, a dual mechanism characteristic of neutral-to-weakly-charged phosphatidylcholine vesicles; formal confirmation of shelf stability nonetheless requires the multi-time-point ageing study identified among the study limitations.
The release behaviour reinforces this picture. In every formulation, the Weibull model provided the best description of curcumin release (R2 = 0.972 - 0.988), consistently superior to Higuchi and Korsmeyer–Peppas. The Weibull function is an empirical but mechanistically flexible model that accommodates the combined Fickian-diffusion and bilayer-relaxation processes characteristic of drug egress from heterogeneous phospholipid vesicles (23). The rank order of cumulative release (F4 > F3 > F2 ≈ F1) tracks inversely with lecithin content and bilayer density: the low-lecithin, small, thin-walled vesicles of F4 released fastest and most completely (94.87% at 24 h), whereas the denser, higher-lecithin bilayers of F1 and F2 imposed a more diffusion-restrictive matrix. This provides an internally consistent bridge between the structural (size, lamellarity) and functional (release, flux) response domains.
The transdermal permeation results complete the structure–permeation narrative. Steady-state flux increased monotonically as vesicle size decreased, from 1.14 µg·cm-2·h-1 (F1) to 1.54 µg·cm-2·h-1 (F4), and F4 achieved a 2.45-fold flux enhancement over free curcumin with the shortest lag time (1.21 h) (Table 8). Three complementary mechanisms account for this size-dependent enhancement. First, smaller vesicles present a substantially larger total surface area per unit lipid mass, increasing interfacial contact and lipid-exchange area with the stratum-corneum lamellae (11, 15, 28). Second, the phospholipids of the applied vesicles partition into and fluidize the highly ordered intercellular lipid matrix of the stratum corneum, transiently disordering the barrier and lowering the diffusional resistance to curcumin (11, 15, 27). Third, sub-150 nm vesicles hydrate the corneocyte envelope and may penetrate via intercellular and follicular routes, establishing a drug reservoir within the barrier (16). Although hydration and occlusion contribute to barrier alteration, these mechanisms likely act synergistically and should be interpreted cautiously within ex vivo constraints. These observations align with recent findings on topical liposomal formulations that promote transdermal delivery through localized lipid membrane interaction (35, 36).
Situating these findings within established schools of vesicular and transdermal biophysics both contextualizes and strengthens their interpretation. The size-dependent enhancement of transdermal flux observed here—with the smallest vesicles (F4) delivering the highest steady-state flux—aligns with the sizing paradigm established by Verma, Verma, Blume and Fahr, who demonstrated that vesicle diameter critically governs the depth and efficiency of dermal delivery and that sub-100 - 150 nm vesicles are optimal for penetration into the stratum corneum (28). The underlying determinant of that size—the acoustic scission energy dissipated per unit lipid mass during probe sonication—is consonant with classical size-control principles articulated in the transdermal literature synthesized by Barry, in which the interplay of processing energy and formulation composition dictates the attainable vesicle dimensions and hence the penetration kinetics across the barrier (25, 27).
The mechanistic account of vesicle–skin interaction developed above draws on two complementary and historically influential paradigms. The work of Cevc and colleagues on deformable-vesicle biophysics established that appropriately engineered lipid vesicles can traverse the intercellular lipid route of the stratum corneum under a transepidermal hydration gradient, and that membrane elasticity and the fluidization of barrier lipids are central to permeation enhancement (24, 26); the phospholipid-mediated fluidization of the stratum-corneum lamellae invoked here to explain the flux enhancement of the liposomal formulations over free curcumin is a direct application of this school of thought. In parallel, the vesicle–skin interaction and amphiphile-partitioning models advanced by El Maghraby and co-workers—emphasizing the partitioning of vesicle-derived amphiphiles into the interlamellar spaces of the barrier and the consequent perturbation of its packing—provide the conceptual bridge between our composition-dependent vesicle properties and their differential permeation behaviour (15, 27). Considered together, these frameworks render the observed rank order of flux (F4 > F3 > F2 ≈ F1) not an isolated empirical result but a predictable consequence of established transcutaneous transport biophysics.
Finally, the kinetic modelling of curcumin release is best interpreted through the empirical-distribution paradigm formalized by Papadopoulou and co-workers, who established the Weibull function as a mechanistically flexible descriptor capable of discriminating drug-release behaviour and of accommodating the superposition of Fickian diffusion and matrix-relaxation contributions characteristic of transport through heterogeneous, vesicular systems (23). The uniform superiority of the Weibull fit across all four formulations (R2 = 0.972 - 0.988), together with the composition-dependent modulation of the release rate, is fully concordant with this combined diffusion-and-relaxation transport picture and with the denser, more diffusion-restrictive bilayer expected at higher phospholipid content. The convergence of our surface-charge findings with contemporary quality-by-design zeta-optimization studies of phosphatidylcholine–cholesterol liposomes, which likewise report factorial-model control of electrokinetic potential and adopt the ± 30 mV stability convention, further corroborates both the methodology and the interpretive calibration adopted here (33).
The morphological evidence obtained by scanning electron microscopy (Figure 13) provides independent, orthogonal corroboration of the physicochemical picture assembled from the scattering and encapsulation data. The predominantly spherical geometry and comparatively narrow size range of the imaged vesicles are concordant with the low polydispersity determined by DLS (Table 2), and the complete absence of crystalline drug habits in the field substantiates the inference that curcumin is molecularly dispersed within the bilayer. Although minor particle clustering was observed, this is a well-documented artefact of sample vacuum dehydration and gold sputter-coating rather than intrinsic colloidal instability. The maintenance of dispersion integrity in the hydrated state is supported by the low DLS polydispersity in situ and, decisively, by the six-month stability data demonstrating robust colloidal integrity under refrigerated storage.
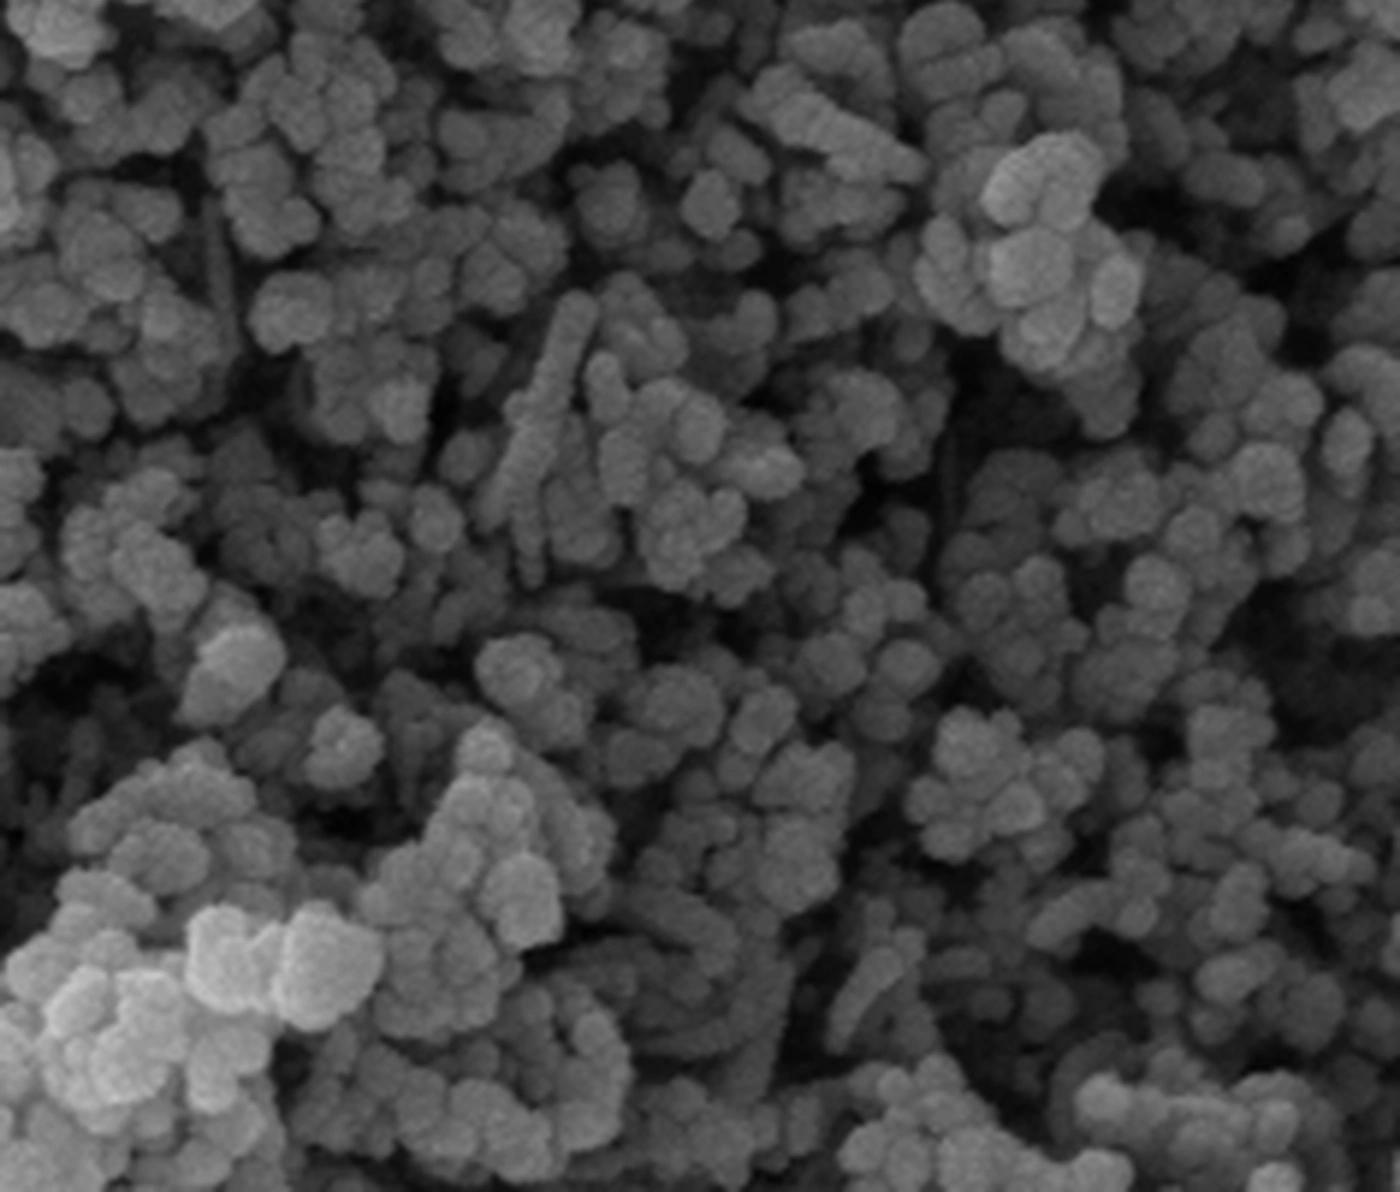
Figure 13.
Scanning electron micrograph of the lead formulation F4, showing discrete vesicular structures of predominantly spherical geometry and comparatively narrow size distribution. The close apposition of the vesicles reflects the dehydration and gold sputter-coating required for specimen preparation (see text). No crystalline drug habits are present in the field.
The stability findings provide direct experimental resolution of the question raised by the moderate surface charge of this system and warrant explicit emphasis. It was argued above, on theoretical grounds, that phosphatidylcholine vesicles are stabilized by a dual mechanism in which moderate electrostatic repulsion is supplemented by a short-range steric-hydration barrier arising from the tightly bound hydration shell of the zwitterionic headgroup, reinforced by the condensing action of cholesterol on the bilayer. The six-month data confirm this prediction empirically. Despite an absolute zeta potential of only ~18 mV—well below the ± 30 mV threshold conventionally associated with electrostatically stabilized colloids—the lead formulation F4 exhibited a size increase of merely 3.1% and a drug loss of under one percentage point over 180 days of refrigerated storage. A dispersion whose sole barrier to aggregation was a moderate electrical double layer could not sustain such colloidal integrity over this period. The ± 30 mV convention is therefore best understood as a criterion for electrostatically stabilized systems specifically, and its application to hydration-stabilized phosphatidylcholine vesicles constitutes a category error. The divergence between the two storage temperatures is equally instructive: the hydration barrier is entropically maintained and the bilayer is more ordered at 4 °C, whereas at 25 °C, increased acyl-chain mobility fluidizes the membrane, lowers the energetic penalty for the deformation preceding fusion, and permits the vesicle growth and payload leakage observed. The finding that F4—the formulation with the most negative zeta potential and the smallest, most highly curved vesicles—was simultaneously the most chemically and physically stable indicates that the low-lipid configuration identified by the factorial screen is favourable not only for permeation but also for shelf stability.
It is important to frame the interpretive limits of a two-level design accurately. Because each factor was studied at only two levels, the fitted surfaces are linear main-effects-plus-interaction models rather than curved response surfaces; they identify directional trends and the sign and magnitude of each effect, but they cannot locate an interior optimum. The identification of F4 as the lead formulation therefore rests on the measured data at the design corners, not on an extrapolated stationary point. Confirmation of any true optimum—for example, whether still lower lipid ratios would further reduce size and increase flux, or whether a size floor exists below which flux plateaus—would require an augmented design incorporating centre and axial points (a central composite or Box–Behnken design). This is a deliberate and appropriate scope boundary for a screening study, not a deficiency.
5.1. Study Limitations
Several limitations of the present work should be acknowledged to frame the interpretation of its findings. First, the permeation evidence is derived exclusively from an ex vivo Franz-cell model using excised rat abdominal skin; although this is a well-validated comparative system, it does not reproduce the dynamic in vivo cutaneous environment, including dermal clearance by the microcirculation, viable-epidermis metabolism, and appendageal transport, and rat skin is intrinsically more permeable than human skin owing to its higher follicular density and thinner stratum corneum. Absolute flux values should therefore be regarded as comparative rather than directly predictive of human performance. Second, definitive in vivo pharmacodynamic validation in an appropriate model of cutaneous inflammation—quantifying the anti-inflammatory and antioxidant efficacy of the lead formulation against a validated endpoint—remains to be undertaken and is the essential next step. Third, although the initial surface charge of the vesicles has been characterized by zeta-potential measurement, confirmation of long-term physical and photochemical storage stability over an extended, multi-time-point ageing study remains to be completed before formulation advancement. Fourth, for practical topical application, the low-viscosity liposomal dispersion would require incorporation into a suitable semisolid vehicle (for example, a hydrogel or emulgel base); the influence of such a base on vesicle integrity, cutaneous residence, and flux warrants dedicated investigation. Finally, the two-level design, by construction, resolves directional main effects and interactions but cannot locate an interior optimum; an augmented response-surface design incorporating centre and axial points would be required to define a formal optimum within the studied factor space.
The scope of the present work was deliberately bounded to a screening objective, and two consequent omissions warrant explicit statement. First, skin-deposition (retention) profiling was not undertaken: the defined endpoint here was transdermal flux—the rate of transfer across the barrier—whereas quantification of the drug reservoir retained within the stratum corneum, viable epidermis, and dermis requires a distinct tape-stripping and tissue-extraction protocol. Because the cutaneous reservoir is a determinant of local anti-inflammatory efficacy, this analysis is appropriately paired with in vivo pharmacodynamic evaluation and is scheduled for the subsequent phase. Second, in vivo pharmacodynamic evaluation was outside the present scope: it was considered methodologically appropriate to establish which lipid configuration governs permeation by means of a compact and statistically rigorous factorial screen before committing to animal-intensive efficacy work. Both studies constitute the defined next stage of this translational programme.
5.2. Conclusions
Two-level full factorial screening of four curcumin-loaded phospholipid liposomal formulations cleanly resolved the roles of cholesterol and lecithin in governing vesicle size, encapsulation efficiency, release, and transdermal permeation. Lecithin content was the dominant determinant of vesicle size, acting through the specific sonication energy dissipated per unit lipid mass, with a significant cholesterol–lecithin interaction; encapsulation efficiency behaved additively and remained uniformly high (> 89%) across the design. The lead formulation, F4 (cholesterol 10 mg, lecithin 30 mg), combined the smallest vesicles with the highest cumulative release (94.87% at 24 h), the highest steady-state transdermal flux (Jss = 1.54 ± 0.19 µg·cm-2·h-1; ERFlux = 2.45), and the shortest lag time (1.21 h). Release was best described by the Weibull model in every formulation.
From a translational standpoint, the 2.45-fold enhancement of ex vivo transdermal curcumin flux and the demonstrated chemical and physical stability over six months of refrigerated storage support the potential of this formulation as a topical delivery system. However, because this study is limited to ex vivo skin permeation and physicochemical characterization, further in vivo pharmacokinetic and pharmacodynamic evaluations remain essential to confirm clinical safety and therapeutic efficacy before definitive clinical conclusions can be drawn.