1. Background
Mucoadhesion is considered as a state in which 2 components are stuck altogether to lengthen the duration of time by interfacial powers (1 component is of biological origin) (1). Among different transmucosal routes, buccal mucosa holds superb accessibility and fair immobility, which makes it an appropriate candidate for the administration of retentive dosage form (2).
Buccal-adhesive system represents some advantages including prevention of the hepatic first-pass metabolism, flexibility, biocompatibility, and fair patient therapy compliance. Besides, the buccal route increases the chance of controlled drug delivery (3).
Adhesion may be comprehended as a procedure characterized by the sorption of an adhesive upon a substrate, and in a different situation as for instance in buccoadhesion, the next interpermeation of adhesive and substrate. These events need liquid-like (viscid) characteristics. In addition, the entirety of the mucoadhesive bond may be confirmed alone when the adhesive obtains mechanical force and time retention (4, 5). Hydrogel adhesives in fact have viscoelastic characteristics and therefore are appropriate for mucoadhesive systems as main materials (6, 7). The interpermeability of the hydrogel and the oromucosa are only probable when the ability to move polymer molecules is very adequate (8). Ionotropic gelation occurs on the basis of the capability of polyelectrolytes for cross-link in the presence of counter ions, therewith making hydrogel pellet, the so-called gel spheres. The hydrogel pellets are formed by pouring a drug-encapsulated polymeric solution within the aqueous solution of polyvalent cations. These cations are distributing into the drug-encapsulated polymeric globules, making a tridimensional lattice of ionotropic cross-linked section (9).
Mefenamic acid (MA) is known to be a component of the anthranilic acid derivatives or fenamate category of nonsteroidal anti-inflammatory drugs (NSAIDs), which reduces edema, ache, and pyrexia most likely via the prevention of cyclooxygenase activity and prostaglandin synthesis (10, 11). Recent studies showed that MA might be applied as a remedial agent in the Alzheimer disease (12, 13).
2. Objectives
The current study intended to develop the MA beads of sodium carboxymethylcellulose (Na CMC) using CaCl2 as a cross-linking agent and to evaluate their encapsulation efficiency, swelling, and drug release behavior.
3. Methods
MA (Cat. No. M4267) and sodium carboxymethylcellulose (Na CMC) (Cat. No. 419273) were purchased from Sigma-Aldrich, USA. Ethanol, acetone, isopropyl alcohol, glycerin, calcium chloride dehydrate, dihydrogen phosphate monobasic, and hydroxide sodium were also purchased from Merck (Darmstadt, Germany).
3.1. Preparation of Mefenamic Acid Hydrogel Beads
The ionic gelation procedure was applied to prepare pellets pursued by a cross-link to CaCl2 with ionotropic gelation method (18). Briefly, 4 mL of acetone and 1 mL of ethanol (O, containing 125, 83.5, and 62.5 mg MA) were poured into 10 mL of aqueous phase for 1 - 2 minutes (W, containing 2.5% (w/v) Na CMC ) and stirred at 200 rpm with a magnetic stirrer. The primary mixture was poured into 100 mL light aqueous solution (W) CaCl2 (20% w/v), stirred at 200 rpm to form a suspension with ionotropic cross-link properties. Several polymer-to-drug ratios (2:1, 3:1, and 4:1) were prepared. The mixture was promptly cooled to 15°C (ice-bath) and afterwards, 50 mL of acetone was poured to dehydrate the globes. The particles were separated by filtration and the pellets were washed with 50 mL isopropyl alcohol (incubated for 24 hours at refrigerator). The beads were permitted to dry at room temperature.
3.2. Determination of Loading Efficiency and Production Yield
The discs were analyzed for the drug loading efficiency by wetting the beads with 0.1 mL glycerin and then, dissolved in 10 mL solvent system (8 mL acetone and 2 mL water) for several hours. The absorbance of the MA solution was measured by ultraviolet (UV) spectrophotometer (UV-160 Shimadzu, Japan) at 357 nm.
The drug loading efficiency was determined using the following equation (18):
Loading efficiency (%) = (actual drug content in beads/theoretical drug content) × 100
The percentage of actual drug content was calculated using the equation A = 0.0182Conc.-0.039, R2 = 0.9992, where A and R2 indicate the absorbance of test solution in the solvent system (acetone and water) and the regression coefficient of calibration curve of MA, respectively. Each determination was made in triplicate.
The production yield was determined using the following equation (18):
Production yield (%) = weight of dried beads/initial weight of the raw materials × 100
The recovery yield of the beads was established by computing the primary weight of the raw substances as well as the final weight of the polymeric particles produced by the primary weight of the raw substances.
3.3. Differential Scanning Colorimetry
3.4. Fourier Transform Infrared Spectroscopy Analysis
FTIR spectra were recorded on physical mixtures and prepared formulations, as well as pure substances using an FTIR spectrophotometer (Bruker, Germany) in the range of 400 - 4000 cm-1, along with potassium bromide discs using 1 metric ton of compressing pressure. The spectrum was a mean of 10 consecutive scans on the same sample (19, 20).
3.5. Flowability Property of Beads
Angle of repose of different formulations was quantified following the constant funnel vertical procedure.
θ = tan-1 h / r
Where θ is the angle of repose, r is the radius, and h is the height.
Bulk and tapped densities were also weighed using 10 mL of scaled cylinder. The bead added in the cylinder was tapped mechanically for 200 times. Next, the tapped volume was recorded and bulk and tapped densities were computed (19).
Compressibility index (Ci) or the Carr index value of beads was calculated based on the following equation:
The Carr index (%) = (tapped density - bulk density) × 100 / tapped density
The Hausner ratio of beads was measured by considering the tapped density to the bulk density utilizing the equation:
The Hausner ratio = tapped density / bulk density
3.6. Physicochemical Properties of Discs
Discs were prepared by directly compressing the drug-polymer bead using a constant press. Every disc included 100 mg of MA beads (with various polymer-to-drug ratios of 2:1, 3:1, and 4:1). The discs were circular and flattened with a mean diameter of 6±0.1 mm pressed with a fixed compaction power (2 metric tons). Hardness of the discs and friability were measured for six discs using hardness tester and friability tester (Erweka, Germany).
3.6.1. Surface pH
A combined glass electrode was utilized in order to measure the surface pH. The discs were first authorized to swell by retaining them touched with phosphate buffer to 5 mL at pH 6.8 for 2 hours in 50 mL containers. The pH was recorded by locating the electrode close to the surface of the bead and authorizing it to equilibrate for 1 minute.
A process of swelling may occur upon the administration of bioadhesive material to a tissue. The swelling rate of mucoadhesive discs was measured by locating the discs in phosphate buffer solution after weighting (W1) at pH 6.8 and 37°C temperature. The disc was taken from the container and excess surface water was cleaned cautiously using the filter paper. The swollen disc was, then, weighed again (W2) and the swelling index was computed using the following equation (20):
Swelling index = (W2- W1)/ W1 × 100
3.6.3. Ex Vivo Buccoadhesion Time
Oral mucosal tissue of sheep was utilized in the current investigation. The current study was conducted according to the Guide for the care and use of laboratory Animals of Tabriz University of Medical Sciences, Tabriz-Iran (national institutes of health publication No 85-23, revised 1985). The chosen beads underwent ex vivo buccoadhesion experiment. The disintegration medium contained 900 mL phosphate buffer at pH 7.4 at 37°C. A buccal piece of sheep, 3 cm length, was adhered to the surface of a lam and straightly hanged to the disintegration instrument (Erweka, Germany) (20). The mucoadhesive discs were swelled from one surface and afterwards were touched with the mucosal tissue.
3.6.4. Permeation Analysis
The ex vivo investigation of MA permeation via the buccal mucosal region of sheep was conducted using a Franz diffusion cell at 37 ± 0.2°C. Freshly supplied sheep tissue was fixed amongst 2 compartments, namely, donor and receptor, with the flat surface of the mucosa facing the donor portion. The discs were put on the mucosal tissue and the portions were fixed with each other. An amount of 3 mL simulated saliva at pH 6.8 (sodium chloride 4.50 g, potassium chloride 0.30 g, sodium sulfate 0.30 g, ammonium acetate 0.40 g, urea 0.20 g, lactic acid 3 g, and water up to 1000 mL) was poured into the donor portion. The receptor compartment was accumulated with 22 - 25 mL phosphate buffer at pH 7.4 and stirred with a magnetic bead at 700 rpm. One milliliter of the sample was taken at certain time intervals and examined for drug content at 231.4 nm (21).
3.6.5. Bioadhesion Strength
A tensile strength as a measure of bioadhesive performance was applied in order to detach the bioadhesive discs from the mucosal surface. The instrument was locally gathered. The device primarily consisted of a 2-armed balance (22), applying the tissue cut from mucosal buccal area of the sheep. The segments of mucosa were kept frozen in phosphate buffer at pH 7.4, and warmed at room temperature to facilitate the application. In the testing time, a section of mucosa was fixed to the superior glass vial (C) by cyanoacrylate glue (E). The vials were balanced and preserved at 37°C for 10 minutes. Then, 1 vial with one segment of mucosa (E) was attached to the balance (A) and another vial was stabilized on top of a pan, weight- (B) and height-modifiable (F). To expose the mucosa to this vial, a steady amount of beads (D) was used. At a steady rate, the weights were added to the pan on the other direction of the adjusted balance of the applied apparatus till the 2 vials were detached (Figure 1). In the course of assessment, 150 µL of phosphate buffer (pH 6.8) was evenly matched onto the surface of the trial membrane. The mucoadhesive strength, called the detachment stress in g/cm2, was also measured using the following equation (23, 24):
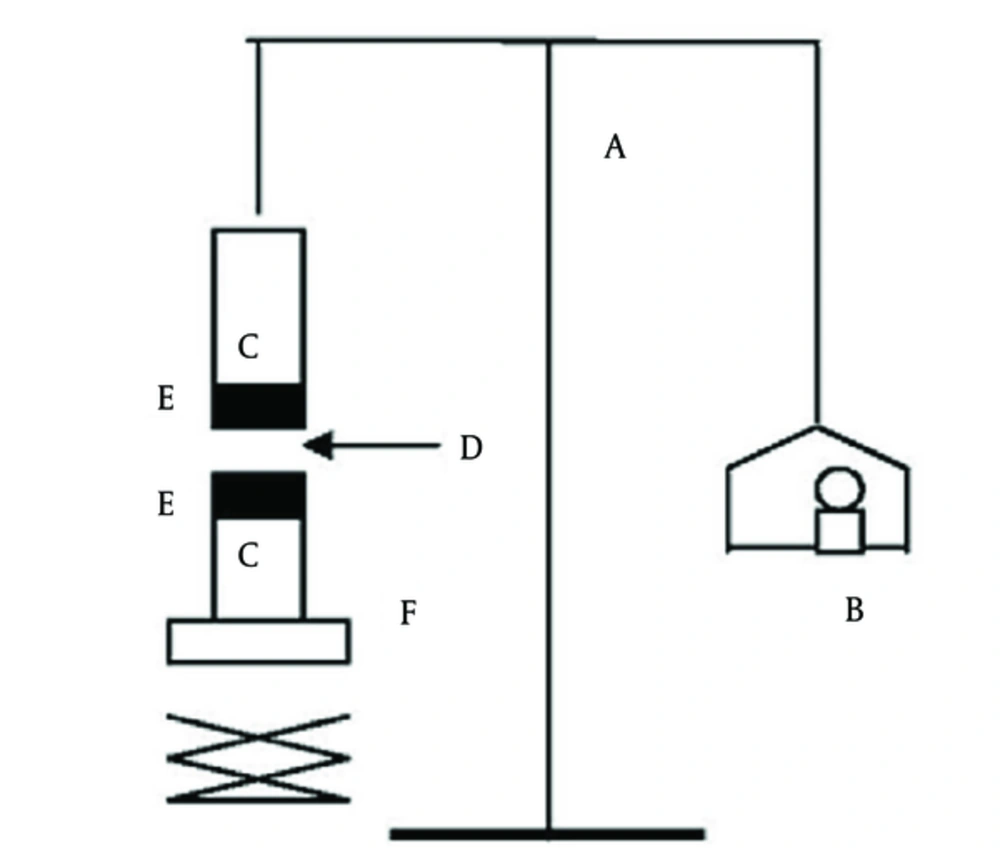
Figure 1.
A, modified balance; B, E, glass vial; C, MH discs; D, buccal side of sheep ; F, weights; G, height‐adjustable pan.
Where m is the weight put to the balance in grams and A is the area of tissue used.
3.6.7. In Vitro Release Studies
For in vitro release investigations, dissolution test instrument type II (USP) rotating paddle procedure was applied (25). For all formulation combinations, the studies were conducted in triple, utilizing 500 mL (37°C, 100 rpm) of isotonic phosphate buffer (pH 6.8) as the dissolution medium. An aliquot of 5mL sample was removed and 5 mL was exchanged with fresh phosphate buffer (pH 6.8). The samples were next detected at 231.4 nm with UV spectrophotometer.
4. Results
4.1. Preparation of MA Loaded Na CMC Microbeads and Discs
MA microbeads were prepared using 20% - 33.33% w/w MA. The cross-link was the result of calcium ions present in the coagulation fluid resulting in the formation of calcium-CMC beads. The microbeads were considered discrete, large, and freely flowing (Figure 2). The mean size of microbeads was in the range of 724.44 - 1905.46 µm (Table 1).
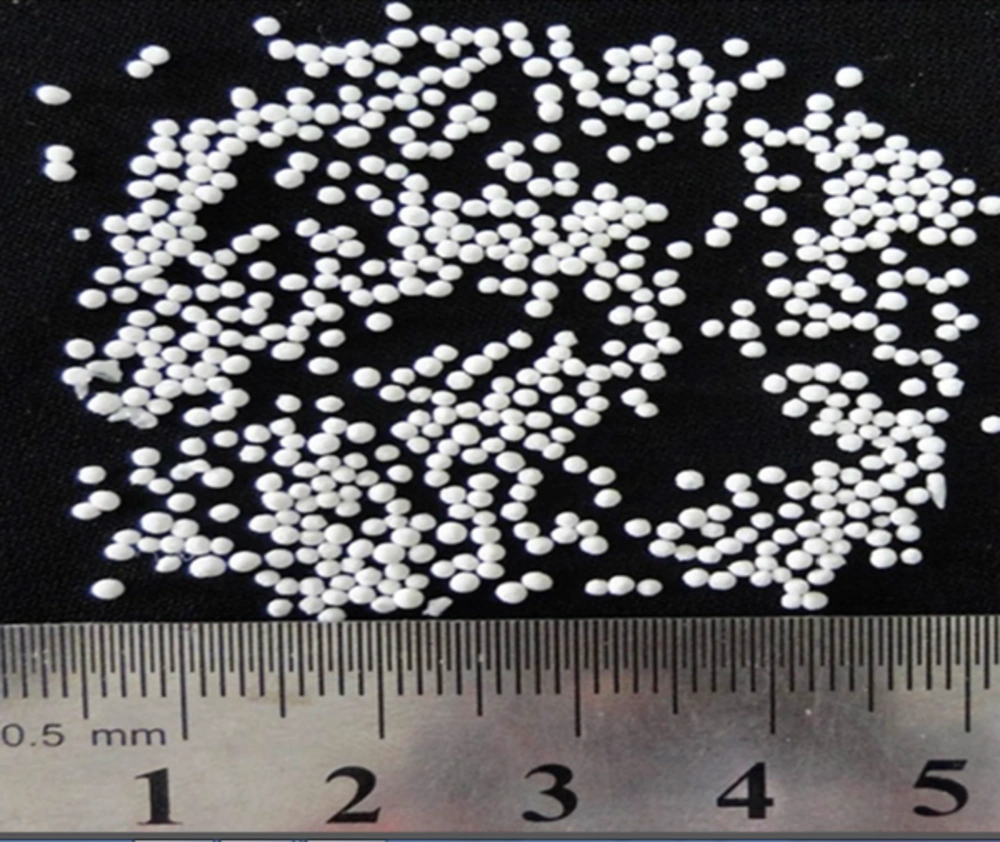
Figure 2.
Optical Microscopic Photograph of Mucoadhesive of MA with Na CMC Microparticles
Table 1.
Effect of Polymer-to-Drug Ratio on Microparticle Formulations and Physicochemical Characteristics of Disc Formulations
| Variable | Formulation Code | |||
|---|---|---|---|---|
| F1 | F2 | F3 | Untreated MA | |
| Polymer: drug ratio | 2:1 | 3:1 | 4:1 | - |
| Production yield, % ± SD | 82.60 ± 10.20 | 86.96 ± 12.32 | 99.30 ± 13.21 | - |
| Theoretical drug entrapped, % | 33.33 | 25.00 | 20.00 | - |
| Mean drug entrapped, % ± SD | 10.98 ± 1.02 | 10.7 ± 1.04 | 9.31 ± 0.86 | - |
| Drug loading efficiency, % ± SD | 33.00 ± 2.36 | 42.80 ± 3.59 | 46.56 ± 4.18 | - |
| Mean particle size, µm ± SD | 724.44 ± 13.24 | 812.83 ± 21.37 | 1905.46 ± 11.75 | - |
| Bulk density, g/cm3 ± SD | 0.310 ± 0.03 | 0.145 ± 0.02 | 0.210 ± 0.02 | 0.680 ± 0.05 |
| Tapped density, g/cm3 ± SD | 0.310 ± 0.02 | 0.153 ± 0.00 | 0.220 ± 0.01 | 0.830 ± 0.01 |
| The Carr index, % ± SD | 0.00 ± 0.00 | 5.20 ± 0.89 | 4.50 ± 0.65 | 18.00 ± 0.93 |
| The Hausner ratio, ± SD | 1.00 ± 0.09 | 1.06 ± 0.04 | 1.05± 0.03 | 1.22 ± 0.04 |
| Angle of repose, °θ ± SD | 3.37 ± 0.12 | 2.86 ± 0.10 | 6.84 ± 0.87 | 60.96 ± 2.14 |
| Weight variation, mg ± SD | 116.2 ± 2.08 | 114.40 ± 2.55 | 106.03 ± 6.83 | - |
| Hardness, N ± SD | 76.23 ± 28.28 | 82.04 ± 36.26 | 105 ± 23.00 | - |
| Friability, % ± SD | 0.10 ± 0.02 | 0.10 ± 04 | 0.10 ± 0.01 | - |
| Content uniformity, % ± SD | 89.23 ± 5.46 | 90.12± 5.52 | 87.52 ± 7.75 | - |
| pH surface, ± SD | 6.44 ± 0.03 | 6.51 ± 0.06 | 6.53 ± 0.07 | - |
| Swelling index, % ± SD | 326.64 ± 54.22 | 552.88 ± 88.93 | 665.32 ± 66.40 | - |
| Mucoadhesive strength, g/cm2 ± SD | 163.33 ± 55.07 | 178.57 ± 36.61 | 308.33 ± 58.79 | - |
| Residence time, min ± SD | > 360 ± 10 | > 360 ± 11.22 | > 360 ± 14.00 | - |
4.2. Characterization of Drug Loaded Na CMC
Drug capacity of the samples was in the range of 10.98% to 46.56% (Table 1). Maximum drug content was observed with the formulation F1 containing 2:1 polymer-to-drug ratio.
Entrapment efficiency (EE) of the microbeads (F3 to F1) prepared using 80%, 75%, and 66.67% Na CMC polymer was 46.56%, 42.80%, and 33%, respectively.
4.3. Swelling Evaluation
Swelling studies were performed in phosphate buffer 0.2 M (pH = 6.8). The microbeads cross-linked with calcium ions showed the highest degree of swelling where 326.64% - 665.32% water sorption was recorded. The highest water sorption capacity was shown by F3 microbeads (Table 1).
4.4. DSC and FTIR Studies
From the overlay of DSC thermograms, it was observed that MA was crystalline in nature (Figure 3). It exhibited a sharp melting endotherm at the temperature of 230 - 231°C. The intension of the MA fusion peak of the microbeads samples was lower than that of the pure drug (the melting peak of drug disappeared with increasing the concentration of Na CMC from F1 to F3).
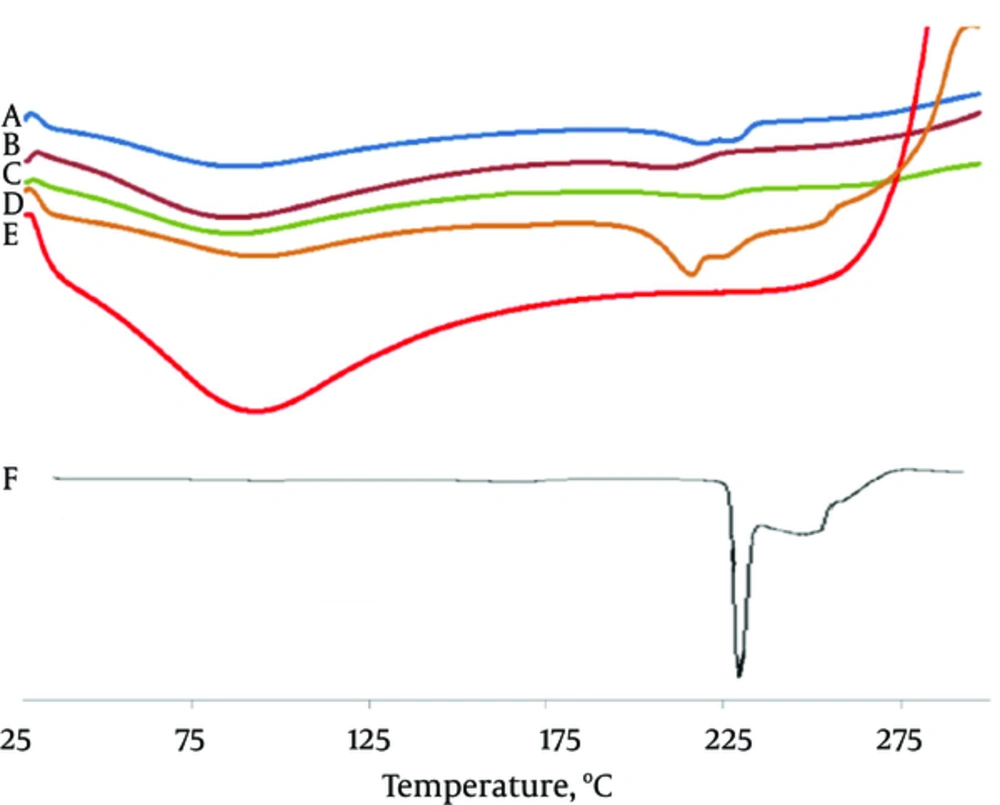
Figure 3.
DSC Thermogram of F1 (A), F2 (B), F3 (C), Physical Mixture F3 (D), Na CMC Polymer (E), and MA (F)
Na CMC showed a wide endotherm peak in the range of 50 - 120°C. It is understood from thermograms that the DSC curves of physical mixtures of drug and polymer as well as the microbeads shifted at lower temperature (216.41°C).
Pure MA has the characteristic of IR peaks at wave lengths stretching vibration N-H at 3310 - 3250 cm-1 and in-plane deformation of N-H peak overlaid at range of 1600 - 1650 cm-1, it is the characteristic of stretching vibration C-H at 1600 cm-1 (Figure 4).
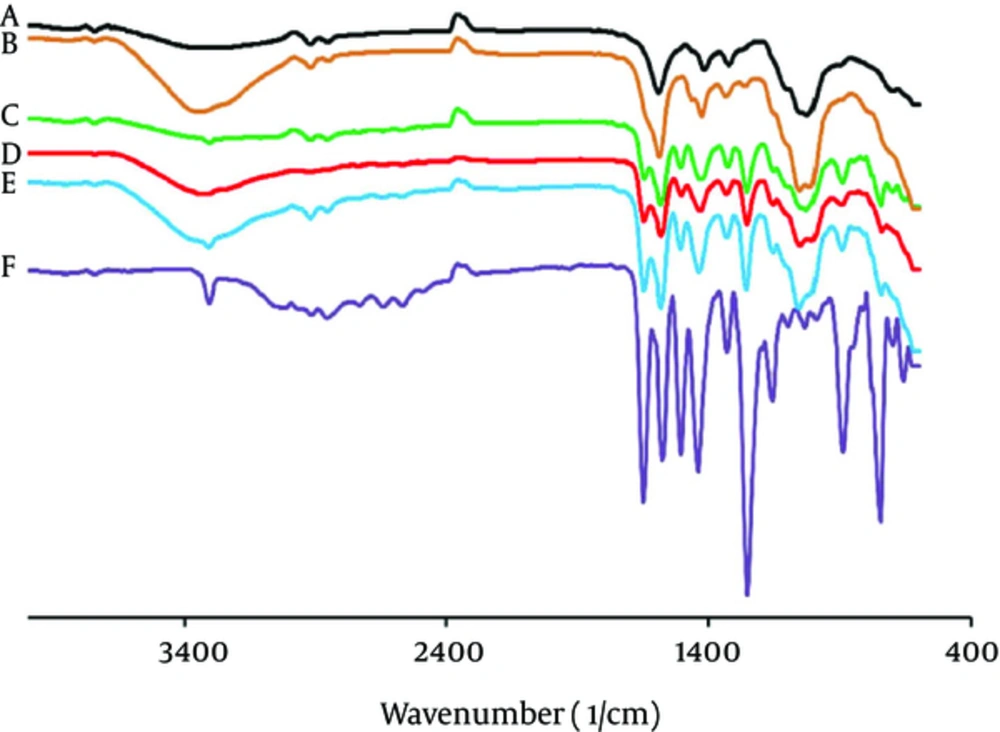
Figure 4.
FTIR Spectra of Na CMC Polymer (A), Physical Mixture F3 (B), F1 (C), F2 (D), F3 (E), and MA (F)
In the FTIR spectra of the Na CMC polymer, there were also stretching bands in view of O-H vibration at 3401 - 3314 cm-1 and stretching vibration bands of aliphatic of C-H at the range of 2907 - 2937 cm-1. Bands at 1604 and 1425 cm-1 in the FTIR spectra can be linked to the symmetric and asymmetric stretching of the carbonyl group, respectively. The stretching vibration band C-O-C was demonstrated at 1030 - 1108 cm-1. For the microbeads, the absorption bands of MA were observed at lower intensity.
4.4. Physicochemical Studies
4.4.1. Flowability Studies
The effect of polymer-to-drug ratio on the flowability properties of microspheres and physicochemical specifications of disc formulations are shown in Table 1.
Table 1 also reported that the flowability shown in terms of the angle of repose and the Carr index in the microspheres developed compared to those of the untreated MA.
The loose bulk density and tapped bulk density were utilized to evaluate the compressibility of the microspheres. The untreated drug was more bulky and smooth shown by the smallest loose bulk density value. In contrast, the microparticles represented higher loose bulk density. The high tapped bulk density value of untreated drug indicated a high inter-space between drug crystals. These results showed good compressibility of the prepared sphere microparticles compared with that of the untreated MA. The Carr index and the Hausner ratio of MA presented very poor flow properties.
4.4.2. Swelling Evaluation
Swelling studies were performed in phosphate buffer 0.2 M (pH = 6.8). Microbeads cross-linked with calcium ions showed the highest degree of swelling where 326.64% - 665.32% water sorption was recorded. The highest water sorption capacity was shown by F3 microbeads (Table 1). It was observed that microspheres including higher concentrations of Na CMC presented higher swelling rates than microspheres comprising low concentrations of polymer (26).
4.4.3. Mucoadhesive Time and Strength Studies
The in vitro residence time with mucosal tissue for microspheres in phosphate buffer (pH 6.8) was more than 360 minutes (Table 1). Microspheres displayed the topmost mucoadesion time in the current research.
The outcomes of in vitro mucoadhesive strength investigation are shown in Table 1. The bioadhesion properties were resulted by the concentration of mucoadhesive polymer (Na CMC). F3 disc containing 4:1 (polymer-to-drug ratio) indicated the highest mucoadhesivity (308.33 ± 58.79 g/cm2).
The integrity of MA discs was lost early, following their rapid uptake. Na CMC polymer includes water-soluble molecules, which allows more water entrance and results in faster dissolution and erosion from mucosal surface. In other words, Na CMC is a hydrophilic polymer and apparently shows a dependency on mucin containing 95% water. This characteristic can be the cause for more lengthy residence time.
In an in vitro buccoadhesion trial carried out by Nakanishi et al. (27), the buccoadhesion strength was related to the hydrogen bond created among the hydroxyl group in the polymer and mucus. It organized an ionic complex with hyaluronic acid that enabled upper binding force. Muccoadhesive force of disc was enhanced because of an increase in the ratio of polymer (28, 29). Hence, F3 beseems that muccoadhesives might swell and extend rapidly when exposed to water. For the hydrophilic polymer, hydration is liable for the adhesion of polymer to the mucosal membrane; as hydration produces these polymeric adhesive and therefore they join the mucous membrane (29, 30).
4.5. In Vitro Drug Release and Permeation
The release of MA from beads was studied in dissolution media (phosphate buffer 0.2 M, pH = 6.8). The drug release from the F3 microbeads (with 66.67% polymer) was higher with 103.74% ± 5.89% of drug released in 8 hours. The drug release increased with the addition of Na CMC ratio to the microbeads matrix (Figure 5).
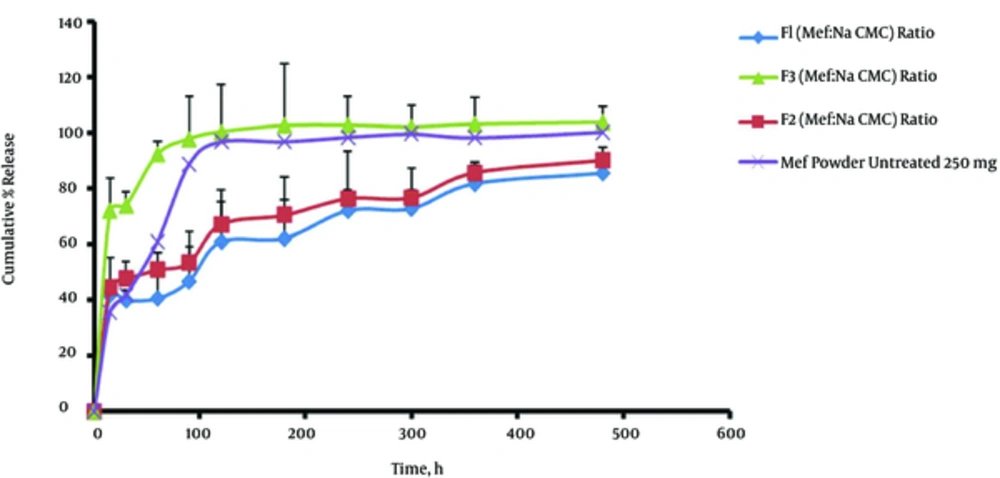
Figure 5.
Cumulative Percent of MA Release from Discs Prepared with Different Polymer-to-Drug Ratios, Untreated MA, and MA Capsule (Commercial)
The prepared formulations (F1, F2, and F3) resulted in better control over the release of MA with 85.52% ± 24.71%, 90.32% ± 27.12%, and 103.74% ± 5.89% of drugs dissolved in 8 hours, respectively (Figure 5 and Table 2). Permeation data of MA of microbeads are represented in Table 2. The data revealed that with the mentioned concentration of Na CMC, the drug permeability increased from 66.67% to 80% mg. It is noteworthy that an increase in the permeation was observed with increasing the concentration of Na CMC (from F1 to F3).
Table 2.
Comparison of Release Characteristics of MA and Untreated MA, Flux, or Amount of Drug Release per Unit Surface Area After 4 Hours
| Formulation | Rel0.25a, % ± SD | Rel8b, % ± SD | DE, ± SD | t 50%c, min ± SD | f1d, ± SD | Fluxe, µg/cm2/min ± SD |
|---|---|---|---|---|---|---|
| F1 | 41.69 ± 11.75 | 85.52 ± 24.71 | 66.22 ± 3.12 | 108.33 ± 8.95 | 27.72 ± 5.67 | 2 ± 0.000 |
| F2 | 44.39 ± 11.03 | 90.32 ± 27.12 | 71.78 ± 4.20 | 98.53 ± 7.89 | 22.54 ± 4.58 | 2.4 ± 0.000 |
| F3 | 72.06 ± 3.65 | 103.74 ± 5.89 | 97.76 ± 7.84 | 27.68 ± 3.24 | 16.16 ± 2.31 | 2.8 ± 0.000 |
| Untreated MA | 35.53 ± 17.48 | 100.43 ± 8.83 | 89.48 ± 6.54 | 52.32 ± 2.14 | 21.47 ± 4.78 | - |
Abbreviation: DE, Dissolution Efficiency.
aRel0.25, amount of drug release after 0.25 hours.
bRel8, amount of drug release after 8 hours.
ct 50%, dissolution time for 50% fractions.
df1, Differential factor.
eFlux was obtained from regression analysis between the amount of drug release per unit surface area and time.
Statistical analyses of data were carried out by evaluating the DE (dissolution efficiency), t50% (dissolution time for 50% fractions of drug), and the difference factor (Table 2). F1 showed a lower dissolution efficiency of 66.22%. F3 had a higher DE (97.76%) in comparison with those of the F2 (71.78%) and F1 (66.22%) microbeads and MA powder (89.48%) (Table 2) (P < 0.05). The F3 microbeads showed a higher drug permeation capability (2.8 µg/cm2.minute) compared to F1 and F2 microbeads (2 and 2.4 µg/cm2.minute, respectively) (Table 2). The data revealed that with the concentration of Na CMC, the drug permeability increased from 2 to 2.8 µg/cm2.minute. It is noteworthy that an increase in the permeation was observed with increasing the concentration of Na CMC, from F1 (66.67%) to F3 (80%).
5. Discussion
By increasing the concentration of polymer (Na CMC), the mean size of microbeads increased up to 1905.46 ± 11.75 µm. The enhancement in the mean size of beads with increasing the percent of Na CMC polymer (66.67% - 80% w/w) from F1 to F3 could be related to an increase in the viscosity of the polymeric dispersions, which eventually led to the formation of larger size of microbeads (27).
The formation of the rough surface was probably owing to the higher concentration of drug homogeneously distributed at molecular level in the matrices (28). Surface morphology also characterized possible deposits of the crystalline matter of drug on the microbeads surface.
High viscosity and prompt solidification of the dispersed phase was involved in reducing the porosity of the microbeads as well (25). The contribution of a high polymer concentration to the loading efficiency can be interpreted in different ways. For example, in higher concentration, rapid precipitation of polymer occurs on the surface of the dispersed phase and drug diffusion prevention occurs across the phase boundary (26, 27), which creates microbeads with large sizes.
The swelling ratio of formulation prepared using high polymer concentration was 665.32% ± 66.40% in 2 hours. There is high water insertion into inter-chain entanglements due to near lattice structure of hydrogel, which leads to the microbeads with very high swellable properties (28, 29).
The microbeads showed maximum swelling within 30 minutes and then a gradual but slow change was observed in the swelling pattern. This initial high rate of swelling can be ascribed to the hydrophilic character of the polymer applied, which hydrates rapidly in contact with the phosphate buffer.
Hydroxyl and carboxylmethyl groups present in Na CMC form hydrogen bonds with water molecules on hydration, form a more swellable lattice composition (31, 32). The water soluble hydrophilic polymers such as Na CMC hydrate rapidly and create pores. These pores are filled with the solvent, which distributes within the microbeads and thus accelerates the erosion of the gel layer (33).
The most probable reason for the appearance of slightly shifted broad endothermic peak and exothermic peak is the melting and crystallization of adsorbed MA present on the microbeads surface. Furthermore, it may result from the inter-macromolecular ionized bonds between Na CMC and calcium ions sequences (Figure 3) (34). In the microbeads, MA peak was disappeared indicating the possibility of conversion of drug into the amorphous form. The drug molecules might have been entirely dispersed in the polymer matrix. According to the literature, decrease in the crystallinity and amorphization of the drug exhibits more solubility. For microbeads, the absorption bands of MA are observed at lower intensity (Figure 3) (32).
At buccal pH, the ionization of the carboxyl group on MA was approved, guiding to the enhanced swelling of microbeads and reduced mechanical hardship of the CMC matrix due to the erosion, which speeds up the drug release (35). Addition of Na CMC polymer increased the drug release from F1 to F3. However, in the case of F1 microbeads, the drug release was lesser (85.52%) than that of the F3 microbeads (103.74%). Na CMC as a polymer indicates poor release prolonged result owing to the presence of wide amount of hydroxyl groups, which guides to extremely swollen matrix and causes loose gel layer formation, pursued by erosion, if reportedly due to the weakening of the CMC hydrogel matrix (33). During dissolution, the formulations prepared using Na CMC as a polymer were swelled making a gel layer on the represented surface of microbeads. The weakly bound polymer molecules in these microbeads were easily eroded, permitting the simple and quicker release of MA (36). The difference factor displayed that the microbeads formulations do not like the release profile of untreated MA (f1 = 16.16 - 27.72) (Table 2).