
1. Background
Wound healing is a dynamic and well-orchestrated process to restore the integrity of the skin after injury, which includes a series of molecular and cellular events that begin immediately after an injury occurs to the skin. Skin wound healing can be divided into four overlapping phases, including hemostasis, inflammation, proliferation, and remodeling (1). Hypertrophic Scars (HTS) are the consequences of the aberration of normal wound healing. They affect the patient’s quality of life, both physically and psychologically, because they are painful and pruritic and cause significant functional and cosmetic problems. Clinically, HTS is identified by extravagant skin fibroplasia and scar formation due to the disproportion between the production and degradation of collagen during wound healing (2). The exact pathogenesis of HTS is not clear yet. The overexpression of collagen type I and fibronectin has been found in HST tissue (3, 4). Several studies also revealed the lower levels of MMP1 in HTS tissue than in normal tissue. The stimulation of MMP1 expression and suppression of collagen production could be new therapeutic approaches for the prevention and treatment of abnormal scarring following trauma and burn injuries (3, 5, 6).
Numerous methods have been developed for the treatment of hypertrophic scars, but no standard therapeutic method has been established to date. Some treatments that are advocated for hypertrophic scars include topical and intralesional corticosteroids, Silicone gel sheeting, pressure therapy, surgical excision, laser therapy, and onion extract (1). The acceleration of wound healing, inhibition of inflammation, and modulation of extracellular matrix (ECM) turnover are effective strategies to reduce scar formation (1).
Medicinal plants have been used in the treatment of abnormal scars throughout the world. Scrophularia striata (Scrophulariaceae family) is an important Iranian medicinal plant. In Iranian folk medicine, it has been used for the treatment of inflammatory and infectious diseases such as conjunctivitis, gastritis, otitis, and vaginitis. Particularly, it is well known in the western parts of Iran for its burn wound healing properties. The aqueous extract of aerial parts of S. striata can accelerate wound healing and reduce hypertrophic scar formation following second and third-degree burn injuries. The phytochemical analysis of S. striata extract revealed the presence of cinnamic acid, quercetin, isorhamnetin-3-O-rutinoside, nepitrin, and acteoside (7). The antioxidant (8, 9), anticancer (10), antibacterial (11), antifungal (12), anti-inflammatory (13), antiasthmatic (14), anti-parasitic (15), neuroprotective (8, 16), anxiolytic, and antidepressant (17) effects of this plant have been shown in different studies. The healing effects of S. striata have been evaluated in animal models of excisional wounds and burns (18-20).
2. Objectives
This study aimed to conduct an in vitro evaluation of the anti-scarring properties of S. striata hydroalcoholic extract (SSE). To this purpose, we investigated the effects of SSE on the expression of mRNA and proteins of MMP1, MMP8, collagen type I, and fibronectin in human skin fibroblasts. In addition, the effect of SSE on total collagen content produced by human skin fibroblasts was also evaluated in fibroblast cell culture.
3. Methods
3.1. Plant Material
The S. striata plant was collected in the western parts of Iran (Ilam Province). The plant species was identified by Prof. Shahrokh Kazempour Osaloo, Department of Plant Biology, Tarbiat Modares University, Tehran, Iran. The aerial parts of the plant were dried at room temperature, ground into powders.
3.2. Extraction Procedure
For extraction, 500 g of dried powder was extracted with hydroalcohol (30/70) in a soxhlet apparatus at a temperature not exceeding 60°C. The extract was concentrated in a rotary evaporator to yield a crude semi-solid mass. The resultant extract was then dried using a freeze dryer (Alph-1 2LD plus, Germany) for 24 h. The dry extract was stored at 4°C until further use.
3.3. Cell Culture
Human skin fibroblast (HSF) cells were used in this study. The cells were obtained from the National Cell Bank of Iran (Pasteur Institute, Iran). Dulbecco’s Modified Eagle’s Medium (DMEM, Invitrogen LT, Merelbeke, Belgium) supplemented with 10% fetal bovine serum (FBS, Invitrogen LT, Merelbeke, Belgium), 1% penicillin (Gibco, Germany), and 1% streptomycin (Gibco, Germany) was used as the culture medium.
3.4. Quantitative Real-Time Polymerase Chain Reaction (Q-PCR)
To determine the effect of the plant extract on ECM components’ (MMP1, MMP8, collagen type I, and fibronectin) gene expression, HSF cells were cultured and treated with the plant extract (100, 200, and 400 µg/mL) for 48 h. The total RNA was extracted from treated and control cells using the RiboEX total RNA reagent (GeneAll Biotechnology Co.). After RNA extraction, the synthesis of cDNA was done using PrimeScript First Strand cDNA Synthesis Kit (Takara, Japan), followed by PCR. The SYBR Green real-time PCR master mix kit (BioFact, Korea) was used to perform q-RT-PCR. The analysis of data from q-RT-PCR experiments was performed using the 2-ΔΔCT method. The primers used in this study are listed in Table 1.
Table 1.
Primers Used for Real-Time PCR Analysis
| Forward Primer Sequence (5’ → 3’) | Reverse Primer Sequence (5’ → 3’) | |
|---|---|---|
| MMP1 | TCAGGGGAGATCATCGGGAC | GTTCATGAGCTGCAACACGATG |
| PPM8 | ACCAACACCTCCGCAAATTACAAC | TCTTGGTCCAGTAGGTTGGATAG |
| Collagen I | ATGATGGGGAAGCTGGAAAAC | CAAACCACTGAAACCTCTGTGT |
| Fibronectin | ACTCTGTCAACGAAGGCTTGAAC | ACCACTTCCAAAGCCTAAGCAC |
| β-actin | AGAGCTACGAGCTGCCTGAC | AGCACTGTGTTGGCGTACAG |
3.5. Western Blot
The HSF cells were cultured and treated with the plant extract (100, 200, and 400 µg/mL) for 48 h. The whole-cell proteins were extracted. The Bradford assay kit was used to quantify the protein levels of whole-cell extract. The protein lysate was separated by polyacrylamide gels and transferred to PVDF (polyvinylidene difluoride) membrane (Millipore, Billerica, MA, USA) at 4°C. Membranes were probed for fibronectin, MMP1, MMP8, and collagen type I using rabbit anti fibronectin (Santa Cruz, USA), rabbit anti-MMP1 (Santa Cruz, USA), rabbit anti-MMP8 (Santa Cruz, USA), and mouse anti-collagen type I (Santa Cruz, USA), respectively. The blots were washed with TBST and incubated with horseradish peroxidase (HRP)-conjugated goat anti-rabbit Ab (Santa Cruz, USA) and HRP-conjugated goat anti-mouse Ab (Santa Cruz, USA). The ECL (enhanced chemiluminescence) method was used to detect protein immunoblots.
3.6. Total Collagen Assay
The effect of SSE on the soluble collagen level in the fibroblast conditioned medium was evaluated using Sirius Red collagen detection kit (Chondrex, USA). Sirius Red is a convenient method for the measurement of total collagen in tissue specimens, cell culture media, and cultured cells. The HSF cells were treated with different concentrations of SSE (100, 200, and 400 µg/mL) and incubated for 48 h. In the control group, cells received no treatment. The total collagen content of cultured HSF cells was determined according to the kit manufacturer’s instructions.
3.7. Statistical Analyses
Statistical analyses were performed using the one-way Analysis of Variance (ANOVA) with the Tukey test. Data are expressed as mean ± SEM. The P values of less than 0.05 were considered statistically significant. The data were analyzed using GraphPad Prism software.
4. Results
4.1. Gene Expression of MMP1, MMP8, Collagen Type I, and Fibronectin
The effects of SSE on mRNA expression of MMP1, MMP8, collagen type I, and fibronectin were evaluated, and the results indicated that fibronectin mRNA expression was significantly lower in cells treated with SSE (200 and 400 µg/mL) than in untreated cells. The mRNA expression of MMP1 was significantly higher in HSF cells treated with SSE (200 and 400 µg/mL) than in untreated cells. The mRNA levels of MMP8 and collagen type I were not significantly different between SSE-treated and untreated cells (Figure 1).
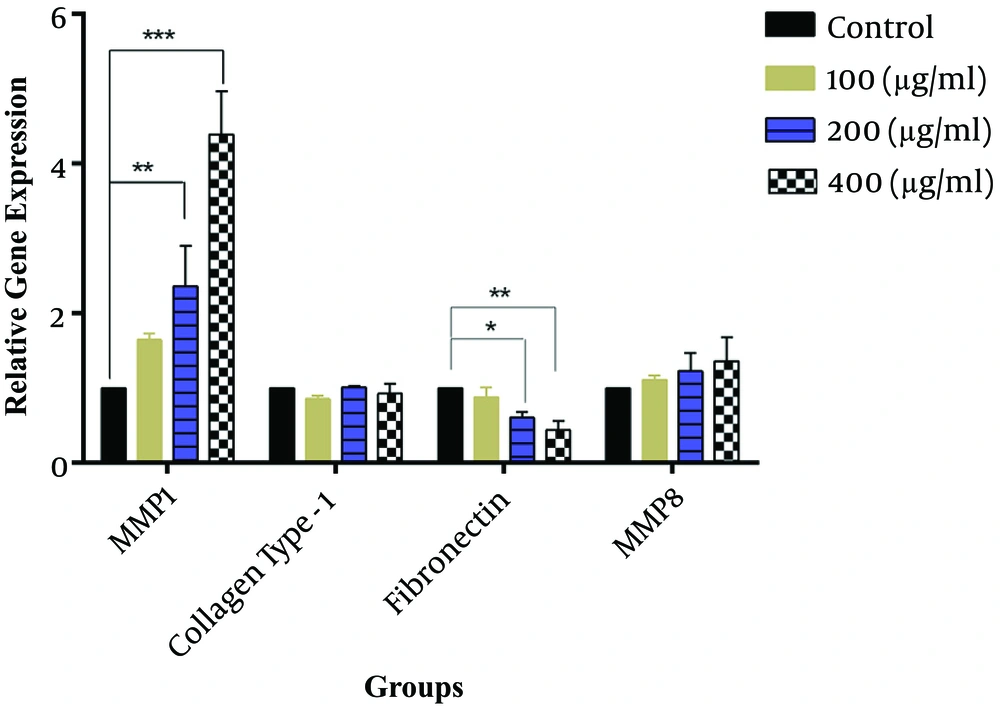
Figure 1.
The effects of SSE on mRNA expression of MMP1, collagen type I, fibronectin, and MMP8. Data (the ratio of measured protein to β-actin) are expressed as mean ± SEM. Values significantly different from the control group are indicated as *, P < 0.05; **, P < 0.01; and ***, P < 0.001; SSE, Scrophularia striata extract. β-actin was used as a protein loading control.
4.2. Western Blot
The effect of different concentrations of SSE (100, 200, and 400 µg/mL) on the expression of ECM components (fibronectin and collagen type I) and two important ECM degrading enzymes (MMP1 and MMP8) was evaluated using the Western blotting method. The cells were harvested after 24 and 48 hours of treatment. The results are shown in Figures 2-6. Based on results, SSE significantly suppressed the production of fibronectin (Figure 2), but it did not have any significant effect on collagen type I expression (Figure 3). As shown in Figure 4, SSE (100, 200, and 400 µg/mL) significantly enhanced the MMP1 expression as compared to non-treated cells. The expression of MMP8 was not significantly affected by treating with SSE (Figure 5).
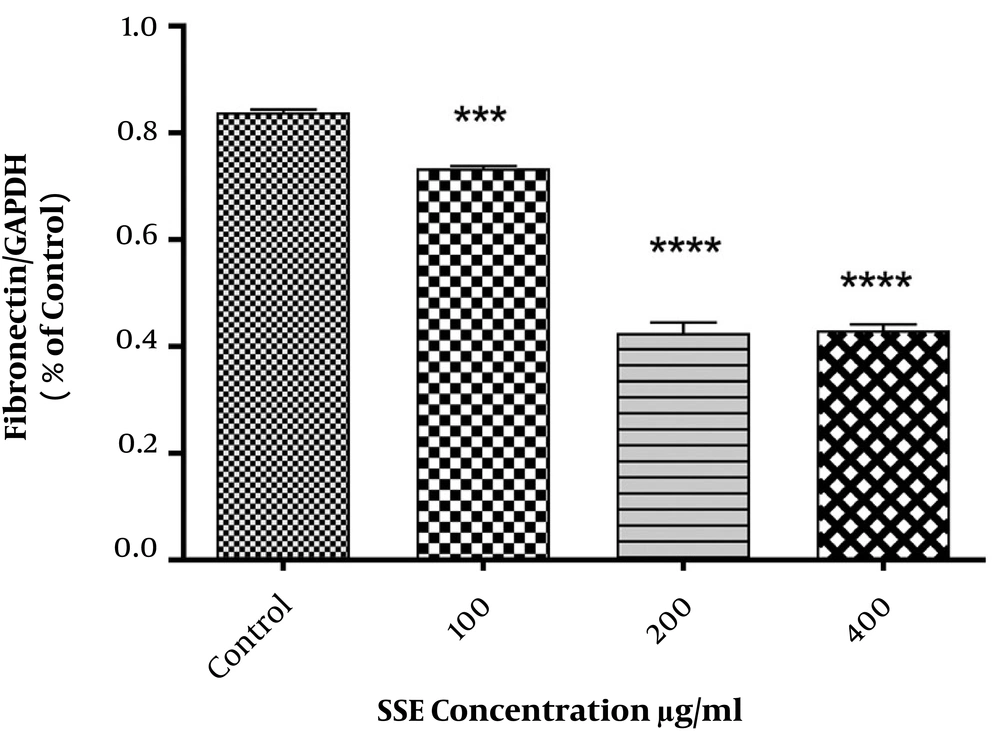
Figure 2.
The effects of SSE on the expression of fibronectin at the protein level using western blotting. Data (the ratio of measured protein to GAPDH) are expressed as mean ± SEM. Values significantly different from the control group are indicated as ***, P < 0.001; and ****, P < 0.0001; SSE, Scrophularia striata extract. GAPDH was used as a protein loading control.
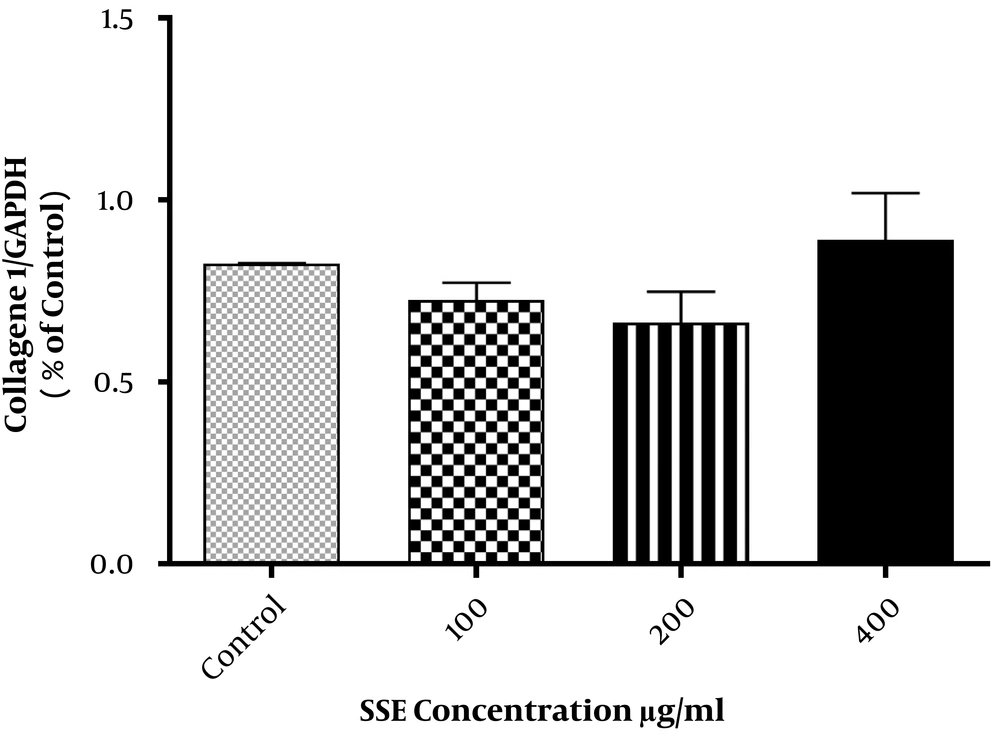
Figure 3.
The effects of SSE on the expression of collagen type I at the protein level using western blotting. Data (the ratio of measured protein to GAPDH) are expressed as mean ± SEM; SSE, Scrophularia striata extract. GAPDH was used as a protein loading control.
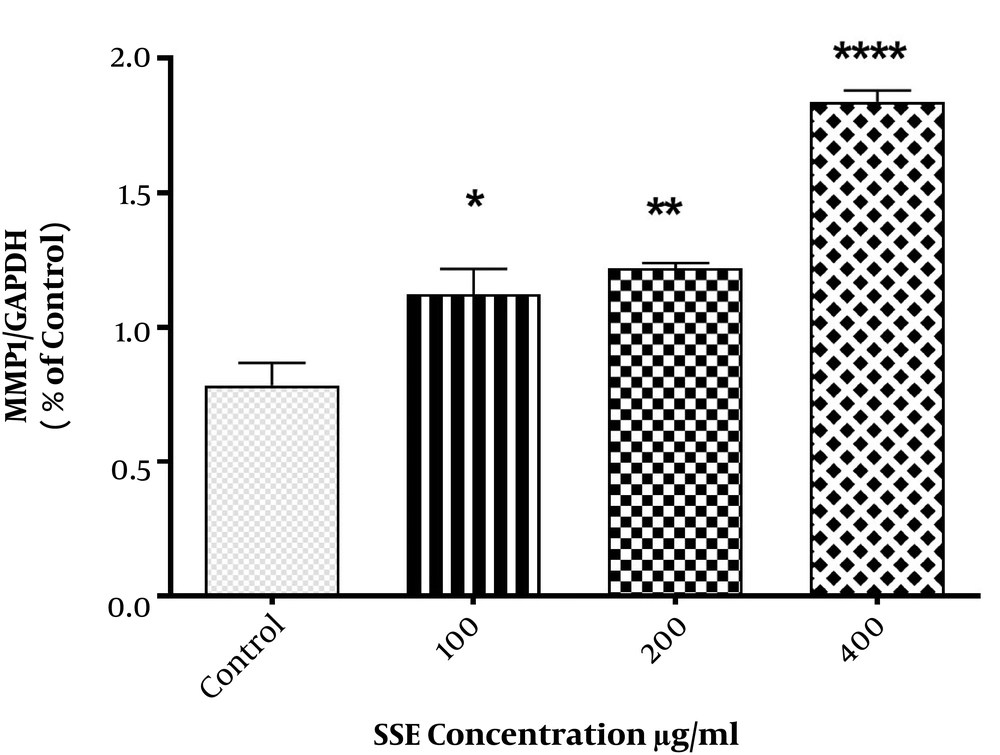
Figure 4.
The effects of SSE on the expression of MMP1 at the protein level using western blotting. Data (the ratio of measured protein to GAPDH) are expressed as mean ± SEM. Values significantly different from the control group e indicated as *, P < 0.05; **, P < 0.01; and ***, P < 0.001; SSE, Scrophularia striata extract. GAPDH was used as a protein loading control.
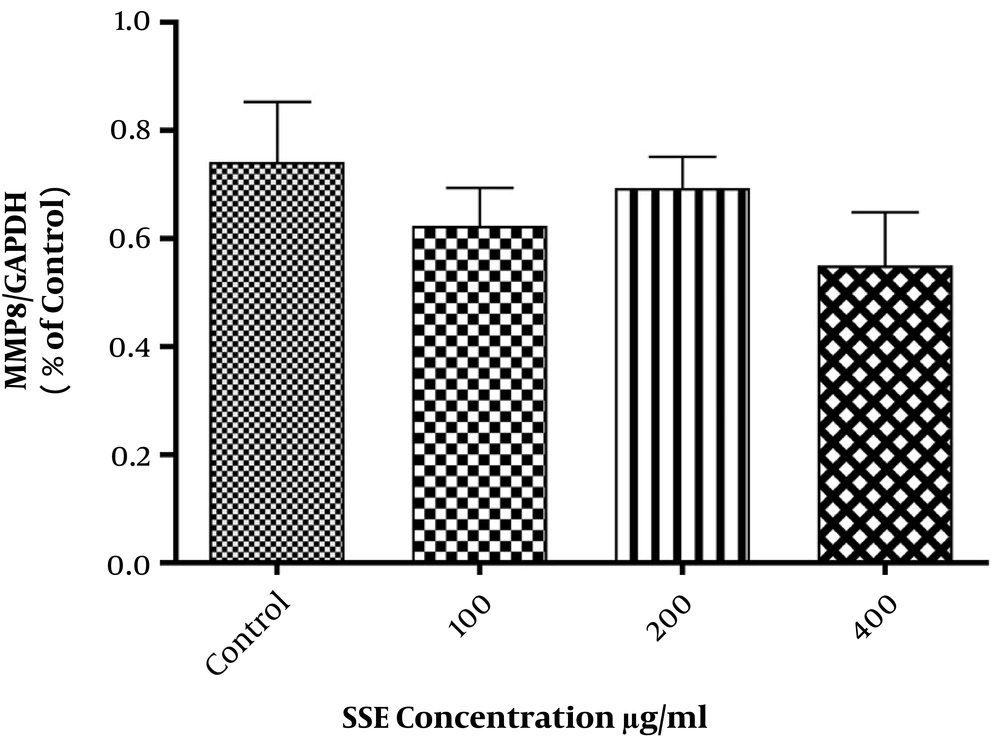
Figure 5.
The effects of SSE on the expression of MMP8 at the protein level using western blotting. Data (the ratio of measured protein to GAPDH) are expressed as mean ± SEM. SSE, Scrophularia striata extract. GAPDH was used as a protein loading control.
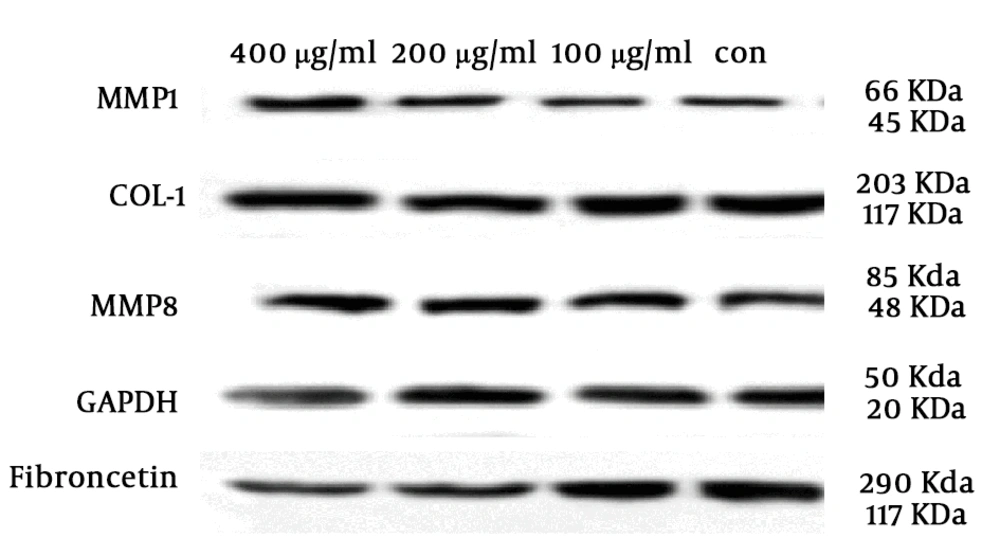
Figure 6.
The effects of SSE on MMP1, collagen type I, MMP8, and fibronectin at the protein levels using western blotting. GAPDH was used as a protein loading control.
4.3. Total Collagen
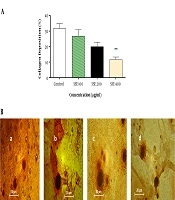
The effect of SSE on the soluble collagen level in cell culture medium was evaluated using the Sirius Red assay, and the results showed that the soluble collagen level was significantly lower in cells treated with SSE (400 µg/mL) than in the control group (Figure 7).
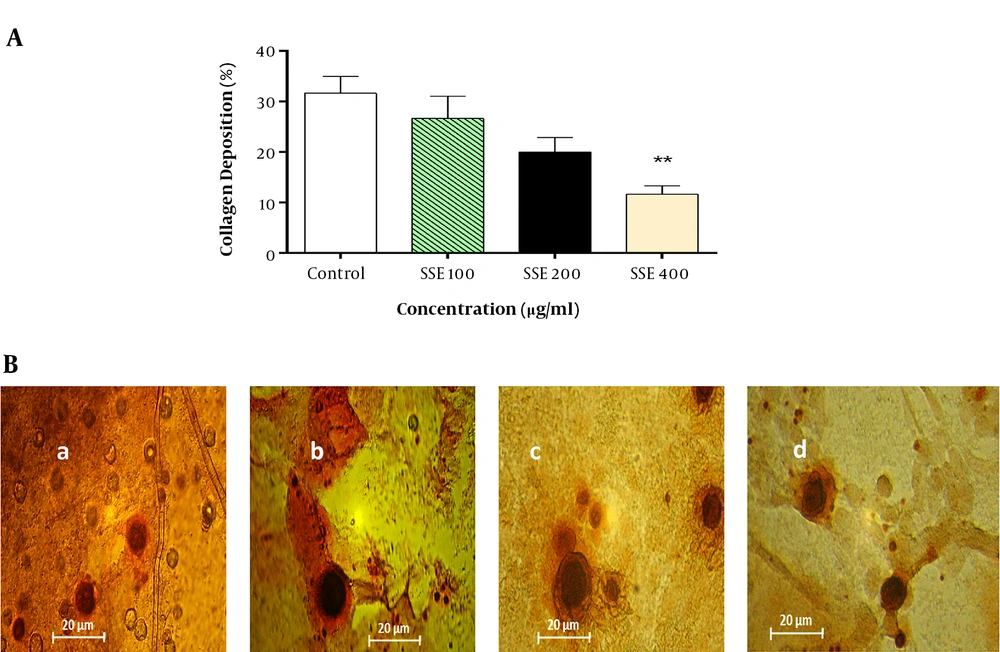
Figure 7.
The effect of SSE on collagen deposition. A, Quantitative analysis of collagen deposition in different experimental groups. Data are expressed as mean ± SEM. Values significantly different from the control group are indicated as **, P < 0.01; B, representative micrograph of fibroblast lysate stained with Sirius Red showing collagen depositions in experimental groups (a, control; b, group treated with SSE 100 µg/mL; c, group treated with SSE 200 µg/mL; and d, group treated with SSE 400 µg/mL).
5. Discussion
Hypertrophic scars are the results of the aberration of normal wound healing that develop following traumatic or thermal injuries to deep regions of the skin, compromising functions, and esthetics (21). The ECM composition in scarring tissue is different from those of normal tissue. Indeed, excessive production of ECM molecules leads to fibrosis. The modulation of ECM components is a therapeutic approach to avoid hypertrophic scars. In Iranian traditional medicine, S. striata is used for the treatment of burn injuries with satisfactory outcomes. Previous studies have shown the wound healing activity of S. striata (18-20). In this study, we evaluated the effects of SSE on the expression of ECM components (collagen type I, fibronectin, MMP1, and MMP8). Collagens are the most abundant proteins in ECM. Excessive production of collagens during the wound healing process is the main characteristic of HTS. The results of our study indicated that SSE had no significant effects on the expression (neither mRNA nor protein levels) of collagen type I, but it significantly suppressed the total collagen content of cultured HSF. Fibrillar collagen, as the most important structural component of ECM, has a key role in both strength and elasticity of normal skin and scar tissue. Both normal and hypertrophic scars are the results of the deposition of collagens, although collagen synthesis in HSs is two to three times as much as that of normal scars (2, 22). Besides, SSE significantly suppressed the mRNA gene expression and protein production of fibronectin. Previous studies showed that the expression of fibronectin increased in HTS and keloid compared to normal tissue (4, 23-25). Fibronectin is a key glycoprotein in wound repair and plays a critical role in cell proliferation and adhesion. In addition, it attracts fibroblasts to the wound site and induces their differentiation to myofibroblasts. However, the overexpression of fibronectin is associated with abnormal scarring. The suppression of fibronectin mRNA and protein expression is an important strategy for the prevention of HTS. In this study, the results indicated that SSE not only suppressed total collagen and fibronectin production but also increased the rate of ECM degradation via the enhancement of MMP1 expression. As is known, MMPs are important enzymes responsible for the degradation of collagen and other ECM molecules. MMP1, MMP8 and MMP13 are the enzymes responsible for initiation of collagen type I, II and III degradation. The degradation of collagen is a very important process in tissue remodeling and repair. The decreased expression of MMP1 in HTS has been shown in previous studies (1, 6). The role of MMP8 in hypertrophic scars remains unknown although some studies suggest that MMP8 attenuates scar formation (26, 27). In this study, we showed that SSE had no significant effect on MMP8 expression.
Previous studies have shown the anti-inflammatory, antioxidant, and wound-healing properties of the hydroalcoholic extract of S. striata (28-30). Based on these findings, we examined the effect of the hydroalcoholic extract of S. striata on the modulation of ECM in vitro. Phenolic compounds, flavonoids, and phenylpropanoids were identified from SSE (7, 31). Quercetin is a flavonoid isolated from SSE (7). Cho et al. (32) found that quercetin induces the expression of MMP1 in human skin fibroblasts and hairless mice, implying that quercetin plays a role in anti-fibrotic processes. However, further studies are needed to identify which compound(s) is/are specifically responsible for the anti-scarring effects of S. striata extract.
5.1. Conclusions
In conclusion, the results of our study revealed the anti-scarring potential of S. striata hydroalcoholic extract in vitro. Besides, SSE could modulate the ECM components via interference with MMP1 and fibronectin expression. Moreover, SSE suppressed the collagen content in cultured HSF. According to our results, SSE could be a suitable candidate for the prevention of HTS formation following trauma and burn injuries. However, further studies are needed to verify our findings.