


1. Background
2. Objectives
3. Methods
3.1. Animal Models
3.2. Necropsy and Tissue Sampling
3.3. Histological Analysis
3.4. Histochemical Examinations of Testicular Tissue
3.5. Evaluation of Malondialdehyde
3.6. Evaluation of Total Antioxidant Capacity
3.7. Caspase 3&7 Activity
3.8. Statistical Analysis
4. Results
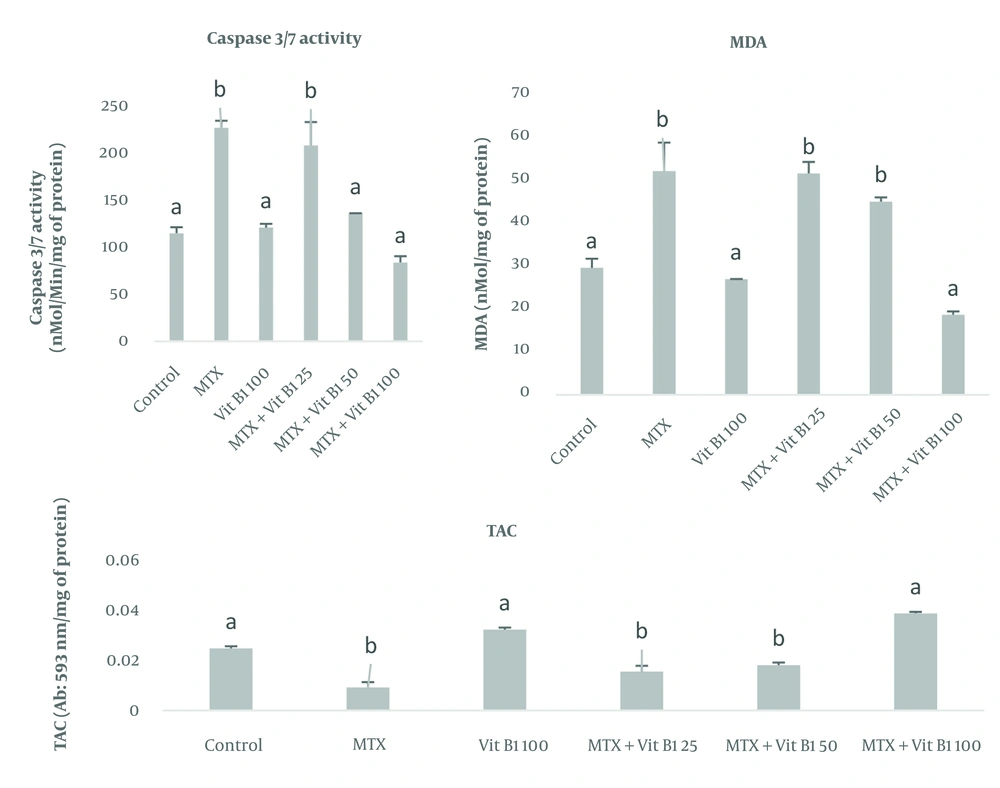
Evaluation of the caspase 3&7, MDA, total antioxidant capacity (TAC) activity of the testicular tissue. Dissimilar letters indicate significant differences between groups (P ≤ 0.05).
4.1. Histomorphometric Results
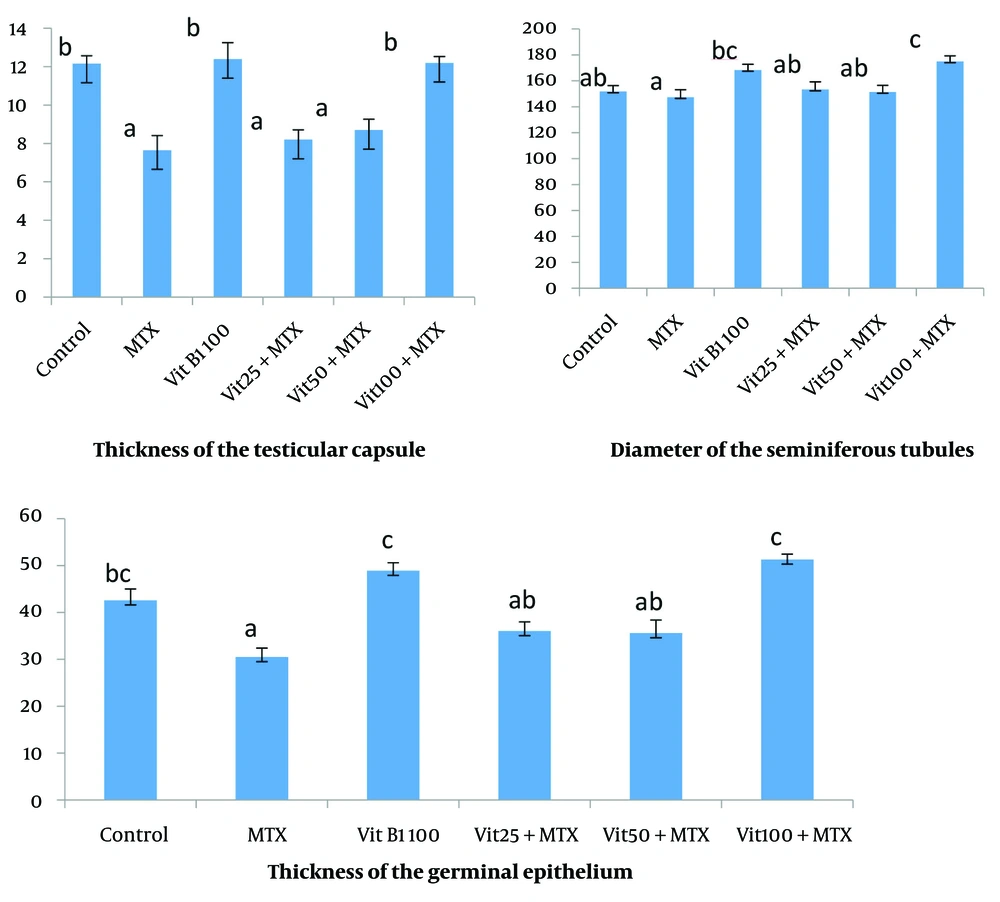
Evaluation of the thickness of the testicular capsule, the diameter of the seminiferous tubules and the thickness of the germinal epithelium. Dissimilar letters indicate significant differences between groups (P ≤ 0.05).
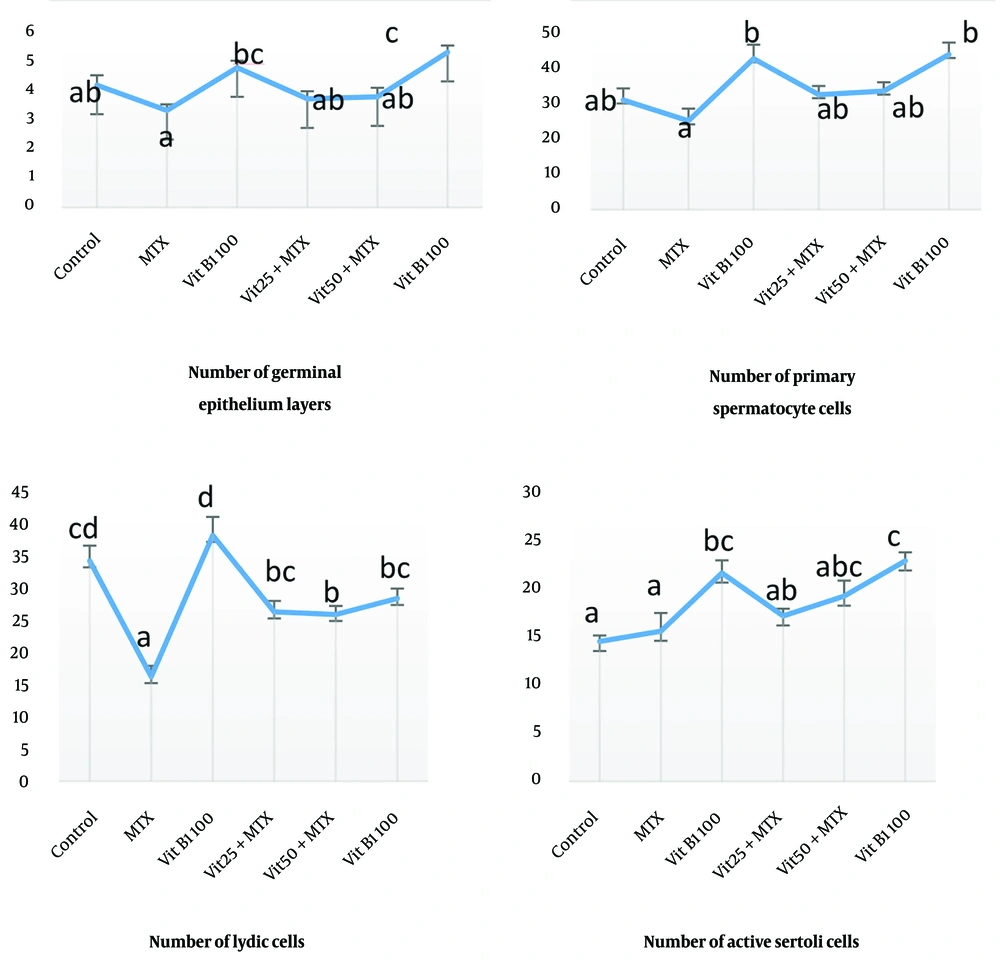
Examining the average number of germinal epithelium layers, primary spermatocyte, Leydig cells, and active Sertoli cells. Dissimilar letters indicate significant differences between groups (P ≤ 0.05).
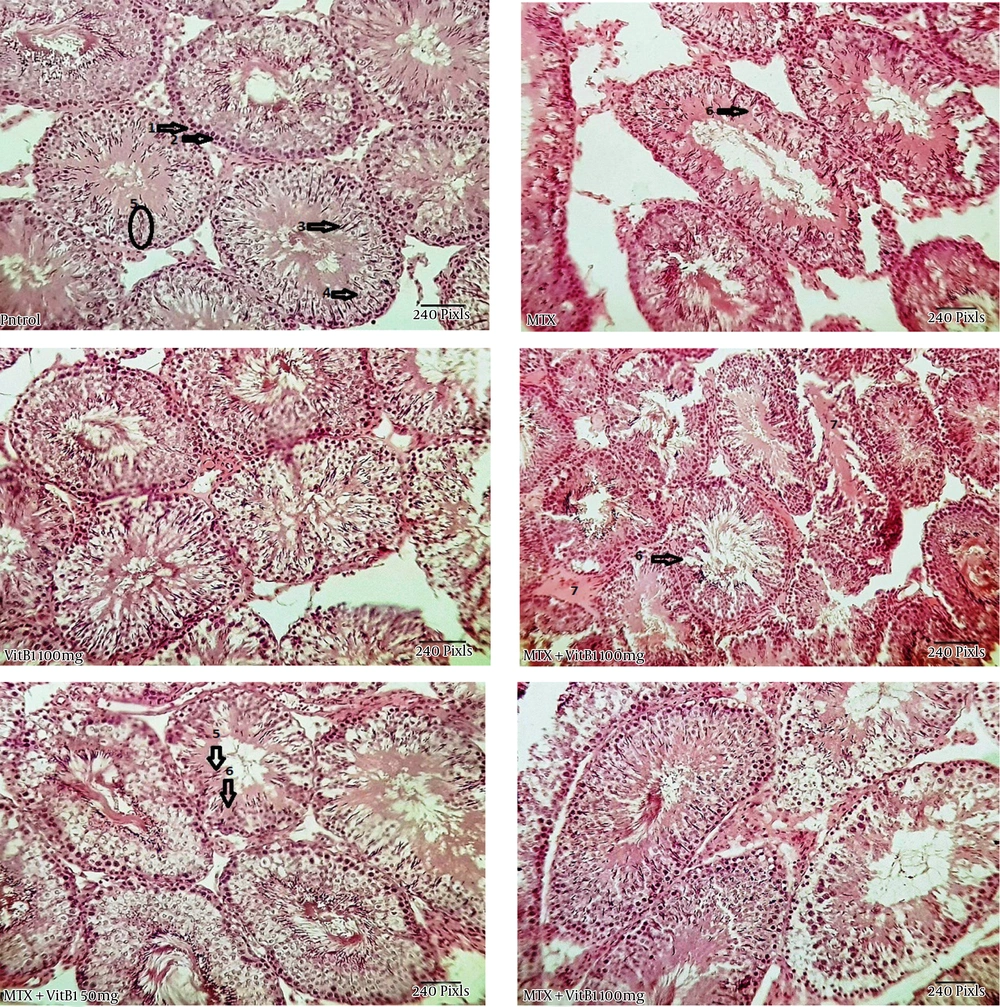
Study of histomorphometric changes in testicular tissue. Control, healthy group; MTX, methotrexate receiving group, indicated the lower epithelium thickness and germinal epithelium disjunction, VitB1 100 mg/kg; Positive control group, receiving only VitB1, the same as the control group, MTX/VitB1/25 mg/kg, MTX/VitB1/50 mg/kg, MTX/VitB1/100 mg/kg groups, show amelioration VitB1 dose-dependent. Hematoxylin and eosin staining, magnification ×100. (1) Spermatogonia, (2) primary spermatocyte, (3) spermatozoid, (4) spermatid, (5) accumulation of sperm on apical region of Sertoli cell, indicating the active Sertoli cell, (6) germinal epithelium disjunction, and (7) edema.
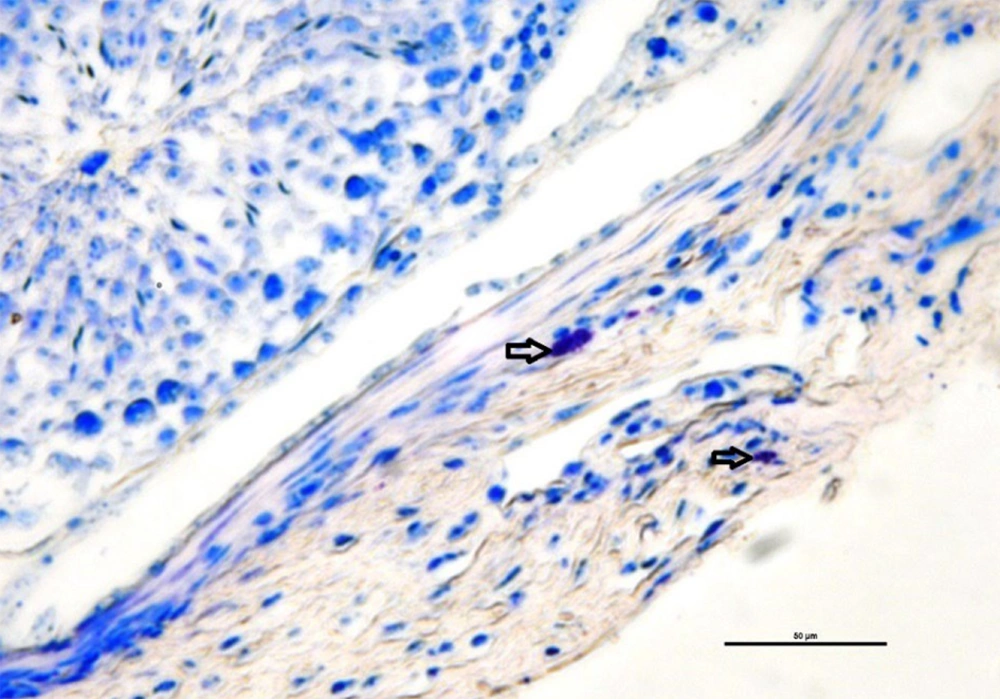
Mast cells in the testicular capsule (arrows). They have a large number of reddish-purple granules in their cytoplasm. Toluidine blue staining method.
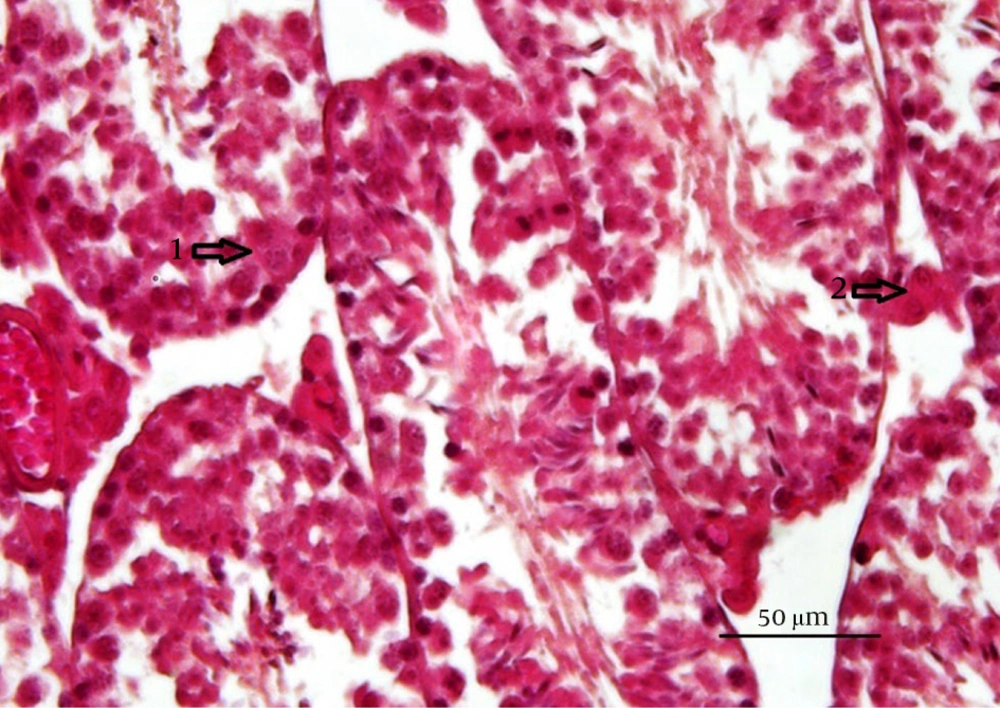
Periodic acid-Schiff (PAS) reaction in the cytoplasm of the (1) spermatogenic cells and (2) leydig cells for detecting the carbohydrate, including foci (PAS staining method).
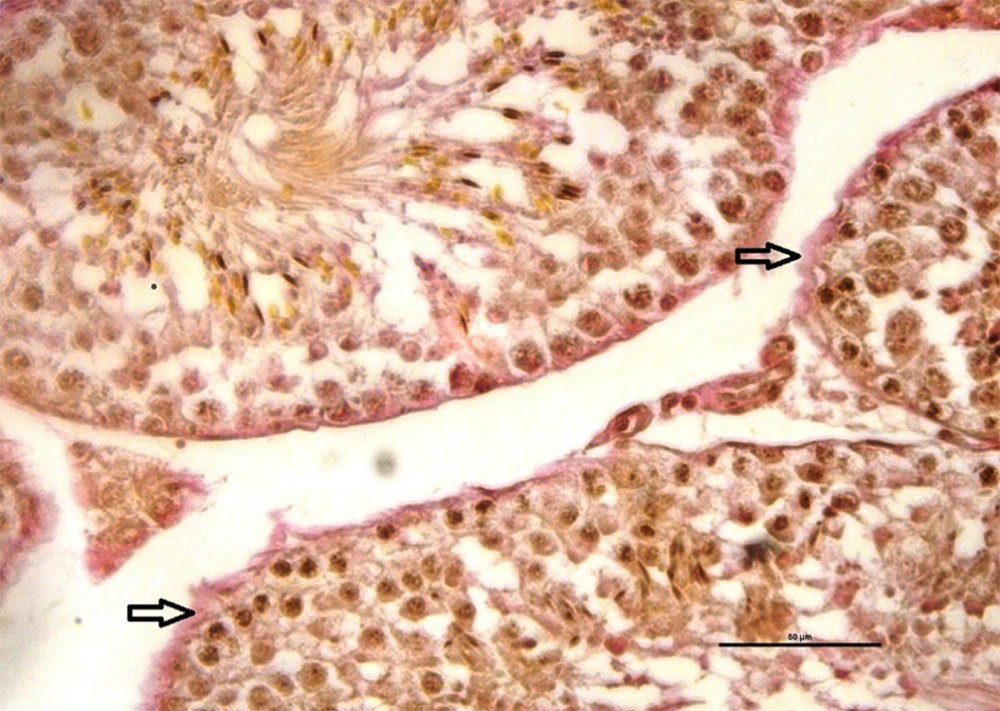
Collagen fibers in red (arrows) are indicated around the seminiferous tubules (Van Geisson staining method).
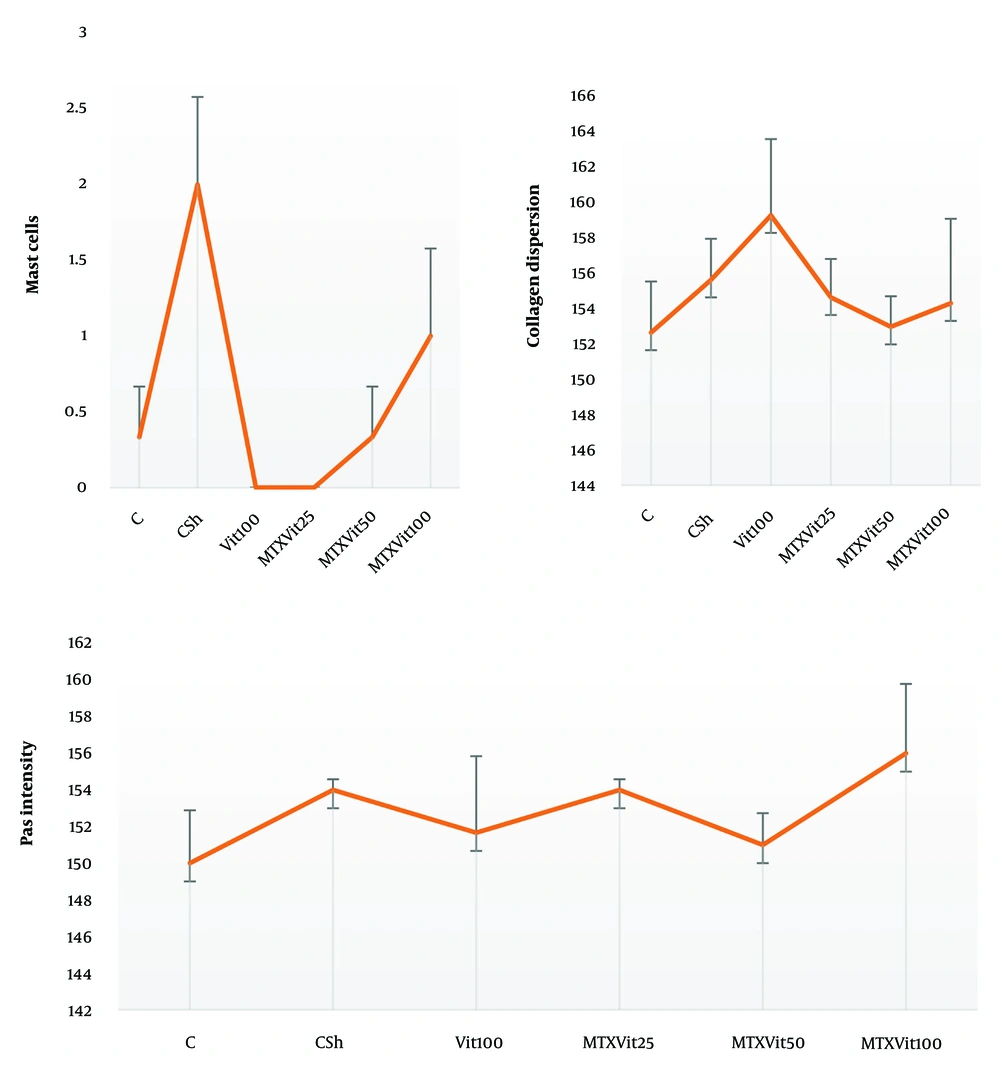
Investigating the average number of mast cells and quantitatively investigating collagen dispersion in testicular tissue shows a high number of mast cells and more dispersion of collagen fibers in the MTX group (csh). However, quantitative investigation of periodic acid-Schiff (PAS) intensity indicates no difference in violet between groups. Dissimilar letters indicate significant differences between groups (P ≤ 0.05).
4.2. Spermatogenesis Examination
| Groups | RI | SI | TDI |
|---|---|---|---|
| Control | 89.2 ± 3.56 A, B | 94.6 ± 1.69 B | 71 ± 1.9 B, C |
| MTX | 83.38 ± 4.05 A, B | 73.52 ± 6.1 A | 66.5 ± 3.37 A, B, C |
| Vit100 | 94.83 ± 2.26 C, B | 97.26 ± 0.38 B | 68.1 ± 1.1 B, C |
| Vit25 + MTX | 77.42 ± 6.45 A | 89.15 ± 4.38 A, B | 53.37 ± 3.9 A |
| Vit50 + MTX | 82.96 ± 4.17 A, B | 92.86 ± 1.33 A, B | 61.2 ± 1.73 A, B |
| Vit100 + MTX | 88.5 ± 2.17 A, B | 97.6 ± 0.33 B | 75.16 ± 1.28 C |
Abbreviations: RI, Repopulation Index; SI, Spermiogenesis Index; TDI, Tubular Differentiation Index; MTX, methotrexate.
a Dissimilar letters indicate significant differences between groups (P ≤ 0.05).
| Groups | Johnsen Score Index |
|---|---|
| Control | 9.65 ± 0.24 A |
| MTX | 4.29 ± 0.11 B |
| VitB1 | 9.72 ± 0.17 A |
| MTX + VitB125 | 4.77 ± 0.20 B |
| MTX + VitB150 | 5.09 ± 0.38 B |
| MTX + VitB1 100 | 7.61 ± 0.19 C |
Abbreviation: MTX, methotrexate.
a Values are expressed as mean ± SE.
b Capital letters indicate significant difference (P < 0.05) between the studied groups.


