
1. Background
Characterized by recurrent upper airway collapse during sleep, obstructive sleep apnea (OSA) is a highly prevalent disorder, leading to chronic intermittent hypoxia (CIH) and sleep fragmentation (1). It is a major public health concern, serving as an independent risk factor for systemic hypertension, coronary artery disease, heart failure, stroke, and type 2 diabetes mellitus (2, 3). The pathophysiology of OSA involves more than just mechanical obstruction and are primarily driven by the systemic effects of CIH-reoxygenation cycles, which trigger oxidative stress and inflammatory pathways (4, 5).
During the reoxygenation phase, CIH generates an excessive production of reactive oxygen species (ROS), particularly the superoxide anion (O₂•-), within the mitochondrial electron transport chain (6). By inducing a profound imbalance between pro-oxidant and antioxidant forces, the cyclic hypoxia-reoxygenation pattern activates inflammatory cascades and leading to increased expression of tumor necrosis factors, interleukins (IL-2, IL-4, IL-6), and lipid peroxidation markers (5, 7). These cycles, in addition, trigger gut microbiota dysbiosis and sympathetic activation, establishing a vicious cycle of secondary oxidative stress and systemic inflammation that underpin OSA-related complications (7, 8).
In healthy states, the mitochondrial antioxidant enzyme manganese superoxide dismutase 2 (SOD2) is the primary defense against this insult catalyzing the dismutation of superoxide into hydrogen peroxide and oxygen at its primary site of generation (9). The efficiency of this enzymatic activity is vital for preventing oxidative damage and preventing the activation of deleterious pathways. A common single-nucleotide polymorphism (SNP) in the SOD2 gene (rs4880, c.47T>C) results in an amino acid substitution at position 16 of the mitochondrial targeting sequence: Valine (Val) to alanine (Ala) (10). This polymorphism is a well-characterized functional variant. The Ala variant is associated with 30 - 40% higher mitochondrial SOD2 activity than the Val variant (11), because their protein is efficiently imported into mitochondria. It is shown that the Ala variant maintains a stable α-helical structure, while the Val variant rapidly loses this structure (10). This import defect causes the Val-SOD2 precursor to become partially arrested within the inner mitochondrial membrane, which leads to a four-fold reduction in levels of mature, active protein in the matrix compared to the Ala variant (12). Furthermore, the Val allele is associated with decreased mRNA stability, further reducing the pool of protein available for import (12). This deficiency has significant clinical implications, as the SOD2 Val16Ala polymorphism has been associated with increased risk for various oxidative-stress-related conditions, including type 2 diabetes, hypertension, and coronary artery disease (13-16).
The role of mitochondrial oxidative stress in OSA-related morbidity suggests that this functional polymorphism could be a key modifier of disease severity. Evidence shows that even partial deficiency of SOD2 significantly exacerbates CIH-induced pathological outcomes. In experimental models, heterozygous SOD2 deletion worsened lung inflammation, vascular remodeling, and pulmonary hypertension by promoting mitochondrial ROS accumulation and activating the NLRP3 inflammasome pathway (9, 17). Clinically, reduced circulating superoxide dismutase levels in OSA patients further support impaired antioxidant defenses (18).
However, the role of the SOD2 Val16Ala polymorphism as a genetic modifier of OSA severity remains poorly defined and conflicting. While one study found no association with OSA risk (19), its analysis did not stratify by disease severity, potentially obscuring a genotype-severity relationship. We hypothesize that carriers of the SOD2 Val allele, with its associated reduction in mitochondrial antioxidant capacity, are not predisposed to the initial development of OSA but are susceptible to a more severe disease phenotype. We propose that the Val allele exacerbates the consequences of CIH by amplifying the oxidative and inflammatory response, thus promoting greater upper airway inflammation, edema, and neuromuscular dysfunction and establishing a vicious cycle that worsens the disease.
2. Objectives
The aim of this case-control study was to investigate the association between the SOD2 Val16Ala polymorphism and the severity of OSA in a clinically characterized population. We aimed to test the hypothesis that the Val allele is associated with an increased risk of severe OSA due to its role in amplifying the disease's core pathophysiological pathways.
3. Methods
3.1. Study Design and Participants
This study was conducted as a case-control study involving 187 participants. Participants were recruited from Sleep Disorders Research center, Kermanshah University of Medical Sciences, Kermanshah, Iran. Participants were stratified based on the severity of OSA as determined by the Apnea-Hypopnea Index (AHI). The study protocol was approved by the Research Ethics Committees of Kermanshah University of Medical Sciences (IR.KUMS.REC.1401.197), and written informed consent was obtained from all participants prior to their inclusion in the study.
3.2. DNA Extraction
Genomic DNA was extracted from 500 μL whole blood samples according to the protocol described by Moradi et al. with slight modifications (20). Briefly, red blood cells were lysed using distilled water and separated by centrifugation. The resulting pellet was rinsed with a red blood cell lysis buffer (Buffer A). White blood cells were then lysed with a buffer containing SDS (Buffer B) and incubated at 65°C. After cooling, proteins were removed by chloroform extraction in the presence of saturated NaCl. DNA from the aqueous phase was precipitated with ice-cold absolute ethanol, washed with 70% ethanol, air-dried, and finally dissolved in 100 μL ddH2O. The extracted DNA was assessed for quality and quantity using agarose gel electrophoresis and spectrophotometry.
3.3. Genotyping of Superoxide Dismutase 2 rs4880 Variant
Genotyping for the SOD2 rs4880 (Val16Ala) polymorphism was performed using a tetra-primer amplification refractory mutation system PCR (ARMS-PCR) assay, as previously described (21), with the following primer sequences:
- F1 (forward): 5′- CACCAGCACTAGCAGCATGT-3′.
- R1 (reverse): 5′‐ACGCCTCCTGGTACTTCTCC‐3′.
- F2 (forward): 5′- GCAGGCAGCTGGCTaCGGT-3′.
- R2 (reverse): 5′‐ CCTGGAGCCCAGATACCCtAAAG‐3′.
The PCR amplification was carried out in a total volume of 25 µL, containing up to 30 ng of genomic DNA of each sample. The thermocycling conditions consisted of an initial denaturation at 95°C for 7 minutes; 36 cycles of denaturation at 95°C for 40 seconds, annealing at 63°C for 30 seconds, and extension at 72°C for 35 seconds; and a final extension at 72°C for 5 minutes.
The amplification products were separated on a 2% agarose gel. The genotyping results were determined based on the presence of specific fragments: A 514 bp band (common outer product), a 366 bp band for the Val (T) allele, and a 189 bp band for the Ala (C) allele.
3.4. Statistical Analysis
Statistical analyses were conducted using SPSS software (version 27). Group comparisons for continuous and categorical variables, based on OSA severity, were performed using ANOVA and chi-square tests, respectively. We confirmed that the genotype distribution in the control group was in Hardy-Weinberg equilibrium (χ2 = 0.45, P = 0.50). The association between the SOD2 polymorphism and OSA was primarily evaluated by comparing genotype and allele frequencies, followed by logistic regression. Based on biological plausibility and model fit, a dominant genetic model was employed for multivariate analyses, comparing Val-allele carriers (Val/Val + Val/Ala) against Ala/Ala homozygotes. This approach was justified by the fact that the Val allele confers reduced enzymatic activity in both heterozygous and homozygous states. Furthermore, Spearman's correlation was used to examine the relationship between the AHI and key physiological variables. To identify independent predictors, we performed multivariate analyses using both ordinal logistic regression (treating OSA severity as an ordinal outcome) and binary logistic regression (comparing Severe OSA to Controls), with adjustments for established non-genetic risk factors for OSA, including age, gender, Body Mass Index (BMI), and neck circumference. Statistical significance was defined as a two-sided P-value of less than 0.05.
4. Results
4.1. Study Population Characteristics
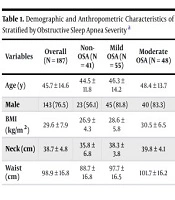
The study consisted of 187 participants stratified into four groups based on the AHI: Forty-one (21.9%) controls without OSA, 55 (29.4%) with mild OSA, 48 (25.7%) with moderate OSA, and 43 (23.0%) with severe OSA. The demographic and anthropometric characteristics are summarized in Table 1. As expected, significant differences were observed across groups for BMI, neck circumference, and waist circumference (P < 0.001 for all), with values increasing progressively with OSA severity. The proportion of male participants was also significantly higher in all OSA groups compared to the control group (P = 0.008). Age did not differ significantly across the groups.
Table 1.
Demographic and Anthropometric Characteristics of the Study Population Stratified by Obstructive Sleep Apnea Severity a
| Variables | Overall (N = 187) | Non-OSA (N = 41) | Mild OSA (N = 55) | Moderate OSA (N = 48) | Severe OSA (N = 43) | P-Value b |
|---|---|---|---|---|---|---|
| Age (y) | 45.7 ± 14.6 | 44.5 ± 11.8 | 46.3 ± 14.2 | 48.4 ± 13.7 | 52.9 ± 13.7 | 0.820 |
| Male | 143 (76.5) | 23 (56.1) | 45 (81.8) | 40 (83.3) | 35 (81.4) | 0.008 |
| BMI (kg/m2) | 29.6 ± 7.9 | 26.9 ± 4.3 | 28.6 ± 5.8 | 30.5 ± 6.5 | 32.5 ± 12.6 | < 0.001 |
| Neck (cm) | 38.7 ± 4.8 | 35.8 ± 6.8 | 38.3 ± 3.8 | 39.8 ± 4.1 | 40.5 ± 3.8 | < 0.001 |
| Waist (cm) | 98.9 ± 16.8 | 88.7 ± 16.8 | 97.7 ± 16.5 | 101.7 ± 16.2 | 106.8 ± 11.9 | 0.001 |
Abbreviations: OSA, obstructive sleep apnea; BMI, Body Mass Index.
a Values are expressed as mean ± SD or No. (%).
b P-values were derived from ANOVA for continuous variables and chi-square test for categorical variables.
4.2. Polysomnographic Parameters
Polysomnographic data confirmed the severity stratification (Table 2). The AHI and Respiratory Disturbance Index (RDI) increased progressively with disease severity, while average and minimal oxygen saturation (SpO2) decreased significantly. Sleep efficiency was also significantly reduced in the severe OSA group.
Table 2.
Sleep Study Parameters by Obstructive Sleep Apnea Severity a
| Variables | Overall (N = 187) | Non-OSA (N = 41) | Mild OSA (N = 55) | Moderate OSA (N = 48) | Severe OSA (N = 43) | P-Value b |
|---|---|---|---|---|---|---|
| AHI (events/h) | 24.5 ± 24.1 | 2.2 ± 1.4 | 10.3 ± 2.8 | 22.0 ± 4.7 | 57.0 ± 21.6 | < 0.001 |
| RDI (events/h) | 23.7 ± 22.4 | 2.8 ± 1.6 | 12.7 ± 6.5 | 24.1 ± 5.4 | 57.2 ± 20.1 | < 0.001 |
| Average SpO2 (%) | 90.8 ± 5.6 | 93.7 ± 2.6 | 91.3 ± 4.8 | 90.9 ± 4.0 | 87.1 ± 8.1 | < 0.001 |
| Minimal SpO2 (%) | 80.6 ± 10.7 | 88.1 ± 3.6 | 83.4 ± 7.4 | 80.0 ± 7.2 | 70.3 ± 13.8 | < 0.001 |
| Sleep efficiency (%) | 74.3 ± 18.1 | 72.5 ± 15.3 | 73.3 ± 21.2 | 77.6 ± 13.9 | 73.7 ± 19.3 | 0.210 |
| Snore Index | 151.8 ± 169.0 | 43.6 ± 29.8 | 160.2 ± 172.5 | 199.7 ± 179.3 | 190.9 ± 160.2 | < 0.001 |
Abbreviations: OSA, obstructive sleep apnea; AHI, Apnea-Hypopnea Index; RDI, Respiratory Disturbance Index; SpO2, oxygen saturation.
a Values are expressed as mean ± SD.
b P-values were derived from Kruskal-Wallis tests.
4.3. Superoxide Dismutase 2 Genotype Distribution and Hardy-Weinberg Equilibrium
Genotyping for the SOD2 Val16Ala (rs4880) polymorphism was successful for all participants. The overall genotypic frequencies were as follows: The Val/Val (denoted as GG) in 49 participants (26.2%), Val/Ala (denoted as AG) in 90 (48.1%), and Ala/Ala (denoted as AA) in 48 (25.7%). The genotype distribution in the control group did not deviate from Hardy-Weinberg equilibrium (χ2 = 0.45, P = 0.50), indicating no genotyping errors or population stratification.
4.4. Association of the Superoxide Dismutase 2 Val16Ala Polymorphism with Obstructive Sleep Apnea Severity
The distribution of SOD2 genotypes across severity groups is presented in Table 3. A significant difference in genotypic frequencies was observed (χ2 = 12.85, P = 0.002). This was driven by a marked overrepresentation of the Val allele in the severe OSA group (frequency = 0.65) compared to the other groups (frequency = 0.49 in each, P < 0.001). The Val/Val genotype was significantly more prevalent in the severe OSA cohort (41.9%) than in controls (24.4%).
| Groups | No. | Val/Val (GG) | Ala/Val (AG) | Ala/Ala (AA) | Val Allele Frequency |
|---|---|---|---|---|---|
| Control | 41 | 10 (24.4) | 19 (46.3) | 12 (29.3) | 0.49 |
| Mild OSA | 55 | 17 (30.9) | 27 (49.1) | 11 (20.0) | 0.49 |
| Moderate OSA | 48 | 10 (20.8) | 24 (50.0) | 14 (29.2) | 0.49 |
| Severe OSA | 43 | 18 (41.9) | 20 (46.5) | 5 (11.6) | 0.65 |
Abbreviations: Ala, alanine; Val, valine; OSA, obstructive sleep apnea.
a Values are expressed as No. (%).
b P-value for genotype distribution = 0.002 (χ2 test).
Given the allele frequency pattern suggesting a dose-effect, we tested both dominant and additive genetic models. In a dominant model (Val/Val + Val/Ala vs. Ala/Ala), carriage of at least one Val allele was associated with 2.7-fold increased odds of severe OSA compared to all other groups combined (OR = 2.70, 95% CI: 1.80 - 4.10; P < 0.001). An additive model (per Ala allele) also showed a significant effect, with each additional Val allele increasing the odds of severe OSA (OR = 1.92, 95% CI: 1.35 - 2.73; P < 0.001).
4.5. Multivariate Analysis with a Logically Sound Genetic Model
Based on the univariate results and biological plausibility, we employed a dominant genetic model for the Val allele. This model compares carriers of at least one Val allele (Val/Val + Val/Ala genotypes) to individuals homozygous for the Ala allele (Ala/Ala). This approach is justified because the Val allele confers reduced enzymatic activity in both heterozygous and homozygous states, and the univariate analysis showed a similar risk effect for Val allele carriers. The model treated OSA severity as an ordinal outcome (control < mild < moderate < severe) and included age, gender, BMI, and neck circumference as covariates.
The full model was statistically significant (likelihood ratio χ2 = 85.43, P < 0.001). As shown in Table 4, after adjustment for covariates, carriage of the Val allele remained a significant independent predictor of greater OSA severity, associated with a 2.4-fold increase in the odds of being in a more severe OSA category [adjusted odds ratio (aOR) = 2.40, 95% CI: 1.25 - 4.62, P = 0.008].
Table 4.
Multivariate Ordinal Logistic Regression Analysis for Predictors of Obstructive Sleep Apnea Severity (Dominant Genetic Model) a
| Predictors | aOR | 95% CI | P-Value |
|---|---|---|---|
| Val allele carrier (GG/GA) | 2.40 | 1.25 - 4.62 | 0.008 |
| BMI (kg/m2) | 1.12 | 1.06 - 1.18 | < 0.001 |
| Male gender | 2.98 | 1.55 - 5.73 | 0.001 |
| Neck circumference (cm) | 1.13 | 1.05 - 1.21 | 0.001 |
| Age (y) | 1.01 | 0.99 - 1.03 | 0.32 |
Abbreviations: aOR, adjusted odds ratio; Val, valine; BMI, Body Mass Index.
a The 'G' allele (c.47T) encodes the Val variant. The 'A' allele (c.47C) encodes the Alanine (Ala) variant. The dominant model groups Val/Val (GG) and Val/Ala (GA) genotypes versus the Ala/Ala (AA) genotype.
4.6. Correlation Analysis
Spearman's correlation analysis revealed a strong negative correlation between AHI and minimal SpO2 (ρ = -0.613, P < 0.001), and moderate positive correlations between AHI and waist circumference (ρ = 0.452, P < 0.001) and neck circumference (ρ = 0.368, P < 0.001; data not shown in full for brevity).
5. Discussion
This case-control study reveals a significant link between the SOD2 Val16Ala (rs4880) polymorphism and OSA severity. The Val allele and Val/Val genotype were more prevalent in severe OSA cases. In the multivariate ordinal logistic regression analysis, conducted under a dominant genetic model (Val/Val + Val/Ala vs. Ala/Ala), carriage of the Val allele was a significant independent predictor of greater OSA severity (aOR = 2.40, 95% CI: 1.25 - 4.62, P = 0.008), alongside BMI, male sex, and neck circumference. These findings suggest that compromised mitochondrial antioxidant defense, driven by genetic variation, may exacerbate the pathological response to intermittent hypoxia (IH) in OSA.
The significant association we observed, in contrast to a previous null report (19), likely stems from key methodological distinctions. While prior work employed a binary case-control design, our stratification by disease severity revealed that the Val allele acts not as a risk factor for OSA incidence, but as a potent genetic modifier of its progression. This severity-dependent effect underscores the importance of phenotypic refinement in genetic association studies.
Our findings are strongly supported by the established biochemical impact of the SOD2 Val16Ala polymorphism. As detailed in the background, the Val allele confers a significant reduction in mitochondrial antioxidant capacity (11, 12). We propose that this genetically determined deficiency amplifies the core pathophysiological pathways of OSA. This is not a subtle effect; studies in other diseases show this polymorphism carries significant clinical consequences, increasing the risk for conditions like type 2 diabetes mellitus, hypertension, and coronary artery disease (13-15), all common comorbidities of severe OSA. Thus, our finding that the Val allele predisposes to severe OSA fits a consistent pattern where reduced SOD2 activity exacerbates oxidative-stress-related pathologies.
The mechanism linking the Val allele to worse OSA severity likely involves a vicious cycle of oxidative stress and inflammation. The IH generates a massive burst of mitochondrial reactive oxygen species (mtROS) during each reoxygenation phase (6). In individuals with the Val allele, the compromised SOD2 activity leads to an inadequate clearance of superoxide radicals, resulting in amplified oxidative stress. This, in turn, activates redox-sensitive inflammatory pathways such as NF-κB and the NLRP3 inflammasome, leading to the production of pro-inflammatory cytokines like IL-1β and IL-6 (5, 9). This systemic inflammation can then perpetuate and worsen OSA by promoting upper airway inflammation, mucosal edema, and neuromuscular dysfunction, thereby increasing airway collapsibility. This hypothesis is directly corroborated by experimental models where heterozygous deletion of SOD2 significantly exacerbated CIH-induced lung inflammation, vascular remodeling, and pulmonary hypertension through mtROS-NLRP3 signaling pathways (9, 17).
Our findings have potential clinical implications, which suggests that the SOD2 Val16Ala genotype could serve as a biomarker to identify OSA patients at the highest risk for severe disease and its associated cardiovascular and metabolic complications. This could help clinicians identify high-risk patients earlier, allowing for more aggressive treatment and closer follow-up. Also, our findings strengthen the rationale for investigating targeted antioxidant therapies, particularly those that are mitochondria-specific (e.g., MitoQ) as a potential adjunct treatment for OSA, especially in patients carrying the high-risk Val allele (22).
The interpretation of our findings should be considered in the context of certain limitations. The modest sample size and single-population design limit generalizability across ethnic groups. Although a strong genetic association was observed, functional endpoints, such as SOD2 activity, oxidative stress markers, and inflammatory cytokines, were not assessed. Future research should correlate genotype with these phenotypes to clarify mechanistic pathways. Lastly, as an observational study, it establishes association rather than causation, underscoring the need for experimental validation to confirm biological relevance and therapeutic implications.
In conclusion, the SOD2 Val16Ala polymorphism is a significant and independent factor associated with OSA severity. Genotyping for this variant could help identify patients predisposed to severe disease, potentially guiding personalized therapeutic strategies.