
1. Background
Gestational diabetes mellitus (GDM) is one of the most common metabolic complications during pregnancy (1) and is recognized as the most prevalent complication during this period. Gestational diabetes mellitus is defined as glucose intolerance of varying severity with onset or first diagnosis during pregnancy (2).
Gestational diabetes mellitus is considered one of the main causes of maternal and infant mortality (3). Globally, the prevalence of GDM has been increasing over the last few decades (4). The prevalence of GDM worldwide varies from 5% to 25.5%, and in the United States, it affects 1 out of every 10 pregnant women (5). However, the prevalence of this disorder is higher in Asian women compared to American women. In Europe, the prevalence of GDM varies, with some populations showing that more than 20% of pregnancies are associated with GDM (6). A meta-analysis conducted in Iran reported the prevalence of GDM to be 7.6% (7).
The occurrence of GDM is influenced by age, race, body composition, family history of diabetes, ethnicity, and screening and diagnostic criteria (3, 7). Overweight and obesity are the most significant modifiable risk factors for GDM, with the risk being five times higher in morbidly obese women compared to those of normal weight (8). Other modifiable risk factors for GDM include unhealthy dietary habits, physical inactivity, and smoking (9). Additionally, the gradual increase in the average reproductive age of women plays an important role in the prevalence of GDM, as advanced maternal age is a known risk factor for GDM (10).
Diabetes during pregnancy affects both maternal health and fetal growth and is associated with an increased risk of adverse pregnancy outcomes for mothers and their children in both the short and long term. Women with GDM are at an increased risk of perinatal complications (1). Gestational diabetes mellitus is one of the primary causes of premature birth or even infant mortality. Diabetic mothers are at a higher risk of miscarriage (11). Maternal hyperglycemia independently increases the risk of cesarean delivery, large-for-gestational-age infants, admission to the neonatal intensive care unit (NICU), neonatal hypoglycemia, and hyperbilirubinemia (12). Furthermore, GDM is associated with high blood pressure, macrosomia, congenital abnormalities, intrauterine growth retardation, delays in brain maturation in infants, and neurobehavioral abnormalities, including relatively lower intelligence compared to normal infants, language disorders, poor attention, and impulsivity (3, 13, 14). Infant respiratory distress syndrome, childhood obesity, and adult CVD are more prevalent in children of mothers with GDM (1). Women who experience diabetes during pregnancy may develop metabolic disorders after delivery, including type 2 diabetes and CVD (2). Those with a history of GDM are approximately ten times more likely to develop type 2 diabetes than women with normal blood sugar levels (1).
Timely prediction of GDM and the initiation of early effective interventions in the first or second trimester may reduce the risk of developing GDM and yield positive outcomes for both the fetus and the mother (15). This disorder can impose a significant burden on the healthcare system (1). Several studies recommend that careful strategies, including glucose tolerance testing, ultrasound adipose tissue thickness measurements, and HbA1c screening, should be performed in the first trimester of pregnancy to predict GDM, which can help reduce the risk of this disorder in high-risk women (16-19). However, there is still no consensus on effective screening strategies for GDM, and many of the tools used are inaccessible to women in developing countries (16).
Since GDM is a manifestation of insulin resistance, it can also be associated with metabolic syndrome (20). It is well-accepted that diabetes and metabolic syndrome share similar risk factors. In general, waist and hip circumference, as well as the waist-to-hip ratio, are used to support the diagnosis of metabolic syndrome (21). However, none of these measures may provide an accurate estimate during pregnancy because they are influenced by numerous factors and can change dramatically during this time. The increase in abdominal circumference during pregnancy and the change in hip circumference complicate the accurate prediction of the risk of GDM in pregnant women (22).
Neck circumference (NC) has also been evaluated as an indicator of CVD, insulin resistance, and metabolic syndrome (23). It serves as a marker for fat distribution in the upper body. Research has shown that upper-body obesity is more closely associated with glucose intolerance, hyperinsulinemia, diabetes, and hypertriglyceridemia than lower-body obesity (22, 23). Several studies have reported that NC is a useful tool for assessing metabolic syndrome and its associated risk factors, such as insulin resistance, central obesity, blood pressure, fasting glucose, and triglyceride levels (22-24). Therefore, measuring NC appears to be a new, simple, reliable, reproducible, and cost-effective screening method, with increasing significance during pregnancy when the results of other parameters may become unreliable. Moreover, in some cases, NC may serve as a better indicator of the risk of an unfavorable profile compared to waist circumference (22, 23, 25).
2. Objectives
Some studies have shown that NC is related to insulin resistance and can be used as an indicator in the diagnosis of GDM. However, only a few studies have addressed this indicator, indicating that more investigations are needed. Given the importance of GDM and the need to mitigate its consequences, the present study aimed to assess the predictive power of the mother's NC for the early diagnosis of GDM.
3. Methods
This prospective cohort study was conducted in 2020 - 2021 on 782 pregnant women with a gestational age of 16 weeks who visited healthcare centers in Jiroft (Southeastern Iran). The participants were determined to be 16 weeks pregnant based on either the first day of their last menstrual period or an ultrasound from the first trimester of pregnancy. The criteria for enrollment in the study included being Iranian, having a current singleton pregnancy, being aged 20 - 40 years, having a Body Mass Index (BMI) of less than 30 kg/m², having no history of diabetes, no type 2 diabetes in first-degree relatives, no previous infants weighing 4 kg or more, no history of stillbirth or frequent abortions, no abnormal fetuses or babies in prior pregnancies among multiparous women, no pre-eclampsia or high blood pressure in previous and recent pregnancies, no smoking or drug use, no use of medications that affect glucose metabolism (such as steroids), and no known diseases (including CVD, thyroid disease, liver disease, kidney disease, blood disorders, metabolic syndrome, hyperlipidemia, persistent glucosuria, and polycystic ovary syndrome). The only exclusion criterion was the unwillingness of the pregnant woman to cooperate in the study.
Based on the probability of type 1 error (α = 0.05), sensitivity (64.4%), specificity (66.8%), and prevalence (12.5%), the sample size was estimated to be 782 participants. Data were collected using a form that contained two sections. The first section assessed the inclusion criteria, while the second section measured demographic characteristics (age, education, occupation, height, weight in the first trimester of pregnancy, BMI, and housing status), obstetric history (number of pregnancies, number of abortions, number of deliveries, gestational age), and included a checklist to record NC measurements at 16 weeks of pregnancy, along with the results of the GDM screening test with 75 g of glucose at 24 - 28 weeks of pregnancy. Glucose levels were evaluated according to WHO guidelines. In the screening test for GDM, fasting blood sugar was measured, and blood sugar levels were measured again one and two hours after consuming 75 g of oral glucose. Gestational diabetes mellitus was diagnosed by a gynecologist if the fasting blood sugar was ≥ 92 mg/dL, blood sugar one hour after glucose intake was ≥ 180 mg/dL, or blood sugar two hours after glucose intake was ≥ 153 mg/dL, with at least one of the blood sugar results being abnormal.
The participants were selected using multi-cluster sampling. There are three comprehensive healthcare centers in Jiroft, and an urban healthcare base in each center was selected as a cluster. Finally, participants were chosen through purposive sampling at each base, and the sampling procedure continued until the required number of participants was reached.
The protocol for this study was approved by the Ethics Committee of Jiroft University of Medical Sciences, under the code of ethics IR.JMU.REC.1399.17. Participants were given information about the study's objectives and procedures before completing an informed consent form. The demographic and obstetric information was collected through interviews with the participants. Afterward, the researcher measured the NC at the upper border of the thyroid cartilage using a tape measure (one meter was used for all women) and recorded the measurement in centimeters on the checklist.
The women whose NC was measured in the 16th week of pregnancy were referred to a central laboratory during the 24th to 28th week of pregnancy to undergo a routine screening test for GDM known as the oral glucose tolerance test (OGTT) with 75 grams of oral glucose. The GDM test was conducted using a device and a kit, and the test results were recorded in the checklist. After collecting data from an adequate number of participants, the relationship between NC values and GDM was analyzed using statistical tests, and the optimal cut-off point for NC size was determined. Participants were then divided into two groups based on the cut-off point for NC. Subsequently, the relationship between NC and the occurrence of GDM was examined. Moreover, statistical analysis methods were used to investigate the sensitivity, specificity, and positive and negative predictive values of NC in the diagnosis of GDM.
All the data were collected by a midwife. The validity of the demographic and obstetric instrument was assessed by evaluating its content validity. The validity of the blood sugar kit was determined using the Pars test kit and the BT300 auto analyzer made in Italy. To ensure the reliability of the blood sugar measuring devices, they were calibrated by medical engineers every morning. The blood sugar level was measured using a device and the glucose oxidase method by a laboratory technician. Simultaneous observations were conducted to determine the reliability of the tester. Specifically, 10 blood sugar samples were analyzed simultaneously by two testers with the same experience and level of education. The results were analyzed using Pearson’s correlation test (r = 1.0).
SPSS version 26 and R software were used for data analysis, with a confidence interval set at 95%. Descriptive statistics were employed to prepare frequency tables. Differences in normal quantitative variables between the two groups (with and without GDM) were assessed using the independent samples t-test. Qualitative variables were compared using the chi-square test, while non-normally distributed or interval quantitative variables were analyzed using the Mann-Whitney U test. Additionally, the ROC curve was utilized to determine the threshold level of NC and to assess the sensitivity and specificity of this measurement.
4. Results
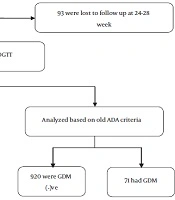
Of the 782 participants in this study, 179 had GDM, while 603 did not. The participants in the two groups showed no statistically significant differences in terms of age, education, BMI in the first trimester of pregnancy, number of pregnancies, number of births, or number of abortions. Table 1 presents the demographic and obstetric characteristics of the participants in the two groups.
Table 1.
Demographic and Obstetric Characteristics of the Participants in the Two Groups
| Variables | Groups a | Statistical Procedure | P-Value | |
|---|---|---|---|---|
| Characteristics | Women with GDM (n = 179) | Women without GDM (n = 603) | ||
| Age, (y) | 29.16 ± 4.80 | 29.02 ± 4.85 | Independent samples t-test | 0.131 |
| Education (high school) | 104 (58.1) | 342 (56.7) | Mann-Whitney U test | 0.103 |
| Mother’s job (housewife) | 168 (93.85) | 573 (95) | Chi-square | 0.571 |
| Father’s job (self-employed) | 122 (68.1) | 406 (80.8) | Chi-square | 0.116 |
| Gestational age | 30.31 ± 4.50 | 31.33 ± 3.92 | Independent samples t-test | 0.141 |
| Number of pregnancies | 1.80 ± 0.83 | 2.01 ± 1.03 | Independent samples t-test | 0.523 |
| Number of deliveries | 0.71 ± 0.62 | 0.83 ± 0.72 | Independent samples t-test | 0.567 |
| Number of abortions | 0.21 ± 0.44 | 0.25 ± 0.53 | Independent samples t-test | 0265 |
| BMI in the first trimester of pregnancy | 27.57 ± 0.93 | 27.32 ± 1.00 | Independent samples t-test | 0.430 |
| Neck circumference, cm | 35.64 ± 1.81 | 34.14 ± 1.97 | Independent samples t-test | 0.001 |
a Values are expressed as mean ± SD or No. (%).
The mean NC for women with GDM was 35.64 ± 1.81 cm, compared to 34.14 ± 1.97 cm for those without GDM. The minimum NC in women with GDM was 32.27 cm, while in those without GDM, it was 32.02 cm. The maximum NCs were 38.12 cm for women with GDM and 37.17 cm for those without GDM. There was a significant difference in the mean NC between the two groups (P = 0.001).
The NC was assessed using the ROC curve to diagnose GDM (Figure 1). Accordingly, the minimum and maximum NC thresholds (Table 2) were calculated, with an appropriate threshold for diagnosing GDM set at 35.45 cm. The area under the curve (AUC) was equal to 0.69, indicating that the NC test is an acceptable indicator for predicting GDM.
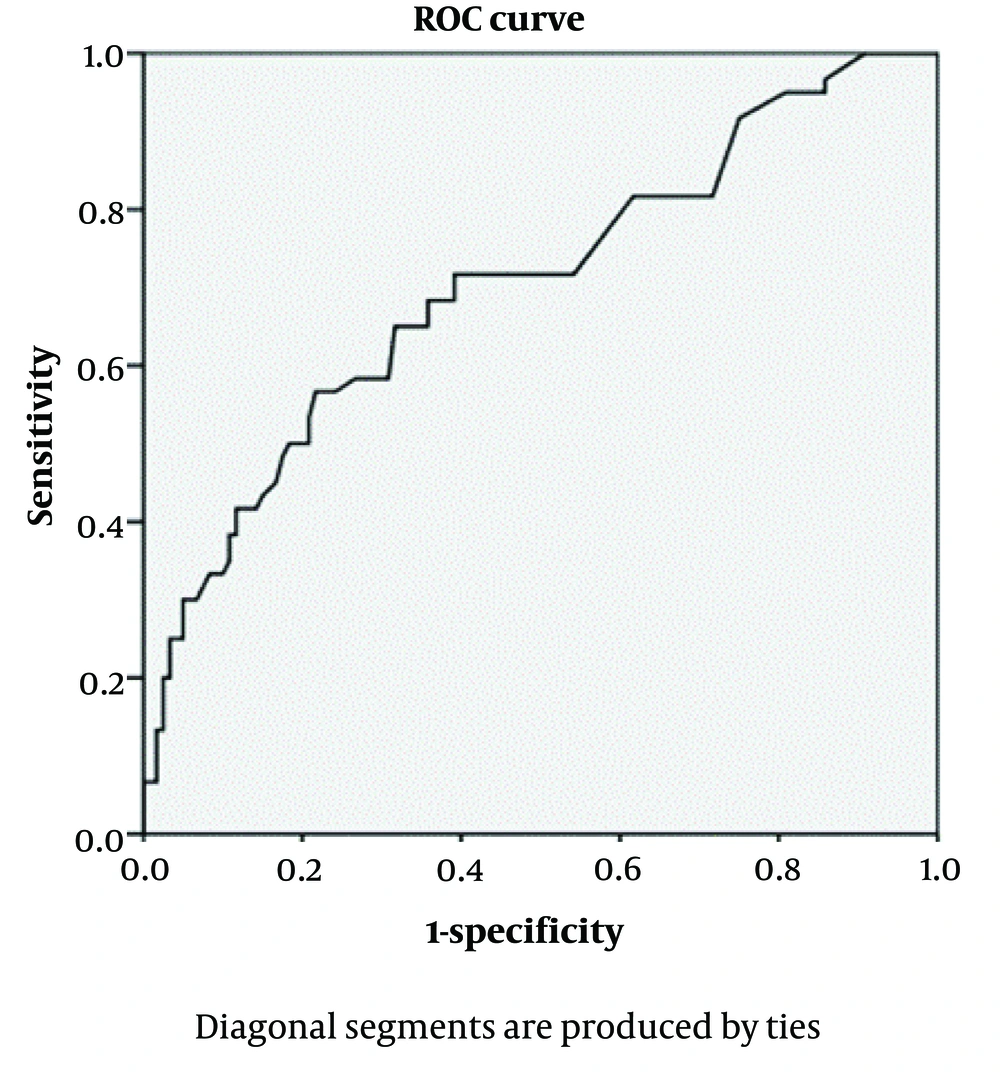
Figure 1.
The neck circumference curve for predicting gestational diabetes mellitus (GDM) in the participants (N = 782).
Table 2.
Sensitivity and Specificity of Neck Circumference Measurements for Different Cut-off Points
| Neck Circumference | Sensitivity | Specificity |
|---|---|---|
| 35.420 | 0.745 | 0.421 |
| 35.430 | 0.714 | 0.433 |
| 35.440 | 0.714 | 0.417 |
| 35.450 | 0.714 | 0.398 |
| 35.640 | 0.683 | 0.398 |
| 35.470 | 0.683 | 0.354 |
| 35.480 | 0.650 | 0.354 |
| 35.490 | 0.610 | 0.323 |
Using the ROC curve and the NC threshold of 35.45 cm, 128 women with GDM (71.51%) and 240 women without GDM (39.81%) had a positive NC test with a measurement greater than 35.4 cm (Table 3). As shown, the test has a sensitivity of 71.5%, a specificity of 60%, a positive predictive value of 34.8%, and a negative predictive value of 87.7%.
Table 3.
Relative Frequency of the Neck Circumference for the Threshold (Cut-off Point) of 35.45 cm in the Two Groups a
| Neck Circumference | Women with GDM | Women Without GDM |
|---|---|---|
| ≤ 35.45 | 51 (28.49) | 363 (60.19) |
| > 35.45 | 128 (71.51) | 240 (39.81) |
| Total | 179 (100) | 603 (100) |
a Values are expressed as No. (%).
5. Discussion
Identifying the risk factors for GDM is an important measure for implementing optimal interventions and screenings. Obesity or weight gain is one of the significant risk factors that is increasing among women of reproductive age. Previous studies have confirmed the relationships between several risk factors, such as pre-pregnancy BMI, family history of diabetes, physical activity, education, and age, with GDM. However, few studies have addressed the relationship between NC and GDM. The findings from the present study revealed a significant association between an increase in NC and GDM. The NC was higher in women with GDM compared to healthy women. The ROC curve and the NC threshold of 35.45 cm indicated that approximately 71% of the women with GDM, compared to 39% of the women without GDM, had a positive NC test with a measurement greater than 35.4 cm.
Since obesity and overweight can be important risk factors for developing GDM, the present study showed no statistically significant difference in BMI between women with and without GDM. Thus, both groups of women, those with and those without GDM, appear to be almost equally at risk of developing these complications.
Carvalho et al. examined the association between NC and the diagnosis of GDM, as well as maternal-fetal outcomes, in overweight or obese women before pregnancy, and found that NC is directly associated with plasma glucose levels, blood pressure, and GDM. In this study, the NC threshold was considered to be 34.5 cm (25).
Central fat distribution can be a predictive factor for insulin resistance. Waist circumference is one of the anthropometric measures that indicates visceral fat and serves as a risk factor for diabetes. However, this indicator is not a suitable measure for gestational diabetes due to the growth of the uterus. Neck circumference measurement is a marker of central fat accumulation, which is also associated with components of metabolic syndrome (25). Hancerliogullari et al. suggested that a waist size greater than 84.5 cm increases the risk of GDM, with a sensitivity of 78% and a specificity of 54% in Turkish women, and that the risk of developing GDM increases approximately 3.5 times with a higher waist size. They also demonstrated that NC is a simpler and more practical anthropometric index than waist circumference, as it is not affected by abdominal expansion or breathing movements after meals. In this study, the NC threshold for diagnosing GDM was > 38.5 cm, with 36.7% sensitivity and 77.5% specificity, and it had a positive correlation with GDM (26).
Neck circumference measurement can be a suitable indicator for assessing the possibility of GDM because NC changes only slightly during pregnancy. This index can be easily utilized in clinical investigations, especially in health centers with limited access to screening and laboratory services. As shown in this study, NC has adequate sensitivity for the diagnosis of GDM, with the highest sensitivity and specificity obtained using the ROC curve at a NC threshold of 35.45 cm. However, it is worth mentioning that this index, in conjunction with an assessment of other risk factors and BMI, can yield more reliable results.
Sedighi Barforoush et al. showed that NC can be a predictor of GDM. However, they found its sensitivity to be low (40.8 - 64%), while its specificity was relatively high (60.8 - 71.8%). They also indicated that using NC to screen for GDM has a low positive predictive value and a high negative predictive value. Moreover, the sensitivity and specificity of NC for predicting GDM were comparable to those of pre-pregnancy BMI. They found that Iranian pregnant women with a NC ≥ 34.3 cm were more likely to develop GDM (16). Additionally, Ghorbani et al. demonstrated that NC and waist circumference during the 12th to 14th week of pregnancy can serve as diagnostic indicators of GDM. Using the ROC curve, they reported a suitable threshold for NC at ≥ 33.5 cm, with a sensitivity of 68.5% and a specificity of 48.3%, and a suitable threshold for waist circumference at ≥ 33.5 cm, with a sensitivity of 57% and a specificity of 63.4% (27).
A survey of pregnant women aged 18 - 35 years in China suggested that NC was less strongly associated with GDM than BMI or waist circumference. However, the authors believed that NC was a reliable and independent anthropometric indicator for predicting GDM and that it has a significant relationship with GDM. They reported the optimal threshold for NC measurement to be 35.15 cm, which is partly similar to the value obtained in the present study (18).
Li et al. found that the diagnostic accuracy of NC for predicting GDM was similar to that of pre-pregnancy BMI and introduced NC as a new index for predicting GDM, with a threshold of 33.8 cm (23). The difference in the NC threshold values for the diagnosis of GDM across different studies may be related to demographic and racial differences within various communities or populations.
KhushBakht et al. suggested that NC measurement at the 16th week of pregnancy can be used as a predictor of GDM. They demonstrated that the NC threshold for predicting GDM was 35.70 cm, with a sensitivity of 51.4% and a specificity of 81.2% (22).
Given the importance of GDM and its complications for both mother and fetus, NC can be recommended as a simple and safe method for the early diagnosis of GDM in pregnant women. Although the NC threshold appears to vary among different populations, physicians and midwives in any geographical area can easily implement this method in prenatal care and utilize its outcomes for early diagnosis.
One of the strengths of this study was the use of R and SPSS software to determine the best cut-off point, the adoption of the latest diagnostic criteria for GDM, and the application of a prospective cohort design with a large sample size. However, a limitation of this study is that the participants were selected from only one region in the country, which may limit the generalizability of the findings to all Iranian pregnant women. Thus, multicenter longitudinal studies need to be conducted in the future.
5.1. Conclusions
The present study found a significant relationship between an increase in NC and GDM, with NC in women with gestational diabetes being greater than in healthy pregnant women. The best cut-off point determined in this study is 35.45 cm. For mothers whose NC exceeds 35.45 cm in the 16th week of pregnancy, the probability of developing gestational diabetes increases. Antenatal care providers can incorporate this measurement into their routine clinical examinations for the early and timely diagnosis and management of GDM, thus preventing complications associated with this disease.