


1. Background
2. Objectives
3. Methods
3.1. Population
3.2. Study Objectives
3.3. Exclusion Criteria
3.4. Study Protocol
3.4.1. Study Setting and Participation and Data Collection
3.4.2. Randomization and Blinding
3.4.3. Trial Intervention
3.4.4. Sample Size Calculation
3.4.5. Statistics Statistical Analysis
4. Results
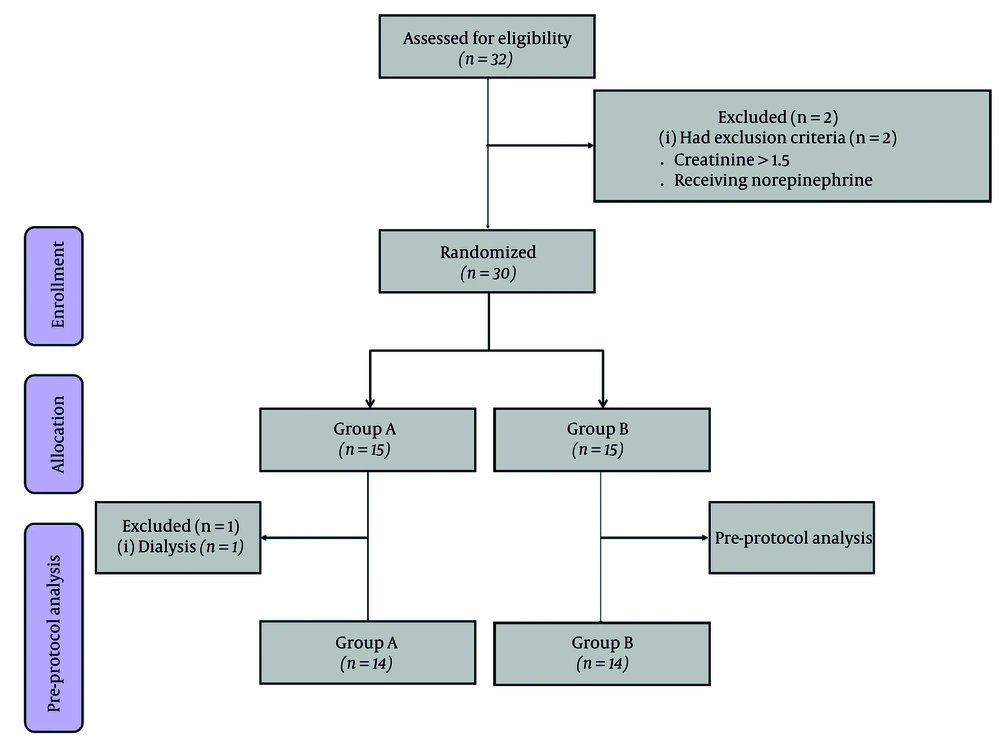
Consolidated standards of reporting trials (CONSORT) flow diagram
| Variables | Intervention (n = 14) | Control (n = 14) | Total (%) | P-Value |
|---|---|---|---|---|
| Gender | 0.678 | |||
| Female | 11 (78.57) | 9 (64.29) | 20 (71.34) | |
| Male | 3 (21.43) | 5 (35.71) | 8 (28.57) | |
| Age | 69 (64 -73) | 70.5 (62 -75) | 70 (63 - 74) | 0.519 |
| APACHE II Score | 17.64 ± 4.10 | 17.28 ± 5.81 | 17.46 ± 4.94 | 0.852 |
| Na (mEq/L) | 140.42 ± 5.13 | 137.21 ± 4.59 | 138.82 ± 5.05 | 0.092 |
| Albumin (g/dL) | 2.37 ± 0.38 | 2.4 ± 0.47 | 2.38 ± 0.42 | 0.863 |
a Values are expressed as frequency (%), mean ± standard deviation or median (Q1 - Q3).
| Variables | Before (Baseline) | After (48 Hours) | P- Value c | ||||
|---|---|---|---|---|---|---|---|
| Intervention (n = 14) | Control (n = 14) | P- Value b | Intervention (n = 14) | Control (n = 14) | P-Value b | ||
| Serum creatinine (mg/dL) | 0.9 (0.7 - 1.2) | 1.05 (0.7 - 1.7) | 0.473 | 0.95 (0.7 - 1.5) | 1.3 (0.8-1.6) | 0.542 | 0.251 |
| Systolic blood pressure (mmHg) | 129 ± 17.13 | 116.5 ± 20.82 | 0.095 | 115 (100 - 140) | 115 (100-130) | 0.673 | 0.431 |
| Diastolic blood pressure (mmHg) | 76.92 ± 9.94 | 71.42 ± 10.45 | 0.166 | 74 ± 11.47 | 70.64 ± 9.82 | 0.413 | 0.271 |
| Mean arterial pressure (mmHg) | 95.21 ± 11.54 | 87.63 ± 12.62 | 0.110 | 89.58 ± 14.01 | 86.11 ± 12.81 | 0.499 | 0.176 |
| Edema grade (mm) | 0.109 | 0.838 | < 0.001 | ||||
| 1+ | 0 (0.00) | 0 (0.00) | 4 (28.57) | 6 (42.86) | |||
| 2+ | 0 (0.00) | 4 (28.57) | 9 (64.29) | 7 (50.00) | |||
| 3+ | 11 (78.57) | 9 (64.29) | 1 (7.14) | 1 (7.14) | |||
| 4+ | 3 (21.43) | 1 (7.14) | 0 (0.00) | 0 (0.00) | |||
a Values are expressed as frequency (%), mean ± standard deviation or median (Q1 - Q3).
b Based on t-test or Mann-Whitney and Fisher’s exact tests.
c Comparing values before and after of intervention based on paired t-test or Wilcoxon test.
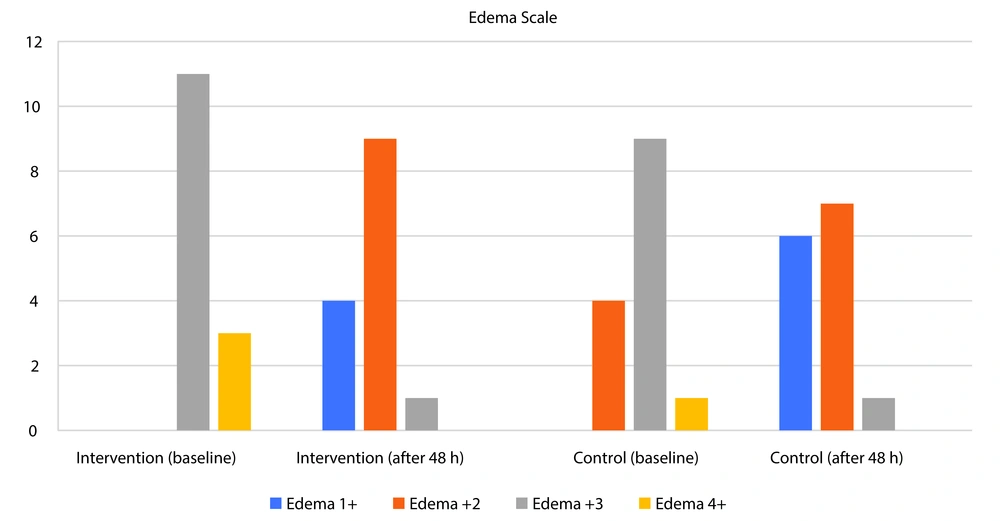
Edema Scale based on grade pitting edema in both groups at baseline and after 48 hours of treatment
| Urine Volume (mL) | Intervention | Control | P-Value b | Total | Friedman Test Results c |
|---|---|---|---|---|---|
| Baseline | 2025 (1200 - 3300) | 1550 (1200 - 4300) | 0.720 | 1782.50 (1200 - 3300) | χ2 = 15.500; df = 2; P < 0.001 |
| 24h after intervention | 5075 (1400 - 5500) | 3900 (2700 - 5200) | 0.872 | 4775 (2275 - 5475) | |
| 48h after intervention | 3600 (1550 - 5600) | 4450 (3400 - 4850) | 0.783 | 4050 (2262.50 - 5300) | |
| Urine output baseline - 24h d | -1642.85 ± 380.89 | -1523.92 ± 375.45 | 0.825 | -1583.39 ± 1389.89 | - |
| Urine output baseline - 48h d | -1500 ± 498.18 | -1470.35 ± 455.30 | 0.965 | -1485.17 ± 1752.30 | - |
a Values are expressed as frequency (%), mean ± standard deviation or median (Q1 - Q3).
b Based on Mann-Whitney test or t-test.
c Based on non-parametric repeated measure Friedman’s test.
d Comparing intervention and control groups based on the difference of urine volume before and after of intervention.

