1. Background
Vitiligo, characterized by the presence of depigmented patches, is a prominent feature of the acquired skin depigmentation disorder, affecting approximately 0.5% to 2% of both adults and children (1). The exact cause of vitiligo remains unidentified; nonetheless, factors such as genetics, autoimmune mechanisms, oxidative stress, and neuropsychological elements have been associated with its development (2). Vitiligo is primarily classified into two categories: Segmental and non-segmental, which can be differentiated by their onset and distribution. Segmental vitiligo is less prevalent and typically affects a specific region of the body, often presenting at a younger age. In contrast, non-segmental vitiligo is characterized by symmetrical white macules or patches that are spread across the skin; if not addressed, it tends to advance over time. Non-segmental vitiligo is the more common form and can develop at any age, although it most frequently emerges between the ages of 10 and 30 (3). Topical treatments, including corticosteroids, are considered the primary therapeutic options. For progressive conditions, systemic steroids and phototherapy serve as additional treatment modalities (4). Vitiligo poses significant challenges for modern medicine, primarily due to the absence of a definitive cure, despite its detrimental impact on social interactions and self-esteem. The effectiveness of existing treatments is inconsistent and often falls short of expectations, varying widely among individuals. Furthermore, there is a notable association between vitiligo and certain psychopathological conditions, with clinical epidemiological studies indicating that psychological factors significantly contribute to the onset of vitiligo (5, 6). However, there is no concrete proof that mental factors play a role in the development of vitiligo. The primary psychological conditions linked to vitiligo are anxiety and depression. Fluoxetine, a selective serotonin reuptake inhibitor (SSRI), is an antidepressant that primarily alleviates depression by inhibiting the reuptake of serotonin (5-HT) and modulating the 5-HT1A receptor. Prior research has indicated that fluoxetine can enhance melanin production in B16F10 melanoma cells as well as in normal human melanocytes. Recent studies have further shown that fluoxetine promotes melanogenesis through the 5-HT1A receptor. Additionally, research suggests that the melanogenic effects of fluoxetine are mediated by the activation of p38 phosphorylation, which subsequently leads to the expression of microphthalmia-associated transcription factor (MITF), tyrosinase (TYR), TYR-related protein 1, and a second TYR-related protein (7).
2. Objectives
According to previous studies that have investigated the effect of fluoxetine on melanin production in laboratory conditions or on non-human samples, the present study aimed to investigate the effect of oral fluoxetine in combination with topical corticosteroids (which is one of the standard treatments) compared to corticosteroids with starch-contained placebo in vitiligo patients.
3. Methods
This study is a triple-blind randomized clinical trial (RCT) conducted in 2022 - 2023 at the Skin Diseases and Leishmaniasis Research Center, Isfahan, Iran. Forty-one patients with vitiligo were included based on the following criteria: (1) Age 16 - 60 years, (2) lesions on limbs and trunk, (3) no treatment in the last month, (4) less than 20% body surface affected, (5) no psychiatric history, (6) no contraindicated drugs, (7) no fluoxetine contraindications, and (8) stable vitiligo lesions, i.e., no new patches or no increase in the size of existing patches during the last 6 months. Patients who did not comply with the conditions of taking the drug, such as the order to take the drug, continuous use of the drug, and not taking other skin drugs that affect vitiligo, and female patients who became pregnant during the study, and those who had acral or segmental vitiligo were excluded from the study.
Initially, the patients were divided into two groups using a table of random numbers. The conditions of the study were explained to each patient, and informed consent was obtained. The first group was treated with 20 mg fluoxetine (daily) capsules and daily administration of 0.05% clobetasol cream (fluoxetine group), while the second group was treated with daily administration of 0.05% clobetasol cream with a starch-contained placebo (control group). Meanwhile, the treatment of the fluoxetine group was under the supervision of a psychiatrist. The patients in the fluoxetine group applied a thin layer of 0.05% clobetasol cream on the lesions daily. Fluoxetine 20 mg capsules were also taken orally. After every three weeks of using clobetasol cream, this drug was stopped for one week while taking fluoxetine continued. The control group used 0.05% clobetasol cream as mentioned for the fluoxetine group with placebo.
At the beginning of the study and in the third month after initiating the study, photos were taken of the lesions at a specific location and with a fixed size, and the images were scored under the supervision of two blinded dermatologists. These dermatologists classified the improvement rate based on the changes in the size of the lesion and the amount of perifollicular pigmentation for each person into four categories as follows: Mild (improvement between 0% - 25%), moderate (improvement between 26% - 50%), good (improvement between 51% - 75%), and excellent (over 75% improvement). At the end of the study, the level of satisfaction with the treatment (by VAS score) and side effects were also compared between the two groups.
Following data collection, data were entered into SPSS V.23 and checked for missing information. Descriptive statistics, including mean, standard deviation, and frequency, were used to describe the results. The variables were compared between the two groups using chi-square and Fisher’s exact tests for categorical variables and Student’s t-test and Mann-Whitney U-test for parametric and nonparametric variables, respectively. Additionally, a generalized linear model (GLM) was used to evaluate the effect of the treatment group on the improvement percentage and patient satisfaction.
This study was triple-blind, meaning the patient, the person in charge of data analysis, and the treating physician were unaware of the type of treatment, and the fluoxetine and placebo capsules had the same shape. The pharmacist was responsible for dividing these capsules into two groups.
4. Results
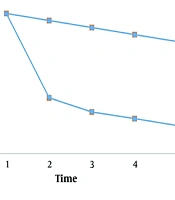
Overall, 41 patients with 91 skin lesions were included in this study, of which 19 patients (with 46 lesions) were in the fluoxetine group and 22 patients (with 45 lesions) were in the control group. Of all the patients studied, 13 (31.7%) were male and 28 (68.3%) were female. Considering that in the fluoxetine group, all patients were female and all men were in the control group, the results showed that the gender difference in the two study groups was significant (P < 0.0001). The mean ± standard deviation of the age of all the studied patients was 39.98 ± 7.75 years, ranging from 18 to 56 years. The results of the study indicated that the average age of people in the fluoxetine group was significantly higher than that of people in the control group (43.79 vs. 36.68, P = 0.002) (Table 1 and Figure 1).
Table 1.
Comparison of Demographic Characteristics in Two Treatment Groups a
| Variables | All Patients | Fluoxetine+Clobetasol | Clobetasol+Placebo | P-Value |
|---|---|---|---|---|
| Age | 39.98 ± 7.75 | 43.79 ± 6.88 | 36.68 ± 7.03 | 0.002 |
| Gender | < 0.0001 | |||
| Male | 13 (31.7) | 0 (0) | 13 (59.1) | |
| Female | 28 (68.3) | 19 (100) | 9 (40.9) |
a Values are expressed as No. (%) or mean ± SD.
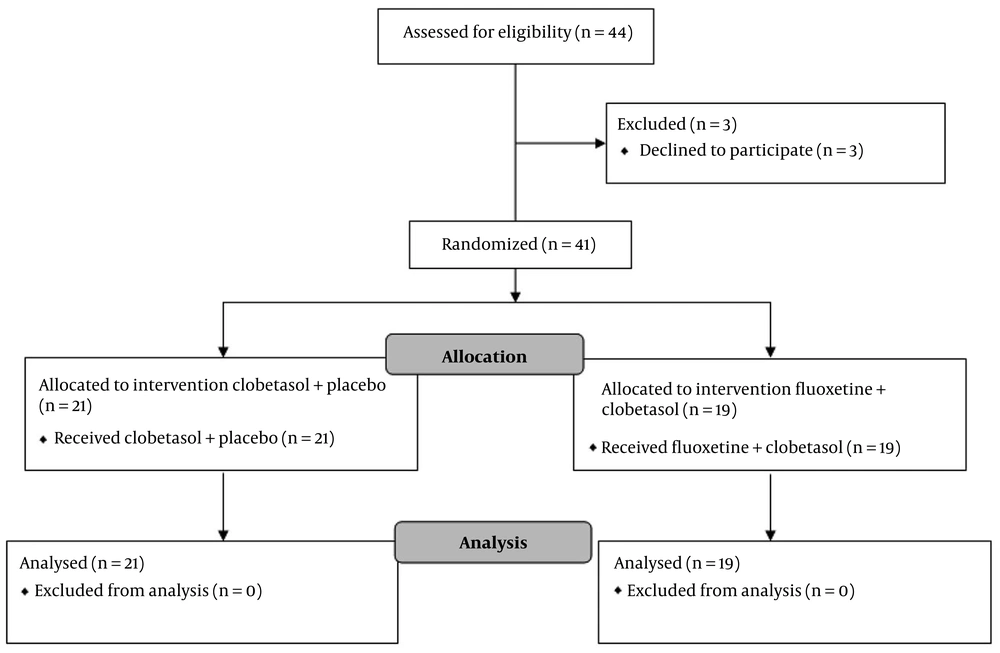
Figure 1.
Consort flowchart of patients entered the study
The rate of improvement in the skin lesions of the two groups was compared, and the results showed that the rate of improvement in the fluoxetine group was almost similar to that in the control group. Specifically, 47.8% of the fluoxetine group and 44.44% of the control group had only 0% to 25% recovery. Meanwhile, 10.9% of the fluoxetine group and 15.6% of the control group had a recovery between 75% and 100% (P = 0.879) (Table 2). On the other hand, the frequency of side effects related to fluoxetine (anxiety and sleep disorder) in the fluoxetine group was significantly higher than in the control group (P = 0.006). Due to the systemic use of fluoxetine in the fluoxetine group, the occurrence of these side effects (anxiety and sleep disorder) was expected from the beginning of treatment. Additionally, telangiectasia was observed in 2 persons from the fluoxetine group and 2 persons from the control group (Table 2).
Table 2.
Comparison of Improvement Percent and Side Effects in Two Treatment Groups a
| Variables | Fluoxetine+Clobetasol | Clobetasol+Placebo | P-Value |
|---|---|---|---|
| Improvement percentage | 0.879 | ||
| 0 - 25 | 22 (47.8) | 20 (44.4) | |
| 25 - 50 | 11 (23.9) | 9 (20 ) | |
| 50 - 75 | 8 (17.4) | 9 (20) | |
| 75 - 100 | 5 (10.9) | 7 (15.6) | |
| Side effects | 0.006 | ||
| None | 33 (71.7) | 43 (95.6) | |
| Anxiety | 2 (4.3) | 0 (0) | |
| Sleep disorder | 9 (19.6) | 0 (0) | |
| Telangiectasia | 2 (4.3) | 2 (3.8) |
a Values are expressed as No. (%).
Likewise, the mean ± standard deviation of patients’ satisfaction with the treatment method in the fluoxetine group was 2.54 ± 4.35, and in the control group, it was 1.58 ± 4.8. Therefore, the satisfaction of patients in the fluoxetine group was slightly higher than in the control group. However, no significant difference was observed between the satisfaction scores of the two treatment groups (P = 0.310). Additionally, the results of the study showed that by adjusting for the effect of two variables, age and gender, there was no significant difference in the rate of recovery of patients and the satisfaction score of patients in the two groups under study (Table 3).
Table 3.
The Effect of the Treatment Group on the Improvement Percent and Patient Satisfaction
| Response Variables | Coefficient Beta | Std. Error | P-Value | CI 95% | |
|---|---|---|---|---|---|
| Lower | Upper | ||||
| Improvement percent | |||||
| Treatment group a | 0.154 | 0.229 | 0.505 | -0.302 | 0.609 |
| Treatment group b | 0.420 | 0.303 | 0.169 | -0.181 | 1.022 |
| Treatment group c | 0.430 | 0.329 | 0.195 | -0.224 | 1.085 |
| Patient satisfaction | |||||
| Treatment group a | 0.452 | 0.443 | 0.310 | -0.428 | 1.333 |
| Treatment group b | 0.319 | 0.591 | 0.591 | -0.855 | 1.493 |
| Treatment group c | 0.266 | 0.650 | 0.737 | -1.511 | 1.073 |
a Univariate analysis: The effect of group therapy (clobetasol group compared to fluoxetine+clobetasol group).
b Multivariate analysis: The effect of group therapy (clobetasol group compared to fluoxetine+clobetasol group) by controlling the effect of gender.
c Multivariate analysis: The effect of group therapy (clobetasol group compared to fluoxetine+clobetasol group) by controlling the effect of gender and age.
5. Discussion
Vitiligo is a multifaceted condition that the medical community has endeavored to address comprehensively. Among the most commonly utilized treatment options are corticosteroids, administered both orally and topically (8-10). The effectiveness of these agents is ascribed to their immunosuppressive characteristics. Among the various topical corticosteroids, clobetasol cream at a concentration of 0.05% is the most frequently employed. Clobetasol diminishes the activity of immunoglobulins, facilitating the recovery of melanocytes and promoting skin repigmentation (11, 12). It became evident over time that combination therapies yield significantly better outcomes in the management of vitiligo compared to monotherapies, leading to the preference for a simultaneous multi-treatment approach (13).
The impact of SSRIs on depression outcomes in patients with vitiligo has been assessed in earlier research. Nevertheless, the efficacy of SSRIs in promoting melanogenesis and improving skin conditions in vitiligo patients remains unclear when compared to alternative treatments. Despite this, animal studies have indicated that fluoxetine may be beneficial in the management of vitiligo, leading previous research to suggest the necessity of RCTs to further investigate its effectiveness (7) and to prevent unnecessary side effects of the prescription of SSRIs in these patients (14).
In this study, we found that taking combined treatment with oral fluoxetine and topical clobetasol did not have a significant effect on melanogenesis in vitiligo patients. Depression is associated with a decrease in 5-HT levels within the central nervous system (CNS). Fluoxetine, a well-established antidepressant, increases the concentration of 5-HT in the synaptic cleft. Individuals with vitiligo exhibit notably lower serum levels of 5-HT when compared to healthy individuals (15). The presynaptic neuron within the CNS synthesizes the inhibitory neurotransmitter 5-HT. A reduction in the levels of 5-HT in the synaptic cleft may result from diminished production, release, or reuptake of 5-HT, potentially leading to depressive symptoms (16). The origins of depression and the processes that influence the response to antidepressant therapy are associated with 5-HT and its receptors (15).
Studies on the effectiveness of using this medication for vitiligo are very limited. Liao et al. (17) suggested that fluoxetine could play a beneficial role in the treatment of skin hypopigmentation disorders. In a 2018 in vivo study conducted on mice, Zhou et al. (2) discovered that fluoxetine may serve as an effective treatment for depigmentation disorders. In 2019, Liu et al. (18) illustrated that r-fluoxetine promotes melanogenesis by elevating the expression levels of TYR and the MITF in both in vivo and in vitro environments, while s-fluoxetine exhibited no impact in either context. Furthermore, r-fluoxetine stimulated melanin production via the serotonin1A receptor (5-HT1A) and the serotonin 2A receptor (5-HT2A). However, our findings showed that oral fluoxetine made no statistically significant difference in the improvement of depigmented lesions in vitiligo patients (Table 2). These results remained the same, implying a relationship between improvement percentage with age and gender (Table 3).
In addition to the lack of significant improvement in patients taking fluoxetine, its side effects, such as anxiety and sleep disorders, also bothered the patients. These side effects decreased patients’ satisfaction and led to their unwillingness to continue using fluoxetine. Of course, it should be kept in mind that most of our patients in both the fluoxetine group and the control group did not experience fluoxetine complications, but the difference in the few who did was significant (P = 0.005). Considering that the fluoxetine group used the systemic form of fluoxetine, these side effects were related to fluoxetine and were transient and predictable at the beginning of treatment in this group.
It seems that treatment with fluoxetine in vitiligo patients is important in two dimensions: One, its melanogenesis effect through 5-HT1A and 5-HT2A receptors, and two, its antidepressant effect in patients suffering from mental problems resulting from a skin disease. The second effect can be helpful in improving the mood and mental conditions of patients, but this study was conducted with the aim of improving the melanogenesis effect and not its antidepressant effect. Although our data analysis of the two groups of oral fluoxetine and topical clobetasol versus topical clobetasol and placebo did not show the first effect.
The present study had some strengths and limitations. The most important strength was the comparison of two groups of fluoxetine and control with the design of a RCT, which can be the beginning of a more complete investigation of the effect of this medication in the treatment of vitiligo. The first limitation of this study was not investigating the psychological effects of fluoxetine. Future studies should clarify the overall efficacy of fluoxetine in both the dermatological and psychiatric domains. Second, the effects of other antidepressants, such as monoamine oxidase inhibitors (MAOIs), tricyclic antidepressants (TCAs), serotonin/norepinephrine reuptake inhibitors (SNRIs), norepinephrine/dopamine reuptake inhibitors (NDRIs), serotonin antagonist-reuptake inhibitors (SARIs), and agents with indirect noradrenergic and serotonergic actions (NaSSAs) were not investigated along with fluoxetine. Also, one of the important limitations was not using the topical form or a higher dose of fluoxetine, which could have led to a better outcome in the fluoxetine group. Finally, a complete investigation of the effectiveness of fluoxetine in vitiligo requires long-term follow-up of patients, which should be considered in future studies.
5.1. Conclusions
The patients with vitiligo did not show a significant improvement after starting fluoxetine, and adding oral fluoxetine to topical clobetasol treatment had similar therapeutic effects to topical clobetasol treatment alone.