
1. Background
Periorbital melanosis (POM) is a common skin condition that can affect patients of any age and sex. It is defined as bilateral hyperpigmentation of the periorbital area that is darker than the surrounding skin (1). Various exogenous and endogenous factors can cause periorbital hyperpigmentation (2). It is a benign condition with an unclear pathogenesis. The classification of POM by Ranu et al. lists the causes as constitutional factors, postinflammatory changes, vascular factors, shadow effects, and other factors, such as anemia, hormonal changes, nutritional deficiencies, acanthosis nigricans, skin laxity, and unhealthy lifestyle habits (3). Periorbital melanosis has a complex etiology that may be physiological, hereditary, or associated with chronic disease (4).
Metabolic syndrome, sometimes referred to as “the deadly quartet,” “insulin resistance syndrome,” “syndrome X,” and “hypertriglyceridemic waist,” is increasingly recognized as a significant cardiovascular risk factor (5). Many skin disorders, such as acanthosis nigricans, hirsutism, skin tags, and acne, have been identified as markers of insulin resistance associated with hyperinsulinemia. Various metabolic changes, such as reduced levels of sex hormone-binding globulin and adiponectin and increased levels of insulin-like growth factor 1 (IGF-1), leptin, androgens, and insulin-like growth factor-binding protein 3 (IGFBP-3), occur as a result of hyperinsulinemia. These hormones actively regulate the expression of genes required for skin cell proliferation, which may give rise to cutaneous manifestations such as epithelial cell carcinomas and acanthosis nigricans (6, 7). Similar changes may also be observed in patients with POM.
Adiponectin is an adipocyte-derived cytokine encoded by the ADIPOQ gene that regulates metabolic processes such as glucose metabolism and fatty acid oxidation (8, 9). Through its antioxidant, anti-inflammatory, and antifibrotic effects, adiponectin contributes to the regulation of glucose levels, lipid metabolism, and insulin sensitivity (10). Several studies have shown an inverse correlation between BMI and adiponectin levels (11, 12).
2. Objectives
The present study aimed to evaluate serum adiponectin levels in patients with POM and assess their association with metabolic syndrome.
3. Methods
3.1. Study Design and Setting
This observational cross-sectional study included 80 participants: 40 cases of POM aged older than 18 years and 40 age- and sex-matched healthy controls. Participants were recruited from January 2022 to December 2022 at the Dermatology Outpatient Department of Government Medical College, Patiala, Punjab, India, a tertiary care center in North India.
3.2. Participants
Cases were diagnosed based on clinical examination confirming bilateral periorbital hyperpigmentation that was visibly darker than the surrounding skin, with no evidence of postinflammatory changes, vascular causes, or shadow effects. No formal severity scale was used.
Patients with atopy, postinflammatory hyperpigmentation, a positive shadow effect, dermal melanocytosis, or other skin diseases associated with metabolic syndrome, such as psoriasis, vitiligo, androgenetic alopecia, acne vulgaris, hidradenitis suppurativa, and acanthosis nigricans, were excluded. Patients who had received steroid therapy during the previous 6 months or had used drugs known to cause hyperglycemia, hyperlipidemia, or hypertension were also excluded. Patients with anemia, hormonal disturbances, nutritional deficiencies, associated chronic illness, or similar conditions were also excluded.
Healthy controls were recruited from hospital staff and accompanying relatives of non-study patients who volunteered to participate. To ensure that controls were free from conditions affecting metabolic parameters, beyond age and sex matching, they underwent a detailed medical history review, physical examination, and screening laboratory tests, including complete blood count, fasting blood sugar, and serum lipid profile. Individuals with abnormalities suggestive of metabolic syndrome or related disorders were excluded.
3.3. Sample Size
The sample size was calculated using the formula for comparing means between 2 independent groups. The study aimed to detect a clinically meaningful difference in mean serum adiponectin levels of 2 µg/mL between cases and controls, based on the difference reported by Thappa et al. (13), assuming an SD of 3 µg/mL in both groups, a 2-sided alpha level of 0.05, and 80% power (1 - β = 0.80). This yielded a minimum sample size of approximately 36 participants per group.
To account for potential incomplete data or dropouts, the sample size was rounded up to 40 participants per group, for a total of 80 participants. The calculation was performed using G*Power software version 3.1.
3.4. Data Collection and Laboratory Measurements
The diagnosis was established through history and clinical examination. A complete dermatological examination was performed to determine the type of lesion, along with a general physical examination. At the initial visit, each patient’s age, sex, weight, height, blood pressure, and duration of POM were recorded. Body mass index was calculated as weight in kilograms divided by height in meters squared (kg/m2). Routine blood investigations, including fasting blood sugar and serum lipid profile, were performed, along with special investigations, including serum adiponectin and fasting serum insulin.
3.5. Statistical Analysis
Statistical analyses were primarily univariate. Multivariable regression was considered but not performed because of the observational study design and limited sample size, which could have led to overfitting. The significant BMI difference between groups was noted as a potential confounder for lipid and insulin outcomes, warranting adjustment in future larger studies. Data were statistically evaluated, and P < 0.05 was considered statistically significant.
4. Results
4.1. Body Mass Index
In this study, BMI was compared between the 2 groups. The mean BMI among the 40 cases was 23.99 ± 3.21 kg/m2. Among the 40 controls, the mean BMI was 22.53 ± 1.42 kg/m2 (Table 1). The difference in mean BMI between cases and controls was statistically significant (P = 0.010).
Table 1.
Comparison of Mean Body Mass Index Between the Study and Control Groups
| Groups | Number | Mean BMI, kg/m2 | P Value |
|---|---|---|---|
| Cases | 40 | 23.99 ± 3.21 | 0.010 |
| Controls | 40 | 22.53 ± 1.42 |
4.2. Blood Pressure
Systolic and diastolic blood pressure were compared between cases and controls. The mean systolic blood pressure (SBP) was 122.35 ± 9.81 mm Hg in cases and 120.00 ± 6.84 mm Hg in controls. The difference in SBP between the 2 groups was not statistically significant (P = 0.218). The mean diastolic blood pressure (DBP) was 79.88 ± 6.81 mm Hg in cases and 78.25 ± 5.41 mm Hg in controls. The difference in DBP between the 2 groups was also not statistically significant (P = 0.241; Figure 1).
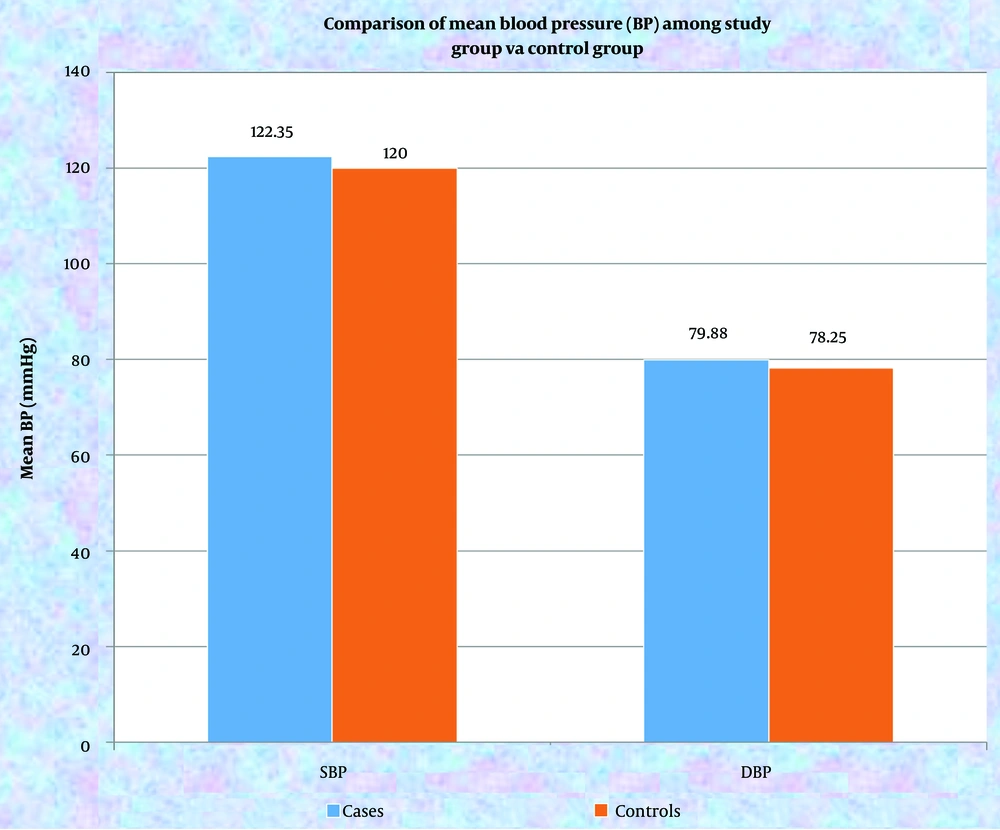
Figure 1.
Bar graph showing the comparison of mean blood pressure between the study and control groups
4.3. Fasting Blood Sugar
Fasting blood sugar (FBS) levels were compared between cases and controls. The mean FBS level was 86.75 ± 17.13 mg/dL in cases and 83.80 ± 11.24 mg/dL in controls. Although the mean FBS level was higher in cases than in controls, the difference was not statistically significant (P = 0.128; Figure 2).
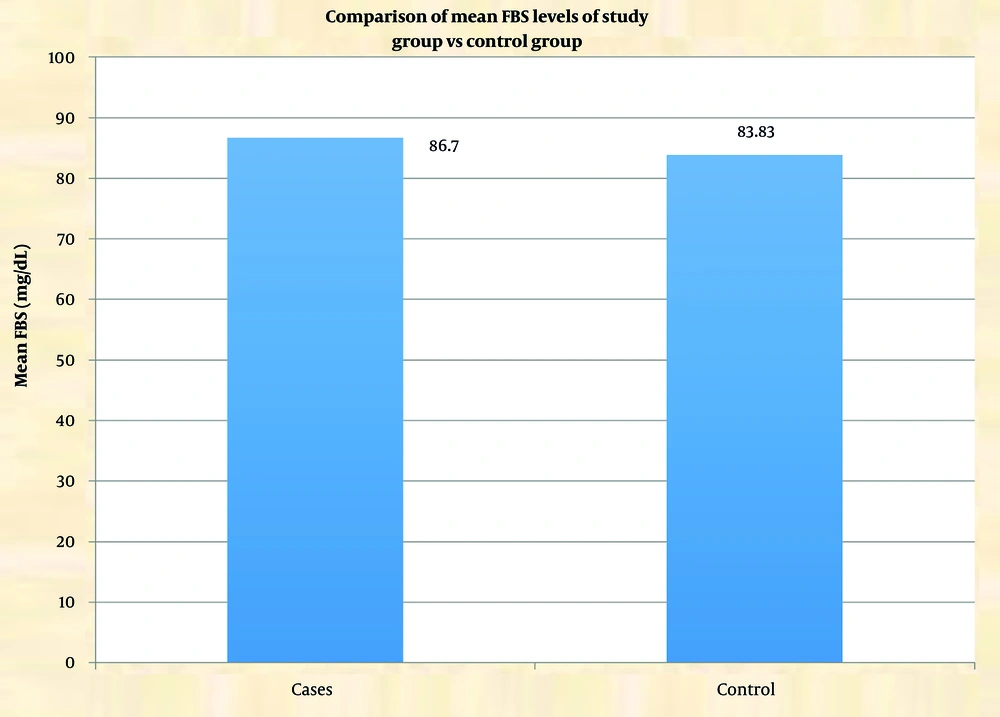
Figure 2.
Bar graph showing the comparison of mean fasting blood sugar levels between the study and control groups
4.4. Lipid Profile
The fasting lipid profile was compared between cases and controls. The mean cholesterol level was significantly higher in cases (174.58 ± 23.37 mg/dL) than in controls (164.03 ± 19.35 mg/dL; P = 0.031). Triglyceride levels were 134.38 ± 18.75 mg/dL in cases and 130.35 ± 14.59 mg/dL in controls, with no significant difference between groups (P = 0.287). Low-density lipoprotein cholesterol was significantly higher in cases (94.95 ± 10.05 mg/dL) than in controls (84.43 ± 10.15 mg/dL; P < 0.001). High-density lipoprotein cholesterol levels were slightly lower in cases (41.58 ± 3.59 mg/dL) than in controls (42.98 ± 3.63 mg/dL); however, this difference was not statistically significant (P = 0.087). Very low-density lipoprotein levels were also similar between groups, with a mean of 25.63 ± 5.79 mg/dL in cases and 24.88 ± 4.39 mg/dL in controls (P = 0.516; Table 2).
Table 2.
Comparison of Mean Lipid Profile Values Between the Study and Control Groups
| Lipid Profiles | Cases | Controls | P-Value |
|---|---|---|---|
| Cholesterol (< 200 mg/dL) | 174.58 ± 23.37 | 164.03 ± 19.35 | 0.031 |
| Triglycerides (< 150 mg/dL) | 134.38 ± 18.75 | 130.35 ± 14.59 | 0.287 |
| LDL (< 100 mg/dL) | 94.95 ± 10.05 | 84.43 ± 10.15 | < 0.001 |
| HDL (≥ 40 mg/dL) | 41.58 ± 3.59 | 42.98 ± 3.63 | 0.087 |
| VLDL (< 50 mg/dL) | 25.63 ± 5.79 | 24.88 ± 4.39 | 0.516 |
4.5. Fasting Insulin
Fasting insulin levels were assessed in 40 cases and 40 controls. The mean fasting insulin level was 15.46 ± 16.31 µU/mL in cases and 11.52 ± 6.54 µU/mL in controls. Although the mean serum fasting insulin level was higher in cases than in controls, the difference was not statistically significant (P = 0.161; Figure 3).
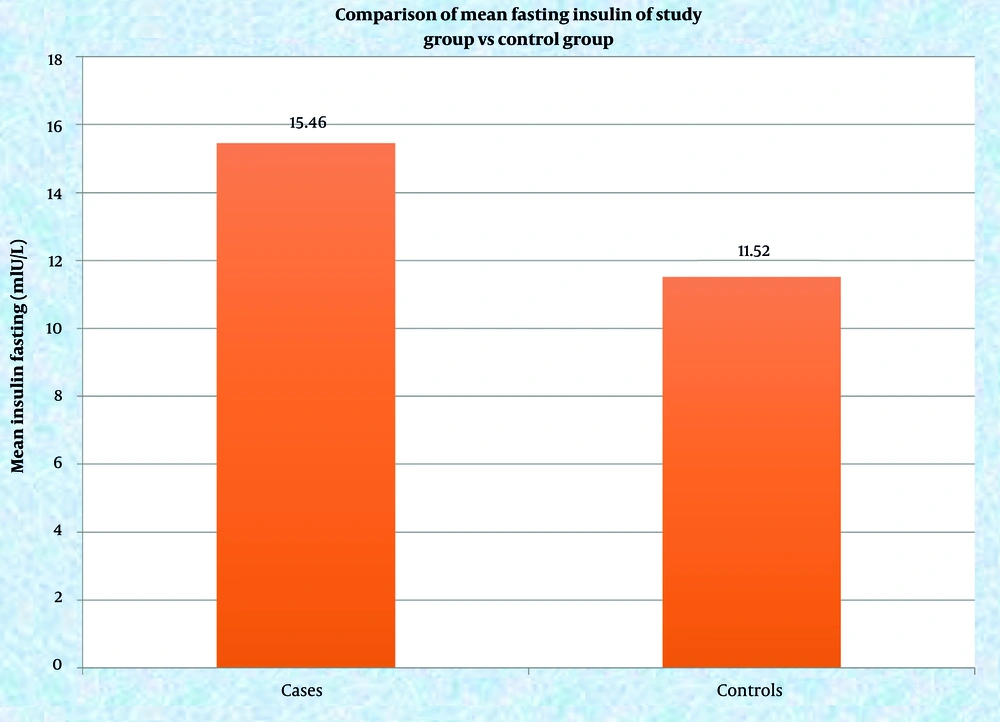
Figure 3.
Bar graph showing the comparison of mean fasting insulin levels between the study and control groups
4.6. Serum Adiponectin
The mean serum adiponectin level was 9.22 ± 5.86 µg/mL in cases and 11.22 ± 5.64 µg/mL in controls. Although the mean serum adiponectin level was lower in cases than in controls, the difference was not statistically significant (P = 0.124; Figure 4).
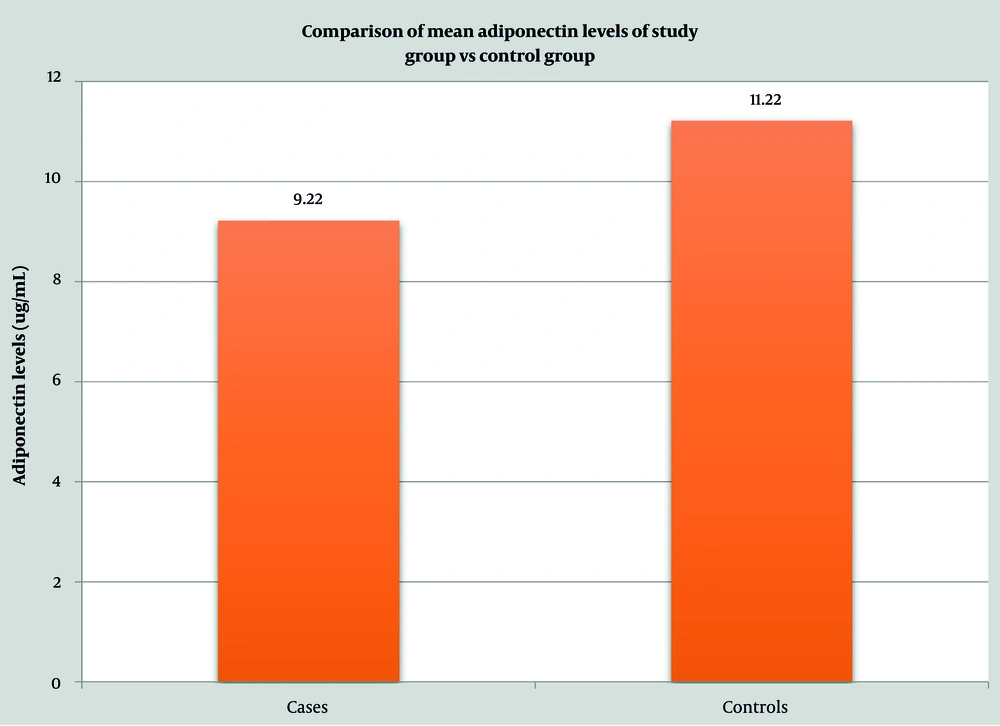
Figure 4.
Bar graph showing the comparison of mean serum adiponectin levels between the study and control groups
5. Discussion
This study investigated the association between POM and metabolic syndrome, as well as serum adiponectin levels. A probable association was observed between POM and metabolic syndrome, with higher mean BMI (23.99 kg/m2 vs. 22.53 kg/m2; P = 0.010), mean serum cholesterol levels (174.58 mg/dL vs. 164.03 mg/dL; P = 0.031), and mean serum LDL cholesterol levels (94.95 mg/dL vs. 84.43 mg/dL; P < 0.001) in patients with POM than in controls. Given the significant difference in BMI, which may confound lipid outcomes, future analyses could use multivariable regression to adjust for BMI and other covariates. These findings are consistent with a previous study by Thappa et al. (13), which reported higher mean BMI (24.49 kg/m2 vs. 22.85 kg/m2; P = 0.001), mean serum cholesterol levels (176.74 mg/dL vs. 167.59 mg/dL; P = 0.023), and mean serum LDL cholesterol levels (113.50 mg/dL vs. 103.23 mg/dL; P = 0.013) in patients with POM than in controls. In the study by Sheth et al. (1), high cholesterol levels were observed in only 1% of patients, with a statistically insignificant P value of 0.685. Previous authors have suggested that metabolic and endocrine disorders might contribute to the development of periorbital melanosis, although no statistical data were provided to support this claim. Therefore, larger studies are required, given the complex etiology of the disorder and growing concerns about appearance, to improve understanding of this condition.
In this study, patients with POM had higher FBS levels than controls (86.75 mg/dL vs. 83.80 mg/dL; P = 0.128), although the difference was not statistically significant. This finding differs from the study by Thappa et al. (13), in which higher FBS levels were observed in cases than in healthy controls, with a statistically significant difference (P < 0.001). In the study by Sheth et al. (1), only 9% of patients with POM had a history of systemic diseases such as hyperthyroidism, hypothyroidism, diabetes, hypertension, high cholesterol, or seizures, and this finding was not statistically significant (P > 0.05). A study by David et al. (14) did not show any significant association between POM and systemic diseases such as diabetes, hypertension, and hypothyroidism. Previous authors have suggested that metabolic and endocrine disorders might contribute to the development of periorbital melanosis, although no statistical data were provided to support this claim. Therefore, larger studies are needed to improve understanding of this disorder, given its complex etiology and increasing cosmetic concerns.
This study did not find a significant association between POM and hypertension, unlike the study by Thappa et al. (13), in which the mean DBP was 79.91 ± 7.55 mm Hg in cases and 82.50 ± 5.96 mm Hg in controls, with a statistically significant difference (P = 0.008). In the study by David et al. (14), hypertension was observed in 2.4% of patients, with a statistically insignificant P value of 0.681. In the study by Sheth et al. (1), only 9% of patients with periorbital hyperpigmentation had a positive current or past history of systemic disorders such as diabetes, hyperthyroidism, hypothyroidism, hypertension, high cholesterol, or seizures, which was not statistically significant (P > 0.05). The role of hypertension in causing or aggravating POM remains debatable and requires further evaluation.
In this study, patients with POM had higher mean serum fasting insulin levels than controls (15.46 µU/mL vs. 11.52 µU/mL; P = 0.161), although the difference was not statistically significant. Elevated insulin levels in cases may have been partly influenced by higher BMI; adjustment using regression in larger cohorts could clarify this association. In a study by Thappa et al. (13), higher serum fasting insulin levels were found in cases than in healthy controls, with a statistically significant difference (P < 0.001). Because the study by Thappa et al. (13) was conducted in Puducherry, differences in serum insulin levels between the present study and their study may be due to geographical variations in hormonal profiles. Chandrupatla et al. (15) conducted a study on the prevalence of diabetes and prediabetes among young and middle-aged adults in India, including an analysis of geographic differences, and found that South India had the highest prevalence of diabetes (9.39%), followed by East India (6.81%) and West India (6.58%), with the lowest prevalence in North India (4.90%). Therefore, additional studies are needed to determine the molecular mechanisms underlying the onset of POM and its value as a cutaneous marker of insulin resistance.
Regarding serum adiponectin levels, this study found lower levels in patients with POM than in controls (9.22 µg/mL vs. 11.22 µg/mL; P = 0.124), although the difference was not statistically significant. This contrasts with the study by Thappa et al. (13), which reported significantly lower serum adiponectin levels in patients with POM (P < 0.001). Differences in serum adiponectin levels between this study and the study by Thappa et al. (13) may be due to geographical variations, small sample size, and the dual effect of adiponectin on melanocytes.
The association between POM and metabolic syndrome may be related to the role of adiponectin in regulating glucose and lipid metabolism. Adiponectin has antimelanogenic effects, which may contribute to the development of POM. However, the exact mechanisms underlying this association remain unclear and require further study.
In brief, this study underscores the importance of considering metabolic syndrome in the management of patients with POM. Further studies are needed to explore the molecular mechanisms underlying the association between POM and metabolic syndrome, as well as the role of adiponectin in this relationship.
5.1. Limitations
The limitations of this study include the lack of multivariable adjustment for BMI in analyses of lipids and insulin, which could be addressed in prospective studies with larger sample sizes.
5.2. Conclusions
This study highlights a probable association between POM and metabolic syndrome, emphasizing the need for comprehensive management of patients with POM beyond cosmetic concerns. By recognizing this link, healthcare providers can adopt a more holistic approach that incorporates metabolic screening and lifestyle interventions to improve the overall health and quality of life of patients with POM. These findings have important implications for the management of POM and may help reduce the risk of cardiovascular diseases and other metabolic complications. Ultimately, this research may support enhanced patient care and improved health outcomes for individuals with POM.