


1. Background
2. Objectives
3. Methods
3.1. In Silico Analysis
3.2. Ethical Code
3.3. Animal Working and Treatment
3.4. Brain Tumor Modeling
3.5. Consumption of Nanoliposomes and Herbal Extraction
3.6. Protocol of the Swimming Training
3.7. Nanoliposomes Delivery System Preparation Guideline for Polyherbal Extract
3.8. Assessment of the Gene Expression Level
| Gene | Sequence of Primers | Size (bp) |
|---|---|---|
| P53 | Forward: 5’- CCGACTATACCACTATCCACTAC -3’ | 147 |
| Reverse: 5’- CACAAACACGAACCTCAAAGC -3’ | ||
| Hras | Forward: 5’- GTTTGGCAGCCCCTGTAGAA -3’ | 132 |
| Reverse: 5’- CTATAGTGGGATCATACTCG -3’ | ||
| IL-10 | Forward: 5’- GCAGGACTTTAAGGGTTACTTGG -3’ | 181 |
| Reverse: 5’- GGGGAGAAATCGATGACAGC -3’ | ||
| Casp8 | Forward: 5’- GTAAACTTTGGCGGACTG -3’ | 303 |
| Reverse: 5’- AGCCTCTGAAATAGCACC -3’ | ||
| GAPDH | Forward: 5’- AGGTCGGTGTGAACGGATTTG -3’ | 123 |
| Reverse: 5’- TGTAGACCATGTAGTTGAGGTCA -3’ |
3.9. Behavioral Tests
3.9.1. Beam Test
3.9.2. Sciatic Functional Index
3.10. Statistical Analyses
4. Results
4.1. Bioinformatics Assessment
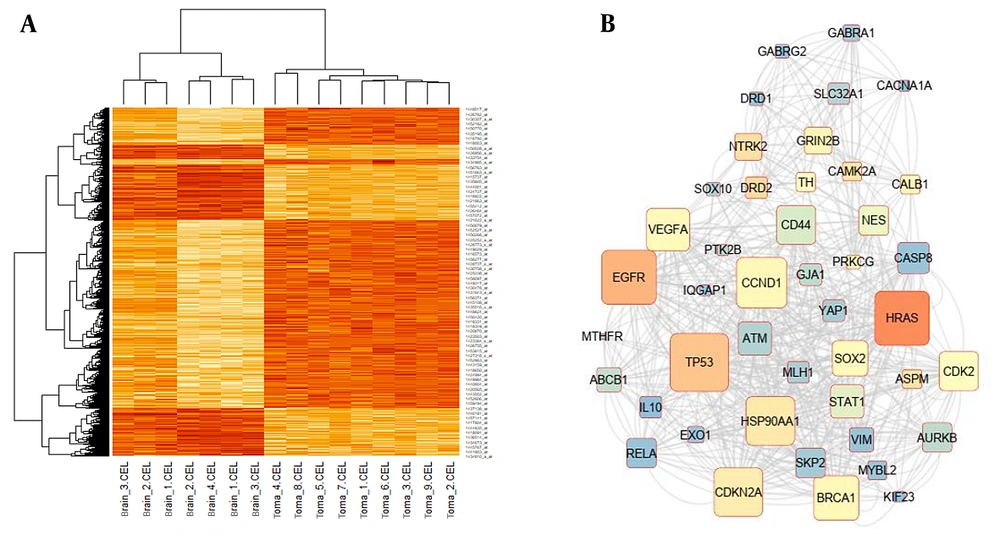
A, The heat Map visualization tool in the R statistical language analysis displayed remarkably differential gene expression patterns in patients with midbrain cancer compared to healthy controls using the (P < 0.001 thresholds); B, Hub genes considered to have a role in the progression of midbrain cancer were mapped out in a protein-protein interactions network and sorted according to the network's features such as degree, betweenness centrality, and closeness centrality.
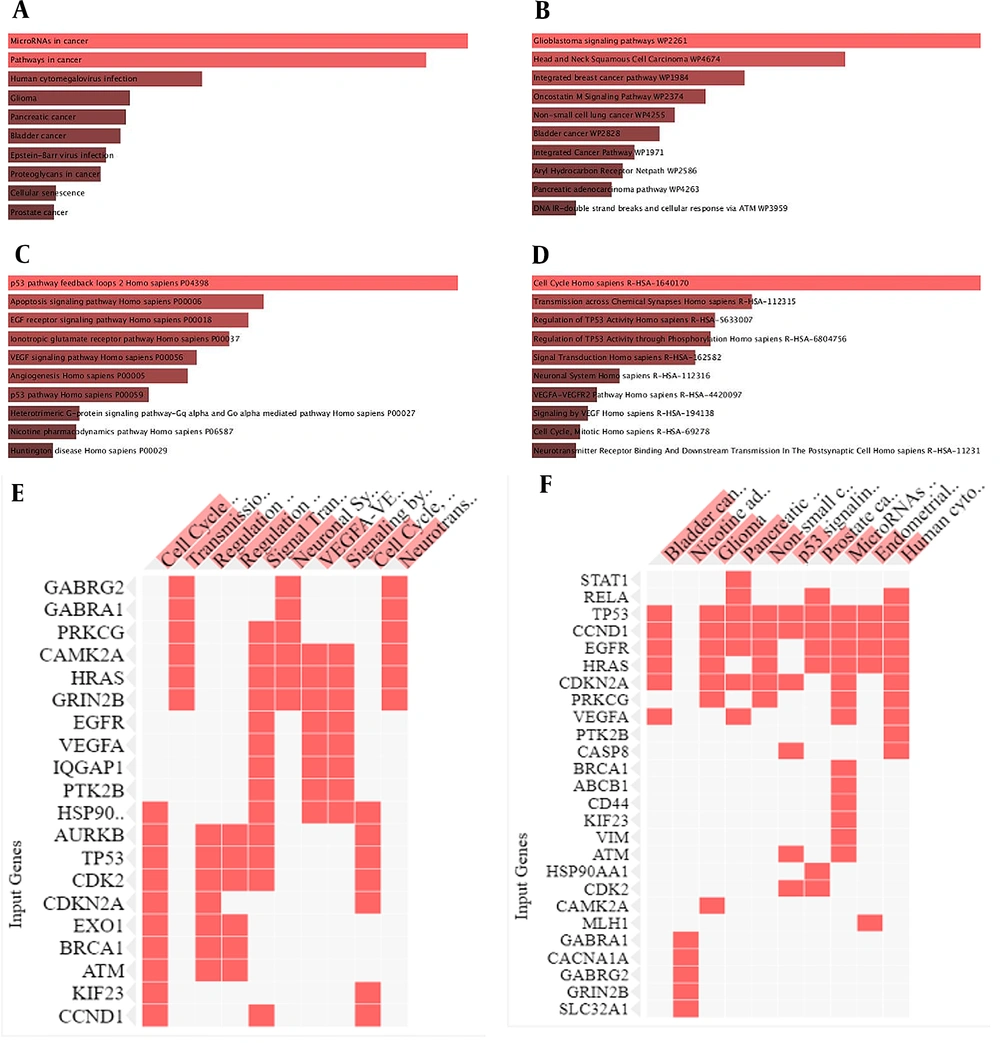
Major molecular signaling pathways are attributed to hub genes. A – F, Hub genes were analyzed using the Enrich r intelligent server. The genes played a role in a variety of processes, including cellular senescence, the P53 pathway feedback loop, apoptosis, EGF receptor signaling, vascular endothelial growth factor (VEGF) signaling, angiogenesis, transmission across a chemical synapse, neurotransmitter receptor binding, and downstream transmission in the postsynaptic cell. Major molecular signaling pathways collaborate with hub genes in the pathogenesis of GBM.
4.2. Qualities of Nanoliposomes
| Zeta Potential (mV) | Mobility (μmcm/Vs) | DLS Test (nm) | Nanoliposome Average Size (nm) |
|---|---|---|---|
| -3 - 39 | -0.2655 | 60 - 600 | 100 |
4.3. Swimming Training and Nanoliposomes Enriched Combined Supplement Regulated the Inflammasome Activation
![Swimming training and nanoliposomes enriched combined supplement improved gene expressions. a-d: the relative expression of IL-10, Casp8, P53, and Hras [data expressed as mean ± SD. + indicates statistically significant difference with normal group, * indicates statistically significant difference with Model group, @ indicates statistically significant difference with Model + Liposome group, # indicates statistically significant difference with Model + EXE group, & indicates statistically significant difference with model + extract group, ! indicates statistically significant difference with model + liposomal extract group, ^ indicates statistically significant difference with model + exe + extract group, $ indicates statistically significant difference with model + exe + liposomal extract. The data were calculated by one-way analysis of variance (ANOVA) with Tukey's post hoc test. The effects of the intervention and the interaction effects of the interventions were detected based on the two-way analysis of variance (ANOVA) with Tukey's post hoc test due to multiple comparisons].](https://brieflands.com/journals/mcj/articles/131461/figures/mcj-131461-i003-F3-preview.webp "Swimming training and nanoliposomes enriched combined supplement improved gene expressions. a-d: the relative expression of IL-10, Casp8, P53, and Hras [data expressed as mean ± SD. + indicates statistically significant difference with normal group, * indicates statistically significant difference with Model group, @ indicates statistically significant difference with Model + Liposome group, # indicates statistically significant difference with Model + EXE group, & indicates statistically significant difference with model + extract group, ! indicates statistically significant difference with model + liposomal extract group, ^ indicates statistically significant difference with model + exe + extract group, $ indicates statistically significant difference with model + exe + liposomal extract. The data were calculated by one-way analysis of variance (ANOVA) with Tukey's post hoc test. The effects of the intervention and the interaction effects of the interventions were detected based on the two-way analysis of variance (ANOVA) with Tukey's post hoc test due to multiple comparisons].")
Swimming training and nanoliposomes enriched combined supplement improved gene expressions. a-d: the relative expression of IL-10, Casp8, P53, and Hras [data expressed as mean ± SD. + indicates statistically significant difference with normal group, * indicates statistically significant difference with Model group, @ indicates statistically significant difference with Model + Liposome group, # indicates statistically significant difference with Model + EXE group, & indicates statistically significant difference with model + extract group, ! indicates statistically significant difference with model + liposomal extract group, ^ indicates statistically significant difference with model + exe + extract group, $ indicates statistically significant difference with model + exe + liposomal extract. The data were calculated by one-way analysis of variance (ANOVA) with Tukey's post hoc test. The effects of the intervention and the interaction effects of the interventions were detected based on the two-way analysis of variance (ANOVA) with Tukey's post hoc test due to multiple comparisons].
4.4. Swimming Training Along with Nanoliposomes Enriched Combined Supplement Modified P53 and Hras Expression
| Groups | IL-10 | P-Value | Casp8 | P-Value | P53 | P-Value | Hras | P-Value |
|---|---|---|---|---|---|---|---|---|
| Normal | 0.98 ± 0.038 | 1.015 ± 0.13 | 1.054 ± 0.09 | 1.05 ± 0.09 | ||||
| Model | 7.66 ± 0.68 b | < 0.0001 | 9.06 ± 0.71 b | < 0.0001 | 0.112 ± 0.02 b | < 0.0001 | 0.04 ± 0.03 b | < 0.0001 |
| Model + lipo | 7.33 ± 0.31 c | 0.9987 | 9 ± 0.6 c | > 0.9999 | 0.114 ± 0.019 c | > 0.9999 | 0.043 ± 0.02 | > 0.9999 |
| Model + exe | 6.33 ± 0.15 c | 0.0253 | 7.333 ± 0.15 c | 0.0009 | 0.31 ± 0.03 c | < 0.0001 | 0.35 ± 0.039 c | < 0.0001 |
| Model + extract | 5.2 ± 0.26 c | < 0.0001 | 6.2 ± 0.26 c | < 0.0001 | 0.3933 ± 0.03 c | < 0.0001 | 0.43 ± 0.042 c | < 0.0001 |
| Model + lipo-extract | 3.33 ± 0.42 c | < 0.0001 | 4.6 ± 0.3 c | < 0.0001 | 0.5367 ± 0.05 c | < 0.0001 | 0.55 ± 0.03 c | < 0.0001 |
| Model + extract-exe | 2.07 ± 0.21 c | < 0.0001 | 3.333 ± 0.42 c | < 0.0001 | 0.68 ± 0.03 c | < 0.0001 | 0.75 ± 0.045 c | < 0.0001 |
| Model + lipo-extract + exe | 1.53 ± 0.32 c | < 0.0001 | 2.5 ± 0.4 c | p < 0.0001 | 0.8433 ± 0.04 c | < 0.0001 | 0.88 ± 0.04 c | < 0.0001 |
a Values are expressed as mean ± SD.
b A statistically significant difference with the normal group.
c Indicates a statistically significant difference with the model group.
4.5. Nerve Function was Improved by Swimming Training Along with Nanoliposomes Enriched Combined Supplement
![The effect of swimming training and nanoliposomes enriched combined supplement on the behavior tests [data are expressed as mean ± SD. + indicates statistically significant difference with Normal group, * indicates statistically significant difference with model group, @ indicates statistically significant difference with model + liposome group, # indicates statistically significant difference with model + exe group, & indicates statistically significant difference with model + extract group, ! indicates statistically significant difference with model + liposomal extract group, ^ indicates statistically significant difference with model + exe + extract group, $ indicates statistically significant difference with model + exe + liposomal Extract. The data were calculated by one-way analysis of variance (ANOVA) with Tukey's post hoc test. The effects of the intervention and the interaction effects of the interventions were detected based on the two-way analysis of variance (ANOVA) with Tukey's post hoc test due to multiple comparisons].](https://brieflands.com/journals/mcj/articles/131461/figures/mcj-131461-i004-F4-preview.webp "The effect of swimming training and nanoliposomes enriched combined supplement on the behavior tests [data are expressed as mean ± SD. + indicates statistically significant difference with Normal group, * indicates statistically significant difference with model group, @ indicates statistically significant difference with model + liposome group, # indicates statistically significant difference with model + exe group, & indicates statistically significant difference with model + extract group, ! indicates statistically significant difference with model + liposomal extract group, ^ indicates statistically significant difference with model + exe + extract group, $ indicates statistically significant difference with model + exe + liposomal Extract. The data were calculated by one-way analysis of variance (ANOVA) with Tukey's post hoc test. The effects of the intervention and the interaction effects of the interventions were detected based on the two-way analysis of variance (ANOVA) with Tukey's post hoc test due to multiple comparisons].")
The effect of swimming training and nanoliposomes enriched combined supplement on the behavior tests [data are expressed as mean ± SD. + indicates statistically significant difference with Normal group, * indicates statistically significant difference with model group, @ indicates statistically significant difference with model + liposome group, # indicates statistically significant difference with model + exe group, & indicates statistically significant difference with model + extract group, ! indicates statistically significant difference with model + liposomal extract group, ^ indicates statistically significant difference with model + exe + extract group, $ indicates statistically significant difference with model + exe + liposomal Extract. The data were calculated by one-way analysis of variance (ANOVA) with Tukey's post hoc test. The effects of the intervention and the interaction effects of the interventions were detected based on the two-way analysis of variance (ANOVA) with Tukey's post hoc test due to multiple comparisons].
| Groups | Sciatic Functional Index | P-Value | Beam Test | P-Value |
|---|---|---|---|---|
| Normal | -22.0 ± 2.646 | 20.67 ± 2.082 | ||
| Model | -75.33 ± 5.132 b | < 0.0001 | 2.9 ± 0.3606 b | < 0.0001 |
| Model + liposome | -74.33 ± 4.04 c | > 0.9999 | 3.233 ± 0.2309 | 0.9996 |
| Model + exe | -60.0 ± 2.0 c | 0.0002 | 6.250 ± 0.3536 c | 0.0100 |
| Model + extract | -54.33 ± 2.3 c | < 0.0001 | 7.333 ± 0.2887 c | 0.0002 |
| Model + liposomal extract | -46.33 ± 3.055 c | < 0.0001 | 10.50 ± 0.5 c | < 0.0001 |
| Model + exe + extract | -37.0 ± 1.0 c | < 0.0001 | 13.07 ± 0.4041 c | < 0.0001 |
| Model + exe + liposomal extract | -27.33 ± 0.58 c | < 0.0001 | 16.0 ± 0.5 c | < 0.0001 |
a Values are expressed as mean ± SD.
b A statistically significant difference with the normal group.
c A statistically significant difference with the model group.
| Groups | One Week | Two Week | Three Week | Four Week | Five Week | Six Week | P-Value |
|---|---|---|---|---|---|---|---|
| Normal | 232 ± 4.6 | 235 ± 3.4 | 235 ± 6.2 | 240 ± 6.1 | 244 ± 2.5 | 250 ± 5.2 | |
| Model | 230 ± 5.4 | 227 ± 1.5 | 224 ± 2.6 | 220 ± 3.9 | 221 ± 4.4 | 215 ± 1.1 b | < 0.0001 c |
| Model + liposome | 229 ± 3.2 | 228 ± 2.1 | 226 ± 1.4 | 223 ± 2.7 | 219 ± 3.2 | 216 ± 2.7 | 0.8990 c |
| Model + exe | 231 ± 2.6 | 232 ± 1.6 | 234 ± 2.2 | 235 ± 3.1 | 237 ± 2.9 | 239 ± 2.1 d | < 0.0001 c |
| Model + extract | 230 ± 3.6 | 232 ± 2.7 | 233 ± 3.1 | 234 ± 1.9 | 236 ± 4.1 | 238 ± 2.56 d | < 0.0001 c |
| Model + liposomal extract | 229 ± 5.1 | 231 ± 3.5 | 234 ± 4.1 | 236 ± 3.2 | 239 ± 2.3 | 240 ± 3.3 d | < 0.0001 c |
| Model + exe + extract | 228 ± 4.32 | 231 ± 3.5 | 234 ± 4.1 | 236 ± 3.2 | 237 ± 2.3 | 243 ± 3.65 d | < 0.0001 c |
| Model + exe + liposomal extract | 229 ± 4.96 | 231 ± 3.5 | 234 ± 4.1 | 238 ± 3.2 | 243 ± 2.3 | 247 ± 1.2 d | < 0.0001 c |
a Values are expressed as mean ± SD.
b A statistically significant difference with the normal group.
c The data were calculated by one-way ANOVA with repeated measures followed by Tukey's post hoc.
d Indicates a statistically significant difference with the model group.


