


1. Background
Gastroesophageal reflux disease (GERD) is one of the most common chronic gastrointestinal diseases in Oriental and Western countries (1). The prevalence of GERD is reported to be on the rise in Iran (2, 3). Recent studies reported that up to 70% of reflux patients have common reflux symptoms (i.e., regurgitation and/or heartburn) in the lack of endoscopically visible esophageal mucosal injuries, making nonerosive reflux disease as a more common form of GERD. Heartburn and acid regurgitation are regarded as common reflux symptoms with high specificity and sensitivity for the diagnosis of GERD. However, patients with GERD also frequently report different dyspeptic symptoms (4, 5). Lately, various reports have corroborated that along with dyspepsia further exacerbates quality of life in patients with GERD. Therefore, an ideal pharmacological agent in the treatment of GERD should pose therapeutic effects not only on reflux symptoms but also on dyspepsia (6).
Functional dyspepsia (FD) is one of the most common gastrointestinal disturbances (7). Lately, FD has been sub-classified into two new disease categories under the Rome III classification, including epigastria pain syndrome (EPS) and postprandial distress syndrome (PDS) (8). FD is believed to be affected by multiplex mechanisms (9). Impaired gastric motor activities and delayed gastric emptying (10-12) are the feasible causative mechanisms (13).
Diagnostic measures for functional dyspepsia include one or more symptoms of troublous postprandial fairy, early satiation, and epigastric burning. Also, no proof of structural disease that is probably to describe the symptoms criteria for the last three months with symptom onset at least six months former to diagnosis (14, 15).
However, data mining techniques have been developed to uncover useful patterns in high-dimensional data. The decision tree is one of the strongest and most common tools for categorizing and predicting data. Its flowchart structure helps users better understand the results of forecasting and classification in the matter raised (16). The logistic regression is one of the most generally used models for classification and prediction and often used as a method to predict the outcomes of the two or more levels; it is also applied extensively in epidemiological studies (17, 18). It is interesting to compare the diagnostic performance of logistic regression and decision tree models.
2. Objectives
Therefore, due to the growing prevalence of FD and GERD in developing countries, this study aimed to predict the symptoms in patients with FD and GERD using logistic regression (LR) and decision tree (DT) models based on the data from large observations.
3. Methods
A cross-sectional study was conducted from April 2016 to October 2017 in Tehran province to determine the prevalence of functional disorders (4, 19) and gastrointestinal symptoms (18, 20). Totally 18,180 adults were selected randomly from five cities including Tehran, Firoozkouh, Varamin, Pakdasht, and Damavand, as well as their rural areas.
A questionnaire was designed to record characteristics such as sex, age, and education level. Moreover, we asked participants about 11 gastrointestinal (GI) symptoms such as anorexia/weight loss, constipation, abdominal pain/discomfort, bloating, heartburn, proctalgia, diarrhea, bloody or black stool, difficulty of swallowing, fecal incontinence, and nausea/vomiting. Subjects without any of the above symptoms participated in the second interview. This part of the questionnaire included questions on various gastrointestinal disorders. Some demographic and clinical variables were included in the analysis. The number and the name of variables were the same in the two models (LR and DT) but important variables were only reported in DT.
3.1. LR
The customary variable screening methods of the LR include the stepwise and best subset method, the forward-entry method, and the backward elimination method (19). The last three procedures control selecting α, in which the cutoff is where the variables are entered into the model and/or are eliminated. In this study, to screen variables early and easily, the best subset method was combined with AIC (Akaike Information Criterion). Hence, we constructed an LR model that performed better in screening procedures.
3.2. DT
A DT is a structure formed by a limited number of “nodes” connected by “branches” and finally the “leaves” that specify the target variable. DTs are built recursively, following a descending strategy. The root node (which contains all of the data), is divide by two branches based on an independent variable that creates the best homogeneity. Therefore, it is important to make a suitable and well-fitted tree. In large datasets, a DT can be made quickly by the expansion method, but in limited datasets, it is particularly critical to avoid overfitting that to apply as much data as possible (4). Concerning the issue, to build a suitable DT model, we combined the classification and regression tree.
3.3. Method for Assessing the Performance
The applied sample may not be indicative of training. In addition, the model may be related to the ratio of testing to training data. A more effective alternative is the k-fold cross-validation procedure (19).
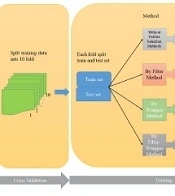
3.4. Cross-Validation
In our study, we used 2 - 10-fold stratified cross-validation to measure the generalization error of methods. In summary, for example, the stratified cross-validation method was presented by five-fold cross-validation. In the first step, the data were split into five sections. In the second step, four of the five folds were used for training and the remnant was used for testing. In the next step, the process was repeated five times in such a way that each observation could be applied as training and testing samples. Therefore, the predictive probability of FD and GERD for all observations was gained after testing. Finally, the areas under the ROC curves were obtained by probability. To achieve a valid estimation of error, 10 - 100 times of 2 - 10-fold stratified cross-validation were applied to provide the efficiency in accordance with the variation in the AUC.
We used four performance criteria including accuracy, sensitivity, specificity, and AUC, as follows:
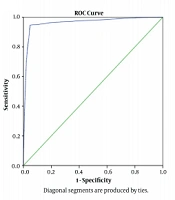
TN, TP, FN, and FP denote true negative, true positive, false negative, and false positive, respectively. LR and DT were compared with each other using AUC criteria in the ROC curve. An accurate model would attain to (0, 1) point in the ROC curve (showing the sensitivity and specificity for the full range of cutoff values) where both of them were equal to one.
3.5. Statistical Analysis
All statistical analyses were carried out using SPSS version 21 software. Multiple logistic regression and decision tree were done to predict FD and GERD. A P value of 0.05 or less was considered statistically significant.
4. Results
Overall, 18,180 subjects participated in this study. The response rate was about 92%. There were 9,072 (48.9%) women among the participants. Most participants were in the age group of 16 - 29 years in both male and female groups. The mean age of men and women was 38.9 ± 17.4 and 38.4 ± 16.7 years, respectively (P < 0.001) and most of them (36.8%) had below diploma degrees (Table 1).
Table 1.The Prevalence of FD and GRED by Characteristics and Symptoms According to Rome III Criteria
| FD, % | GRED, % | Total, No. (%) | |
|---|---|---|---|
| Frequency | 0.2 | 1.5 | 18180 |
| Gender | |||
| Male | 0.2 | 1.4 | 9108 (50.1) |
| Female | 0.3 | 1.7 | 9072 (49.9) |
| Age | |||
| < 40 | 0.2 | 0.9 | 12235 (67.3) |
| 40 - 60 | 0.7 | 2.8 | 3962 (21.8) |
| > 60 | 0.6 | 3.5 | 1980 (10.5) |
| Level of Education | |||
| Illiterate | 0.4 | 1.4 | 4763 (26.2) |
| Below diploma | 0.4 | 1.1 | 6690 (36.8) |
| High school diploma | 0.4 | 2.1 | 4072 (22.4) |
| University education | 0.5 | 2.6 | 2290 (12.6) |
| Master or higher | 0 | 0.5 | 360 (2) |
| Marital status | |||
| Married | 0.5 | 2.3 | 9362 (51.5) |
| Never married | 0.2 | 0.5 | 8000 (44) |
| Widowed | 0.6 | 3.4 | 590 (3.3) |
| Divorced | 2.8 | 5.5 | 72 (0.4) |
| Abdominal pain | 0.6 | 8.7 | 1196 (6.5) |
| Constipationa | 2.3 | 6.8 | 1145 (6.3) |
| Diarrheaa | 11.1 | 11.5 | 252 (1.4) |
| Bloatinga | 2.2 | 13.4 | 1610 (8.8) |
| Heartburna | 2 | 8.3 | 1584 (8.7) |
| Nausea/vomiting | 2.5 | 6.7 | 238 (1.3) |
| Weight lossa | 1.9 | 8.6 | 315 (1.7) |
| Dysphagia | 2 | 8.5 | 153 (0.8) |
| Fecal incontinencea | 1.9 | 11.1 | 54 (0.3) |
| Functional dyspepsiab | 1.2 | - | 1621 (8.9) |
Abbreviation: FD, functional dyspepsia.
aSelf-reported symptoms.
bFunctional dyspepsia is defined based on Rome III.
4.1. LR
We included risk factors associated with FD in the multiple logistic regression analysis. They were age, sex, heartburn, abdominal pain, nausea vomiting, anal pain, abdominal surgery, self-reported constipation, bloating, and diarrhea (Table 2). Symptoms such as abdominal pain, heartburn, diarrhea, self-reported constipation, and bloating were the principal predictors of GERD (Table 3).
Table 2.Results of Variable Selection and LR Method for FD
| Variable | β | SE | χ2 | P Value | OR | 95% CI | |
|---|---|---|---|---|---|---|---|
| Lower | Upper | ||||||
| Gender | |||||||
| Male | 0.480 | 0.076 | 39.421 | 0.000 | 1.616 | 1.391 | 1.877 |
| Female (ref.) | |||||||
| Abdominal surgery | -0.045 | 0.083 | 0.296 | 0.586 | 0.956 | 0.813 | 1.124 |
| Abdominal pain | 1.351 | 0.095 | 204.262 | 0.000 | 3.861 | 3.208 | 4.647 |
| Constipation | 1.385 | 0.095 | 214.235 | 0.000 | 3.994 | 3.318 | 4.807 |
| Diarrhea | 0.963 | 0.190 | 25.563 | 0.000 | 2.618 | 1.803 | 3.802 |
| Bloating | 1.534 | 0.089 | 294.323 | 0.000 | 4.635 | 3.890 | 5.523 |
| Heartburn | 2.131 | 0.087 | 603.750 | 0.000 | 8.422 | 7.106 | 9.982 |
| Nausea/vomiting | 0.312 | 0.182 | 2.945 | 0.086 | 1.366 | 0.957 | 1.951 |
| Age | 0.102 | 0.023 | 19.899 | 0.000 | 1.107 | 1.059 | 1.158 |
Table 3.Results of Variable Selection and LR Method for GERD
| Variable | β | SE | χ2 | P Value | OR | 95% CI | VIF | |
|---|---|---|---|---|---|---|---|---|
| Lower | Upper | |||||||
| Gender | ||||||||
| Male | 0.373 | 0.086 | 18.796 | 0.000 | 1.453 | 1.227 | 1.720 | 1.49 |
| Female (ref.) | ||||||||
| Abdominal surgery | -0.071 | 0.095 | 0.558 | 0.455 | 0.932 | 0.773 | 1.122 | 1.73 |
| Abdominal pain | 1.507 | 0.114 | 174.666 | 0.000 | 4.514 | 3.610 | 5.644 | 1.22 |
| Constipation | 1.900 | 0.114 | 276.277 | 0.000 | 6.685 | 5.343 | 8.363 | 2.09 |
| Diarrhea | 0.508 | 0.227 | 5.024 | 0.025 | 1.662 | 1.066 | 2.592 | 1.84 |
| Bloating | 1.290 | 0.105 | 151.699 | 0.000 | 3.634 | 2.959 | 4.462 | 2.18 |
| Heartburn | 3.429 | 0.097 | 1252.719 | 0.000 | 30.848 | 25.513 | 37.298 | 1.88 |
| Nausea/vomiting | 0.854 | 0.229 | 13.951 | 0.000 | 2.349 | 1.501 | 3.676 | 2.55 |
| Age | 0.076 | 0.026 | 8.502 | 0.004 | 1.079 | 1.025 | 1.136 | 3.02 |
The results showed that females had a higher risk of GERD than males, but not for FD. Being married was related to a reduction in the risk of GERD and FD. According to the results, we found collinear diagnosis in independent variables and there was powerful collinearity between some of them (Table 3). By variable clustering, variable heartburn was picked out and entered into the model. Although some variables were excluded, some others such as constipation were entered into the model. Therefore, qualitative variables entered the model as dummy variables and continuous variables entered the model with archetype. Variables also were selected by forward, backward, and stepwise methods. Accordingly, nine variables (sex, abdominal surgery, abdominal pain, constipation, diarrhea, bloating, heartburn, nausea/vomiting, and age) were fitted into the model. The goodness-of-fit test was done by the chi-square test that showed the LR model denoted a great fit (χ2 = 5.7824, P = 0.6716, AIC = 318.97).
4.2. DT
We calculated the importance values of the tree. The importance variables were heartburn, dyspepsia full, dyspepsia-sat, pain, and bloating in FD (Figure 1B) and variables including dyspburn, heartburn, bloating, pain, and abdominal surgery in GERD (Figure 2).
")
Figure 1.
ROC curves for GRED and FD in LR and DT, respectively (left to right)

Figure 2.
CHAID tree for GERD
4.3. Model Construction
In this study, the cases were 18,180 observations. We used the CHAID (chi-square automatic interaction detector) tree by a 10-fold stratified cross-validation method for FD and GERD variables that was applied to specify the P value cutoff. The P values were 0.043, 0.053, and 0.046 respectively for 5-fold, 6-fold, and 7-fold cross-validations. Finally, the P value was 0.053. So, to construct a CHAID tree, we used this value. The obtained results for both responses (and) were obtained as AUC = 0.98, accuracy = 94.0%, sensitivity = 90.8%, and specificity = 96.2% for FD and AUC = 0.93, accuracy = 89.0%, sensitivity = 84.6%, and specificity = 90.6% for GERD (Figures 2 and 3).

Figure 3.
CHAID tree for FD
5. Discussion
Gastrointestinal symptoms are very common in the population, with the majority of patients having FD or GERD. Patients suffering from regurgitation and/or symptomatic heartburn in the absence of esophageal mucosal abnormalities and without dyspepsia are clinically classified as GRED (5, 14, 21).
Our results showed that the predicting performance for FD patients was lower by the DT model than by the LR model (Figure 1B and C), which is less usual in the general population compared to former reports (14); it was more common among women and for all subgroups of FBD except for FD (22). In this study, FD had a low prevalence. It was reported by 8.5% and 4.8% of people all over Canada and the United States, respectively (13, 22). On the other hand, a study in Israeli on 981 subjects showed an FD prevalence of 0.6% (23). The prevalence of FD was reported as 2% in 1,023 gastroenterology outpatients in the Iranian population (24).
Our results also showed that the predicting performance for GERD patients was lower by the DT model than by the LR model (Figure 1A and D). The discrepancy may be related to the structure of the data. One basic discrimination between the DT and LR models is that they learn step functions and continuous functions, respectively. Therefore, the LR is more appropriate and more applicable to the data. Hence, after the logistic transformation, the correlation between independent and dependent variables became linear. Therefore, the predictive performance of these models was associated with the correlation of variables. The LR does not have better performance when there is a nonlinear relationship between dependent and independent variables without considering logistic transformation. When there is a step function association among variables, using the DT model for the prediction or classification is more comparative (9).
Most FD patients complain of various symptoms related to foods although the pathophysiology of these diseases remains weakly defined (25, 26). Studies have reported different abnormalities in FD patients that might account for its pathophysiology, including, gastric hypersensitivity to distention, and impaired base accommodation (27).
Reflux symptoms, including, acid regurgitation, and heartburn are considered to be major symptoms of GERD and they are used for treatment monitoring and disease diagnosis. Reflux symptoms are mainly caused by gastric contents (28). Patients with GERD are reported to have different dyspeptic symptoms and reflux symptoms (29, 30).
In this study, most GERD patients reported reflux symptoms. The reflux symptoms were along with multiple dyspeptic symptoms. This result supports the concept that different types of dyspeptic and reflux symptoms can be caused by gastric acid at least in part with several potential limitations.
Also, in this study, the symptoms experienced by FD patients were not as severe as those experienced by GERD patients. In our study, patients with intense heartburn were more than those with reflux disease. Also, as reported by other researchers, patients with reflux disease had similar dyspeptic symptoms (31). This offers the importance of dyspepsia in the treatment of patients with GERD.
In summary, this article proposed theoretical instruction to choose a practical decision method. In addition, we presented practical examples of comparisons. These outcomes also demonstrated that when we are using models to the study sample that was drawn from the population, the external validation of the compared models is essential to get a precise measure of performance (by applying statistical procedures like cross-validation).
5.1. Conclusions
This study indicated how to develop LR and DT models for GERD and FD. The decision tree used in this paper was not too complicated to interpret because of having a few leaves, while the non-transformed LR model did not perform better than the DT model. Therefore, according to the obtained results, we recommend using the non-transformed logistic regression model.
Footnotes