
1. Background
Numerous people around the world suffer from memory disorders. Alzheimer's disease (AD) is a typical age-dependent neurodegenerative disease accompanied by memory impairment and cognitive disorder (1). The precise etiology of AD is not well known, but an abnormal accumulation of β-amyloid (Aβ), tau protein hyperphosphorylation, and acetylcholinesterase, oxidative stress, and increased neuroinflammation are accompanied by AD (1-5). Aβ plaques aggregate in extracellular matrix while abnormal deposits of tau proteins result in intracellular neurofibrillary tangles formation. The histopathological changes in AD commonly occur in the hippocampus and brain cortex (6, 7).
Scopolamine (Scop) is widely used for induced AD-like dementia in animal models (4). Memory impairment induced by Scop could be associated with altered oxidative stress, cholinergic neurons dysfunction, cell differentiation, and apoptosis (4, 8-10), which explains a relationship between memory disorders and oxidative stress (11-14). Induced oxidative stress results in the development of AD (11). The brain requires high oxygen and glucose and is susceptible to generating reactive oxygen species (ROS) (14). Nitric oxide (NO) plays an essential role in physiological and pathophysiological processes. Nitric oxide and ROS cause neuroinflammation and can lead to neurodegenerative diseases (13-16). Inducible nitric oxide synthase (iNOS) overexpression and increased NO levels are involved in AD pathophysiology (17-20). It is suggested that the inhibition of iNOS may effectively improve AD (13, 17). Amino guanidine (Amg) has several biological activities such as oxidative stress inhibition, inflammation suppression, iNOS inhibition, and neurodegeneration reduction (9, 17-19). Nitric oxide overproduction can be partly responsible for some neurodegenerative damages in AD (9, 13). Amg is an essential inhibitor of iNOS that can prevent the excessive production of NO. It has been previously shown that iNOS results in the increased synthesis of NO and pro-inflammatory cytokines, which accelerates cell death and memory deficit (21). iNOS inhibitors improve spatial memory through their modulatory role (16-19). Chen et al. demonstrated that Amg by reducing the expression levels of ROS, NO, iNOS, and cyclooxygenase‑2 (COX‑2) prevented Aβ-induced AD (19). Amg can reverse the dysfunction of the cholinergic system and improve spatial memory by its modulatory role (21).
Beheshti et al. exhibited that Amg has protective effects against LPS-induced memory loss and decreased Aβ and oxidative stress (11, 16). A recent study showed that Amg has protective effects against ovariectomy-induced memory defect and Aβ production disorder (22). Other studies have shown that one month of Amg injection improves memory by modulating Bcl-2 expression in diabetic rats (23, 24). Asghari et al. indicated that Amg reversed neuronal dysfunction and brain damage due to titanium dioxide and decreased the number of terminal deoxynucleotidyl transferase dUTP nick end labeling (TUNEL)-positive neurons in the CA1 and other hippocampus regions (25). It has been previously revealed that advanced glycation end products (AGEs) are involved in the pathogenesis of neurodegenerative disorders, including AD (26). Amg is a free radical scavenger, AGE, and oxidative stress inhibitor (17-19). Carnevale et al. demonstrated that Amg suppresses AGEs receptors in the brain, preventing Aβ deposition in the brain and reducing memory (27).
2. Objectives
This study was designed to investigate the effects of Amg treatment on memory impairment, histopathological changes, and cell apoptosis in the CA1 area of the hippocampus induced by Scop in male rats. We hypothesized that the administration of Amg decreases apoptosis in the hippocampus and improves memory impairment in AD.
3. Methods
3.1. Drugs
3.2. Experimental Animals
Thirty adults male Wistar rats (200 - 250 g) were maintained in the animal room of SEMUMS with free access to water and food and 12 hours of light-dark cycle at 23 - 25°C. This study was performed at Semnan University of Medical Sciences (SEMUMS) (code of ethics: IR. SEMUMS.139588). Every procedure was conducted according to the protocols of the SEMUMS Ethics Committee. The rats were divided into three groups as follows.
Saline-saline group (Saline + saline): The rats received intraperitoneal injection of 1 mg/kg of normal saline for 21 consecutive days.
Scopolamine-normal saline group (Scop + saline group): The rats received intraperitoneal injection of 3 mg/kg of Scop dissolved in saline for seven consecutive days, followed by daily intraperitoneal injection of normal saline for 14 days.
Scopolamine-aminoguanidine group (Scop + Amg group): The rats received intraperitoneal injection of 3 mg/kg of Scop dissolved in saline for seven consecutive days, followed by daily intraperitoneal injection of 100 mg/kg of Amg dissolved in saline for 14 days.
Then, the following experiments were performed for each group.
3.2.1. Learning and Spatial Memory Test
The Morris water maze test was used to study the animals' spatial memory and learning (11, 28, 29). The animals are were in a circular pool. It was a water-filled poll (22 - 25ºC) with a 1.5 to 2-cm escape platform under the water surface. Each animal was trained four trials per day, and the platform position remained constant for all the groups. A camera recorded the movements of the rats in the pool. The time latency (platform location latency), swimming speed, and length of the swimming were recorded. On the next day, all the rats were checked in order to evaluate the animals’ platform position memory. At this stage, the platform was lifted, and each animal was released from four directions into the Morris water maze apparatus to search the pool within 60 seconds. Finally, the distance traveled and the time spent in the target quadrant were measured and recorded.
3.2.2. Histopathological Study
For histopathological assessment, the rats were anesthetized, their brains were removed, and cresyl violet fast staining was carried out on the paraffin sections. Cresyl violet is a standard staining method for neurons. Briefly, the samples were processed by using a tissue processor apparatus (Auto Technicon). Hippocampal tissues sections with a 7-μm thickness were prepared according to Paxinos and Watson rat brain atlas (30), which were cut from the dorsal surface of the hippocampus, 3 mm to 4 mm posterior to the Bregma (6 Slices of each rat with 150 μm interval). Then, each of them was embedded in a paraffin block, and finally, the sections of the hippocampus were mounted on slides and were stained according to the cresyl violet protocol. The CA1 region of the hippocampus was selected, and the average normal pyramidal cell densities was determined by using a microscope (Nikon) with a grid eyepiece, a digital camera (Sony, Japan), and analysis software (Motic Images plus 2). In addition to glial cells, the hippocampus consists of 5 - 6 condense layers of pyramidal cells. The nuclei of the normal pyramidal cells with clearly visible nucleoli, well-defined nuclear membrane, and lightly colored cytoplasm were taken into consideration for measurement. The shrunken pyramidal cells with a dark cytoplasm, irregular boundaries, and pyknotic nucleus were considered degenerated cells (31-33).
3.2.3. TUNEL Technique
Apoptotic cells in the hippocampus were detected by the terminal deoxynucleotidyl transferase dUTP nick end labeling (TUNEL) assay. For the TUNEL assay, we used the In-Situ Cell Death Detection Kit (cat no. 11684795910, Roche, Germany) according to the manufacturer's instructions. Briefly, the sections were fixed in 4% formaldehyde and washed in PBS, incubated with proteinase Kin Tris–HCl buffer, washed in PBS, then labeled with TUNEL reaction mixture, and rinsed with PBS subjected to fluorescent counterstaining with DAPI. Nuclear DNA fragmentation in the CA1 area of the hippocampus was analyzed using a fluorescence microscope (Olympus, Japan).
3.3. Statistical analysis
Statistical analysis was performed by One-way analysis of variance (ANOVA) followed by Tukey’s test. All values were expressed as the mean ± SEM and were considered statistically significant at the level of P < 0.05.
4. Results
4.1. Memory Impairment Analysis
The spatial memory of the rats was assessed with the Morris water maze test. The platform location latency in the Scop + saline group was longer than the other groups (P < 0.01). It was found that Scop induced damage to spatial memory. Amg treatment significantly shortened the platform location latency in the target quadrant and the opposite area than in the Scop + saline group. In the Scop + saline group, time spent in the target quadrant was significantly lower than in other groups (P < 0.05). The spent time in the target quadrant was significantly increased in the Scop + Amg group than in the Scop + saline group, indicating the inhibition of Scop effects by Amg. In the Scop + saline group, the mean distance of the animal from the center of the platform was significantly longer than the other groups (P < 0.01), which suggests that Scop induced damage to spatial memory. Scop + Amg significantly reduced the spent time compared to Scop + saline (P < 0.05, Figures 1-3).
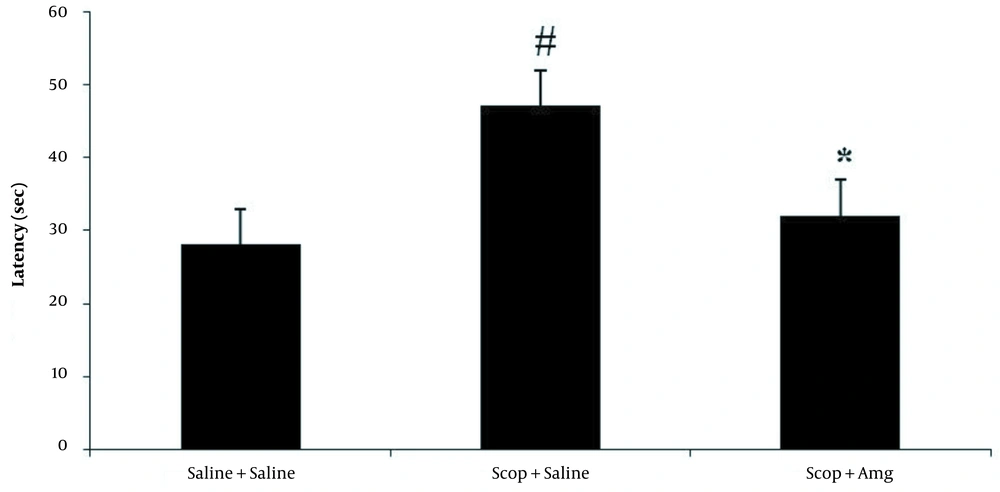
Figure 1.
Effect of aminoguanidine on time to find the location of the platform during probe testing in the Morris water Maze test in all the experimental groups. Data are shown as means ± SEM. # P < 0.01: Compared to Saline + saline group; * P < 0.05: Compared to Scopolamine + saline group.
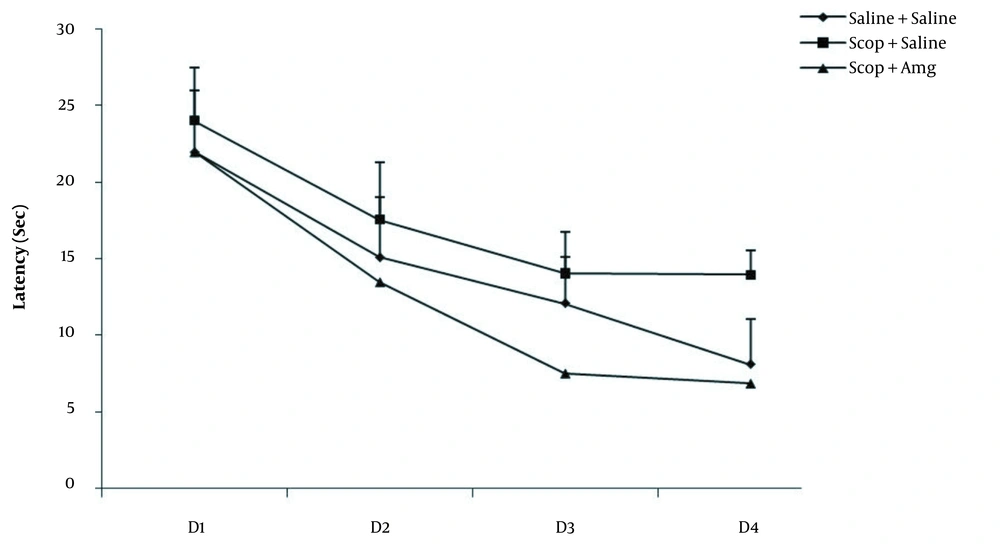
Figure 2.
Effect of treatment with normal saline or aminoguanidine (100 mg/kg) in the Morris water maze on the escape latency time
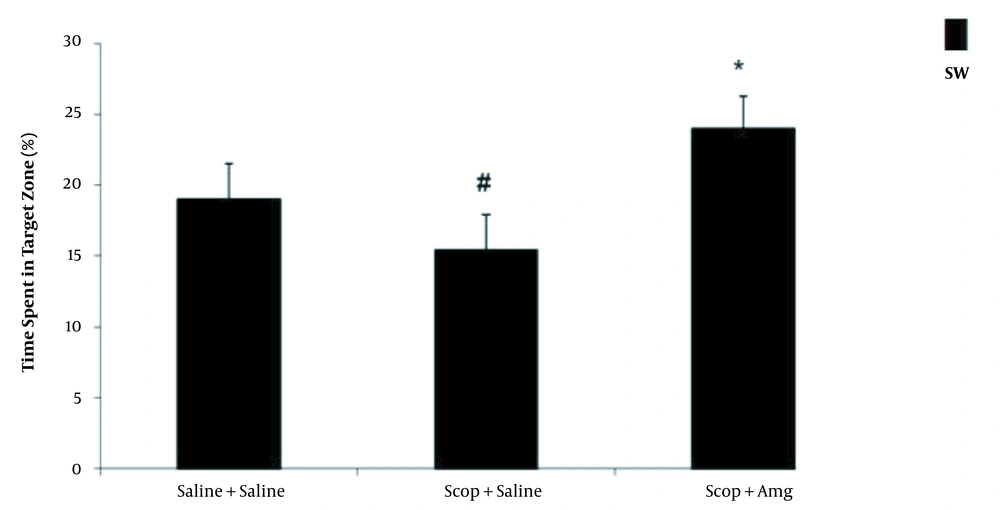
Figure 3.
Time spent in the target zone (SW) in the Morris water maze test for normal saline or aminoguanidine (100 mg/kg) treated rats. # P < 0.01: Compared to Saline + saline group; * P < 0.05: Compared to Scopolamine + saline group.
4.2. Histopathological Analysis
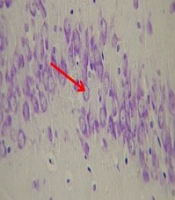
Cresyl violet staining was performed to demonstrate the density of pyramidal cells in the CA1 region of the hippocampus. Scopolamine significantly reduced the number of pyramidal cells in the CA1 area of the hippocampus compared to the saline + saline group (P < 0.01, Figure 2). In the Scop + Amg group, Amg administration significantly increased the pyramidal cells number in the hippocampal CA1 area (P < 0.05). Based on the results, Amg treatment in the Scop + Amg group could reverse the scopolamine-induced reduction of pyramidal cells in the CA1 hippocampus region (Figures 4 and 5).
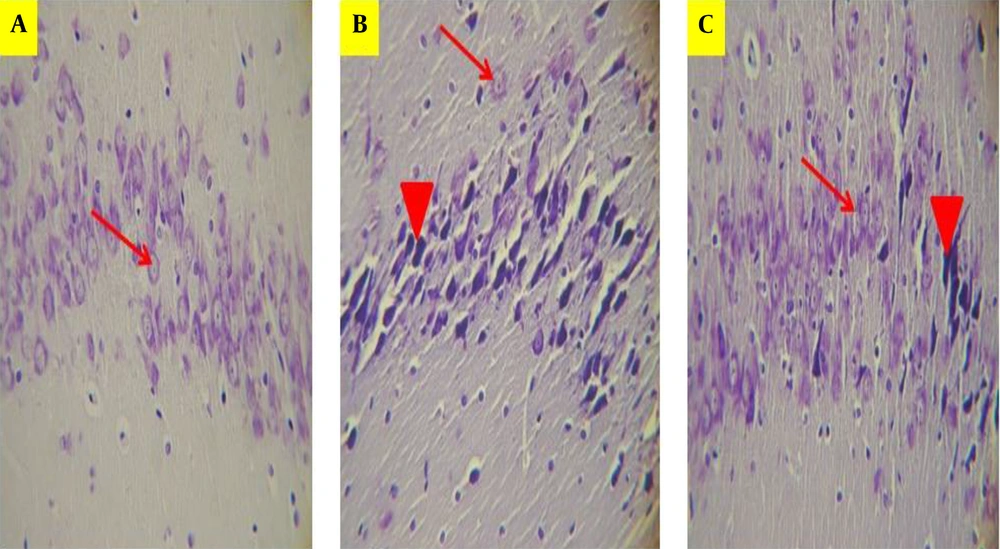
Figure 4.
Photomicrograph showing pyramidal cell layer in CA1 region of the hippocampus in Saline + saline (A), Scopolamine + saline (B), and Scopolamine + aminoguanidine groups (C). The normal pyramidal cells showing a prominent nucleolus, lightly colored cytoplasm, and a well-defined nuclear membrane. The shrunken pyramidal cells with a dark cytoplasm, irregular boundaries, and pyknotic nucleus indicating neurodegeneration. The arrows indicate the normal pyramidal cells, and arrow heads indicate shrunken pyramidal cells. (Cresyl Violet staining, magnification ×400).
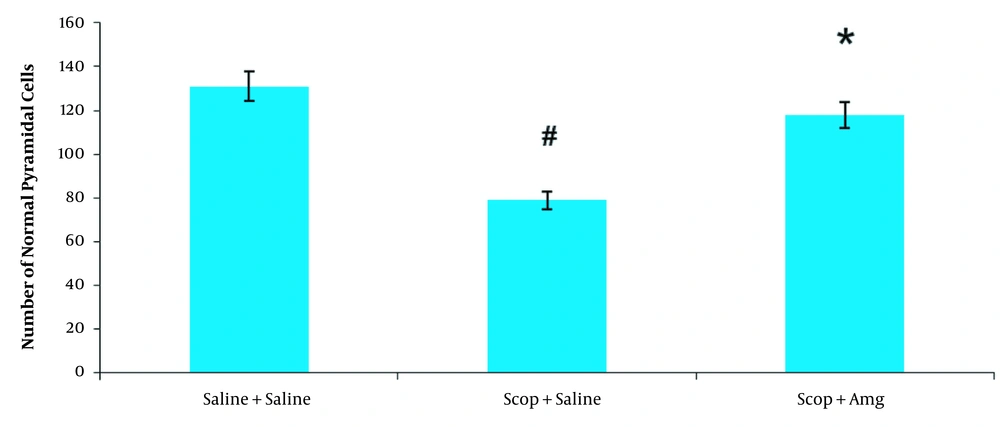
Figure 5.
The amount of normal pyramidal cells in the CA1 region of the hippocampus in the saline + saline, Scopolamine + saline, and scopolamine + aminoguanidine groups. N = 10 in each group. Data are shown as means ± SEM. # P < 0.01: Compared to Saline + saline group; * P < 0.05: Compared to Scopolamine + saline group.
4.3. Cell apoptosis Analysis
Cell apoptosis evaluation was conducted by the TUNEL assay. Positive cells in the hippocampal CA1 area were more abundant in the Scop + saline group than in the Saline + saline group (P < 0.05). Amg administration resulted in a decreased number of TUNEL-positive cells in the CA1 area of the hippocampus in the Scop + Amg group compared to the Scop + saline group (P < 0.05, Figures 6 and 7).
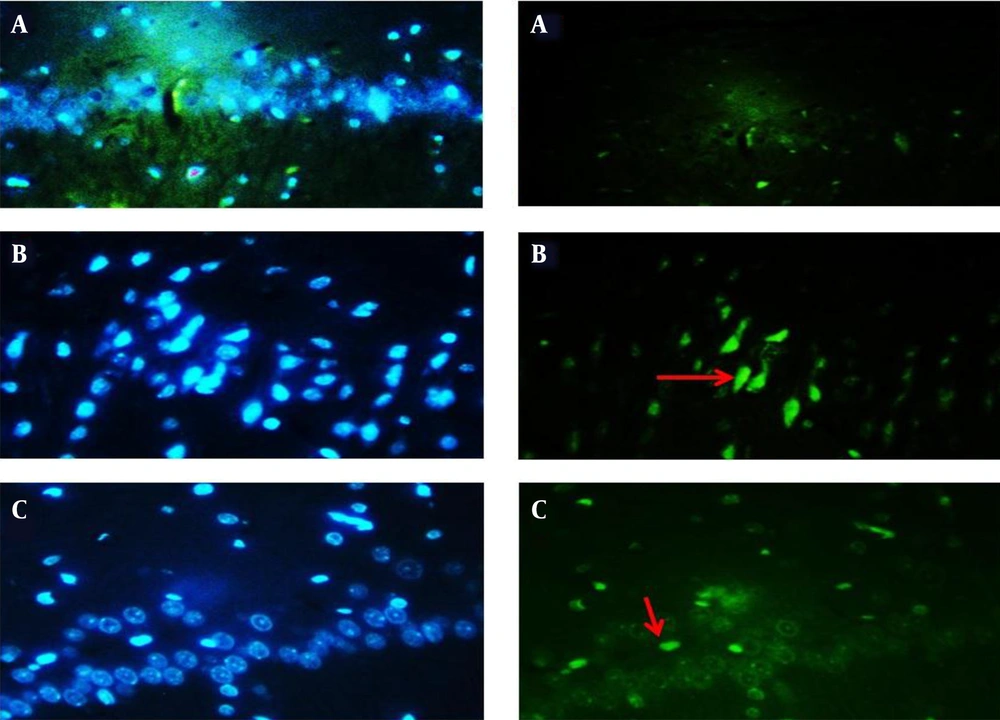
Figure 6.
Effect of scopolamine (3 mg/kg) and aminoguanidine (100 mg/kg) on apoptosis (cell death) in cells of the hippocampal CA1 region. TUNEL-positive cells in: Saline + saline (A), Scopolamine + saline (B), and Scopolamine + aminoguanidine groups (C). Green color indicates positive TUNEL cells in each group. The arrows indicate TUNEL-positive cells. (TUNEL staining, magnification ×200).
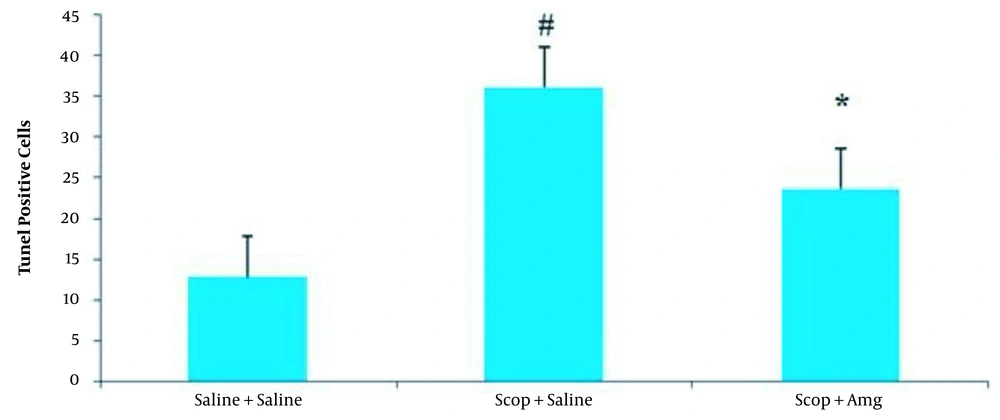
Figure 7.
Comparison of TUNEL-positive cells (amount of cell death) in rat CA1 cells in the Saline + saline, scopolamine + saline, and scopolamine + aminoguanidine groups. Values are shown as mean ± SEM. Ten animals in each group. # P < 0.05: Compared to saline + saline group; * P < 0.05: Compared to Scopolamine + saline group.
5. Discussion
In the current study, we evaluated the protective effects of aminoguanidine (Amg) treatment against cell apoptosis in the hippocampal CA1 region and memory impairment in an animal model of AD. Scop was used to induce dementia in rats. Scop blocked cholinergic signaling, induced oxidative stress in the brain, and increased acetylcholinesterase and malondialdehyde levels in the hippocampus leading to memory deficit and cognitive impairment (8, 10, 31). Scop induced memory impairment, cell differentiation, and neuronal apoptosis in the hippocampus (4, 31). This study showed that the injection of 3 mg/kg of Scop for one week led to memory impairment, reduced the number of pyramidal cells, and increased cell apoptosis in the hippocampal CA1 region, which indicates neurodegeneration in the hippocampus. The brain requires high oxygen and glucose, and it is susceptible to generating ROS (14). The imbalance between ROS and antioxidants may lead to oxidative stress (8). Oxidative stress has a reported relation with memory impairments and contributes to AD progression (11, 14). Advanced glycation end products participate in the pathological processes of AD, including neurotoxicity and the aggregation of Aβ (26). Advanced glycation end products are a primary source of neurotoxicity in AD, which is affected by Aβ formation via oxidative stress that increases cell apoptosis (34).
Amg is a free radical scavenger that could inhibit AGEs and protect against oxidative injury in the brain (11, 17, 19). Zhang et al. demonstrated that the neuroprotective effects of Amg can be attributed to the capability to reduce Aβ level and anti-AGEs activity (22). It has been shown that the interaction of AGEs with receptor for AGEs (RAGE) induces oxidative stress and inflammation in neurons (26). Kong et al. believed that RAGEs are increased in the brains of AD patients (35). Amg is a potent inhibitor of RAGE in the brain. Therefore, it prevents Aβ aggregation and memory impairment (22). Alikhani et al. disclosed that the intraperitoneal injection of Amg decreased oxidative stress indicators such as catalase, superoxide dismutase, and thiol in the brain and improved learning and memory impairments (36). Free radical scavenger effects of Amg could consequently decrease the inflammatory response and neuronal death (18). Tabrizian et al. studied the effects of four days intraperitoneal injection of Amg on sodium metavanadate-induced memory impairments. They found that Amg decreased the time and distance of finding the hidden platforms 48 hours after the last training session and decreased escape latency and traveled distance compared to the control group (37). Rodrigues et al. showed Amg administration significantly reduces the glial activation in the brain and prevents cognitive impairment in the streptozotocin (STZ) induced dementia model (38). Amg has many potential effects such as free radical scavenging, oxidative stress inhibition, inflammation suppression, iNOS expression reduction, and neurodegeneration (16-19). Also, Amg prevents the dysregulation of pro-inflammatory cytokines expression involved in chronic inflammatory processes (18). NO has essential roles in inflammation and pathologies like neurodegenerative diseases. In pathological conditions, the overexpression of iNOS produces large amounts of NO, which leads to lipid peroxidation and neuronal apoptosis (39). Amg is an iNOS inhibitor capable of suppressing inflammation and inhibition of Aβ accumulation (17, 20).
5.1. Conclusions
The present findings indicated that Scop administration resulted in memory impairment, reduced pyramidal cells, and increased cell apoptosis in the hippocampal CA1 area. These results showed that the intraperitoneal administration of Amg significantly decreased apoptotic cells in the hippocampal CA1 area and improved memory and spatial learning in the Scop-induced rat model of AD.