
1. Context
Neuroticism, one of the Big Five personality traits, has garnered considerable attention due to its profound implications for both physical and mental health (1, 2). It is characterized by a tendency to experience frequent and intense negative emotions, particularly in response to stressful situations, including anger, irritability, fear, worry, anxiety, and hostility (1, 3, 4). Recent evidence suggests that individuals with elevated neuroticism demonstrate heightened pain sensitivity, increased pain complaints, greater utilization of diagnostic tests, and a propensity for passive coping strategies (5, 6). Furthermore, neuroticism seems to be associated with the extensive use of therapeutic interventions in general health services (7, 8). Clinical studies have also identified a higher prevalence of neuroticism among patients with chronic fatigue syndrome, bodily distress syndrome, and functional somatic syndromes (9).
Fibromyalgia (FM) is a complex multifactorial chronic pain syndrome. Despite decades of investigation, its etiology and pathogenesis remain incompletely understood (10-12). FM is characterized by generalized musculoskeletal pain, hyperalgesia, and allodynia, accompanied by joint stiffness, sleep disturbances, fatigue, and muscle spasms (13-15). Additionally, FM frequently co-occurs with mental health disorders, including depression and anxiety (16).
While personality traits exert a significant influence on patient behavior, motivation, and medication adherence, their role has often been overlooked (17). Given the psychological aspects of pain experience, it is well-established that personality traits may impact an individual's vulnerability to various physical health problems (18). Notably, Naylor et al. emphasized that individuals with various chronic pain conditions tend to display significantly higher levels of neuroticism than their healthy counterparts (19). Neuroticism is a risk factor associated with the onset and development of somatic symptoms (20).
From an integrative biopsychosocial perspective on FM, personality may act as both a predisposing and perpetuating factor, increasing vulnerability to FM development (16, 21). Multiple studies have identified distinct personality profiles in some FM patients compared with healthy controls or patients with other chronic diseases (22-25). Despite the profound implications of neuroticism for health, empirical evidence regarding its complex relationship with FM remains limited and contradictory (26). These disparities could be explained by methodological variations, sample diversity, or the intricate nature of both neuroticism and FM. Consequently, a comprehensive exploration of this subject is deemed essential to identify potential underlying mechanisms and develop a comprehensive understanding of how neuroticism and FM intersect. Notably, there is no consensus on the connection between neuroticism and fibromyalgia, and to date, no systematic synthesis of the outcomes of these investigations has been conducted.
2. Objectives
This systematic review and meta-analysis aimed to elucidate the nature of neuroticism association with FM. Additionally, the persistence of this association, after accounting for potentially mediating and confounding factors, was explored, and the clinical implications and potential interventions were discussed.
3. Methods
3.1. Search Strategy
This study was conducted through a comprehensive search of electronic databases, including PubMed, Psych INFO, Science Direct, Scopus, and ProQuest, covering articles published up to August 31, 2022, with no time limitations on paper selection. The following Medical Subject Headings (MeSH) terms were employed in electronic searches using Boolean operators: Personality inventory, personality tests, personality, neuroticism, fibromyalgia, fibrositis, and chronic fatigue syndrome. To ensure the retrieval of relevant papers, broad research-related terminology, as identified in the literature review, was intentionally employed. Hence, the authors added the following terms as well: Negative emotional, emotional instability, personality traits, Five Factor model, Big Five, Eysenck personality theory, widespread chronic pain, chronic diffuse pain, FM, Big Five Inventory, Neo-Five Factor Inventory, Eysenck Personality Questionnaire, Personality Psychopathology Five, Scale of Emotional Arousability, and Ten-Item Personality Index (see Appendix 1 for complete search strategy for MEDLINE via PubMed). Further, bibliographies of relevant articles were perused for other potentially relevant articles.
This review was conducted following the Preferred Reporting Items for Systematic Reviews and Meta-analyses (PRISMA) guidelines (27). Figure 1 shows the search and screening process in more detail.
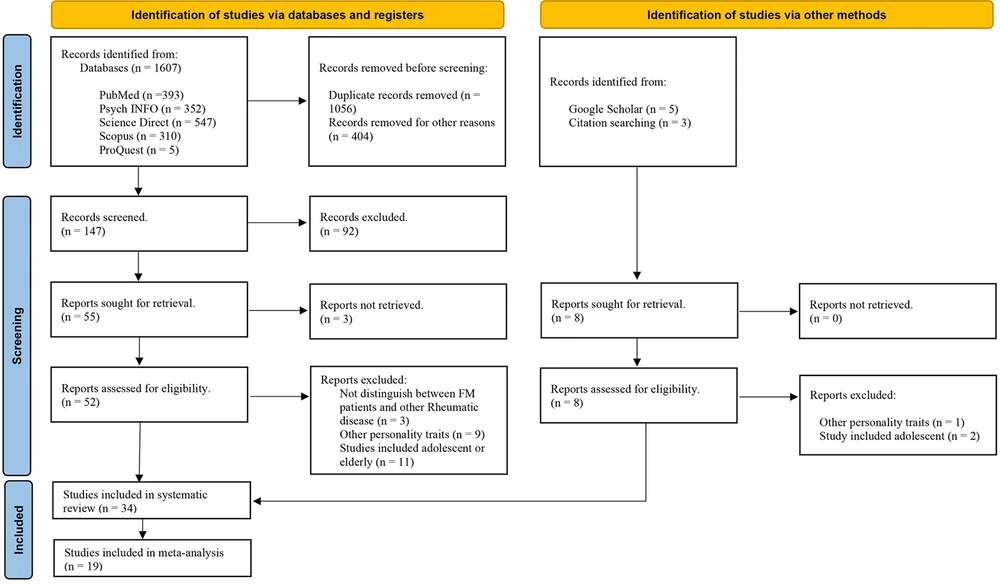
Figure 1.
Flow chart of the report selection process (PRISMA-guided process)
3.2. Inclusion and Exclusion Criteria
The inclusion criteria for this review encompassed studies involving adult patients aged 18 to 65 with a confirmed diagnosis of FM and assessments of neuroticism. Diagnostic criteria aligned with the American College of Rheumatology (ACR) guidelines (28).
All entries were imported in Mendeley to exclude any duplicates. Next, two authors (M.V. and K.A.) independently screened all potentially eligible studies to exclude irrelevant papers. Subsequently, full-text versions of the relevant papers were retrieved and reviewed to determine whether they met the criteria. Titles, abstracts, and full texts were excluded from the systematic review based on the primary exclusion criteria. Using the inclusion and exclusion criteria and after removing duplicate studies, a total of 34 relevant studies were identified. The secondary exclusion criteria determined the sample for the meta-analysis. Therefore, the data from 19 eligible case-control studies were pooled. Table 1 presents the primary and secondary study exclusion criteria for the systematic review and meta-analysis.
Table 1.
Primary and Secondary Study Exclusion Criteria
| Primary Study Exclusion Criteria-Systematic Review |
|---|
| - Other disease than FM, - Other personality traits than neuroticism, - Studies included age≥65 (elderly adults) and ≤18 (adolescents), - Review, meta-analysis, book chapter, editorial or congress abstract, - Not published in English |
| Secondary Study Exclusion Criteria-Meta-analysis |
| - No comparison between patients and control groups, - Not reported basic sample information (number of participants, gender structure), - No definite diagnostic FM criteria, - Not reported mean and standard error/standard deviation, - Without reporting data separately for patients and control groups |
3.3. Study Selection and Data Extraction
In the first phase of selection, duplicate articles were eliminated. The remaining articles were reviewed according to their titles and abstracts and screened based on the inclusion and exclusion criteria. In the second phase, articles and original studies consisting of a sample of FM patients along with assessment tools for neuroticism and an age range of 18 to 65 years old were selected. Abstracts and full texts of all potentially eligible studies were independently screened by two authors to exclude irrelevant papers. Subsequently, full-text versions of relevant documents were retrieved and reviewed to determine whether they met the criteria. Disagreements were resolved through discussion and consensus. Primary exclusion criteria were applied to titles, abstracts, and full texts. The remaining studies were included in the systematic review. Secondary exclusion criteria determined the meta-analysis sample (see Table 1).
In addition, one study (29) was included after obtaining the standard deviation of neuroticism for both patients and healthy controls through personal communication with the authors.
3.4. Quality of selective studies
The quality of the primary studies was assessed independently by two authors (M.V. and K.A.) based on predefined criteria. The assessment procedures were adapted from O'Shea and Dickens (30) and Novo et al. (24) and customized to fit the research question. Criteria included the presentation of essential data, reporting of FM diagnostic criteria, and specification of neuroticism assessment methods. Each criterion was rated as 'yes,' 'unclear,'or 'no,' with an overall risk of bias categorized as 'low' or 'high.' Despite varying risk levels, all studies were included in the meta-analysis.
3.5. Analysis
Data were extracted and organized using Excel and Mendeley software. Meta-analysis was conducted using Comprehensive Meta-analysis, version V4 (CMA.4), with a random-effects model selected to account for methodological variations among studies. Effect sizes (Hedges' g) and 95% confidence intervals were calculated. Statistical heterogeneity was assessed using Cochran’s Q test and the I2 statistic. Publication bias was evaluated through funnel plots, Egger's test, and subgroup analyses when applicable. The Fail-Safe N (FSN) was calculated to assess the impact of publication bias.
4. Results
4.1. Description of Eligible Studies
The initial systematic search yielded 1607 articles, and five others were selected from the reference lists of retrieved articles. More than 1520 studies were excluded because of not fulfilling the primary inclusion criteria (Figure 1). Full-text versions were obtained for all potential abstracts to determine if the study met the eligibility criteria. Following the review based on the inclusion and exclusion criteria, 34 articles potentially met the eligibility criteria and entered the systematic review. This review was conducted following the Preferred Reporting Items for Systematic Reviews and Meta-analyses (PRISMA) guidelines.
From all articles (N = 34), 10 studies were from North America (9 USA, 1 Canada); one study was from South America (1 Brazil); 2 studies from Asia (1 Taiwan, 1 Turkey), 3 studies from Oceania (3 Australia), 18 studies from Europe (6 Spain, 3 Portugal, 3 England, 2 Norway, 1 France, 1 Italy, 1 Switzerland, 1 Poland). In total, the meta-analysis included 2,259 FM cases and 5,672 control subjects (total N = 7,931). Summary participant and study details for all studies are provided in Table 2.
Table 2.
Assessment of the Risk of Bias in the Included Studies
| Study | Essential Data Presented | FM Diagnostic Criteria Reported | Neuroticism Assessment Specified | Risk of Bias a |
|---|---|---|---|---|
| Zautra et al. (1999) (31) | Yes | Yes | Yes | Low |
| Kersh et al. (2001) (32) | Yes | Yes | Yes | Low |
| Davis et al. (2001) (33) | Yes | Yes | Yes | Low |
| Zautra et al. (2005) (34) | Yes | Yes | Yes | Low |
| Zautra et al. (2005) (35) | Yes | Yes | Yes | Low |
| Satalino (2008) (36) | Yes | Yes | Yes | Low |
| Malin and Littlejohn (2012) (37) | Yes | Yes | Yes | Low |
| Torres et al. (2013) (38) | Yes | Yes | Yes | Low |
| Malin and Littlejohn (2013) (39) | Yes | Yes | Yes | Low |
| McBeth et al. (2015) (40) | Yes | Yes | Yes | Low |
| Montoro et al. (2015) (41) | Yes | Yes | Yes | Low |
| Montoro et al. (2016) (42) | Yes | Yes | Yes | Low |
| Yeung (2016) (43) | Yes | Yes | Yes | Low |
| Bucourt et al. (2017) (44) | Yes | Yes | Yes | Low |
| Chang et al. (2017) (45) | Yes | Yes | Yes | Low |
| Burri et al. (2017) (46) | Yes | Yes | Yes | Low |
| Gonzalez et al. (2020) (47) | Yes | No | Yes | High |
| Davydov et al. (2021) (29) | Yes b | Yes | Yes | Low |
| Silva et al. (2021) (48) | Yes | Unclear c | Yes | High |
a Studies reporting all three criteria were considered as having a low risk of bias; studies not reporting one or more criteria were considered as having a high risk of bias.
b Data obtained upon request to the authors.
c Two criteria were reported (ACR 1990 and ACR 2010).
In the next step, according to meta-analysis criteria, the data from nineteen eligible case-control studies were pooled. All the included studies were cross-sectional. Initially, the effect sizes were computed from data reported in the articles (e.g., means, standard deviations, and sample sizes) using Hedges’ g unbiased approach. A positive value for Hedges' g indicated that the FM group had higher scores than the control group on neuroticism.
For instances in which studies reported results for more than one sample (i.e., distinct groups of participants), results were coded separately. Of these, 7 articles (33, 36, 38-40, 43, 45) each reported on two different samples, and 1 article reported four separate samples (44), which we considered separately, yielding K = 29. Variables were coded as missing if the article failed to report the information.
4.2. Search Results and Coding
Data extracted and coded from the primary articles included: (1) Characteristics of the publication (e.g., authors, year of publication, country); (2) characteristics of the sample (e.g., total sample size, gender, and mean age); (3) criteria used to diagnose fibromyalgia syndrome; (4) tools used to explore neuroticism.
4.3. Measures of Neuroticism
In the included studies, neuroticism was assessed through various instruments. The following measurement tools were predominantly employed: The Big Five Inventory (BFI) (10 studies), the Neo-Five Factor Inventory (Neo-FFI) (9 studies), and the Eysenck Personality Questionnaire (EPQ) (8 studies). Additionally, a subset of studies employed other instruments to explore neuroticism: The Personality Psychopathology Five (PSY-5) (3 studies), the Scale of Emotional Arousability (SEA) (2 studies), and the Ten-Item Personality Index (TIPI) (1 study).
4.4. Diagnostic Criteria for Fibromyalgia
In this meta-analysis, studies were selected based on their adherence to diagnostic criteria for FM. The following criteria were applied in the primary studies: Twenty-five articles referred to the American College of Rheumatology (ACR) 1990 criteria, two articles applied the 2010 ACR diagnostic criteria, and only one study used the 2016 revision criteria. In addition, two articles used the FM self-report screening instrument and physician confirmation for diagnosis, and one study used the London Fibromyalgia Epidemiology Symptom Screening Questionnaire (LFESSQ).
4.5. Meta-analysis
The selected nineteen studies were entered into the meta-analyses according to the results reported in each text (K = 29) (Table 3). Meta-analysis was performed to calculate the effect sizes of neuroticism between cases with FM and control subjects. In the pooled analysis of the effect sizes from all studies, a significant finding emerged: Patients with FM consistently exhibited higher neuroticism scores when compared to control subjects [Hedges’ g = 0.78 (0.54 to 1.02), P < 0.001; Q = 397.84; P-value for heterogeneity = P < 0.001; I2 = 92.96%]. This finding underscores the presence of a substantial link between neuroticism, a personality trait characterized by emotional instability and negative affect, and the experience of FM. Table 4 summarizes the magnitudes and directions of effect size for neuroticism included in the meta-analysis.
Table 3.
Summary of Included Studies in Systematic Review
| Author | Year / Country | Sample Size | Sample Characteristics | Scale | FM Criteria | Findings | Mean ± SD of Neuroticism | |
|---|---|---|---|---|---|---|---|---|
| FM Patients | Control Group | |||||||
| Martin et.al. (49) | 1996/ USA | 80 FM patients | Mean age = 46.2, %93.7 female | The NEO five factor personality inventory (NEO-FFI) | ACR 1990 criteria | Given that this is the first use of the NEO in FM patients, no comparisons to previous findings can be made. | 56 ± 1.43 | 56 ± 1.43 |
| Epstein et al. (50) | 1999/ USA | 73 FM patients | Mean age = 46.5, %94.5 female | The NEO personality inventory-revised (NEO PI-R) | ACR 1990 criteria | FM patients had high levels of neuroticism. | 57.4 ± 10.6 | 57.4 ± 10.6 |
| Zautra, Hamilton & Burke (31) | 1999/ USA | 48 FM patients and 52 osteoarthritis patients | Mean age = 63.8, %100 female | The scale of emotional arousability (SEA) | ACR 1990 criteria | Emotionality (the emotionally labile) did not differ significantly between the groups. | 2.76 ± 0.77 | 2.76 ± 0.77 |
| Kersh et al. (32) | 2001/ USA | 79 FM patients and 39 healthy controls | Mean age = 47.6, %94 female | NEO-FFI | ACR 1990 criteria | FM patients also produced a significantly higher score than the nonpatients on the neuroticism scale. | 56.21 ± 1.44 | 56.21 ± 1.44 |
| Davis et al. [a] (33) | 2001/ USA | 50 FM patients and 22 osteoarthritis patients without surgery | Mean age = 63.3, %100 female | SEA | ACR 1990 criteria + the FM Self-Report Screening Instrument | Emotionality (the emotionally labile) did not differ significantly between the groups. | 2.77 ± 0.77 | 2.77 ± 0.77 |
| Davis et al. [a] (33) | 2001/ USA | 50 FM patients and 29 osteoarthritis patients with knee replacement surgery | Mean age = 65.4, %100 female | SEA | ACR 1990 criteria + the FM Self-Report Screening Instrument | Emotionality (the emotionally labile) did not differ significantly between the groups. | 2.77 ± 0.77 | 2.77 ± 0.77 |
| Malt et al. (51) | 2002/ Norway | 42 FM patients and 48 healthy controls | Mean age = 45.0, %100 female | The eysenck personality questionnaire- neuroticism (EPQ-N) | ACR 1990 criteria | Fibromyalgia patients scored high on neuroticism. A high pain score was associated with high neuroticism. | 10.1SD not reported | 7.06SD not reported |
| Banic et al. (52) | 2004/ Switzerland | 22 FM patients and 25 healthy controls | Mean age = 47.0, %80 female | NEO-FFI | ACR 1990 criteria | FM patients had significantly higher levels of neuroticism than healthy controls. | 54.0, SD not reported | 38.0, SD not reported |
| Zautra et.al. (34) | 2005/ USA | 87 FM patients and 39 osteoarthritis patients | Mean age = 55.7, %100 female | The big five inventory (BFI) | The FM Self-report Screening Instrument + physician confirmation | There were no significant differences between groups in neuroticism after controlling for age and average pain. | 3.35 ± 0.75 | 3.0 ± 0.85 |
| Zautra, Johnson & Davis (35) | 2005/ USA | 86 FM patients and 38 osteoarthritis patients | Mean age = 54.6, %100 female | BFI | rheumatologist confirmed the diagnosis of Fibromyalgia | FM patients had significantly higher levels of neuroticism than osteoarthritis patients. | 3.38 ± 0.76 | 2.29 ± 0.81 |
| Satalino (Doctoral dissertation) [a] (36) | 2008/ USA | 67 FM patients and 38 chronic Lyme disease patients | Mean age = 43.8, %100 female | NEO-FFI | ACR 1990 criteria | Neuroticism did not differ significantly between the groups. | 56.70 ± 15.33 | 52.50 ± 14.94 |
| Satalino (Doctoral dissertation) [b] (36) | 2008/ USA | 67 FM patients and 31 healthy controls | Range = 43.8, %100 female | NEO-FFI | ACR 1990 criteria | FM patients had significantly higher levels of neuroticism than healthy controls. | 56.70 ± 15.33 | 45.35 ± 15.60 |
| Rive et al. (53) | 2010/ Norway | 58 (FM patients and healthy control) | Mean age = 52.4, %100 female | EPQ-N | ACR 1990 criteria | Significant differences in neuroticism scores between FM patients and healthy control | The raw data was not reported. | The raw data was not reported |
| Martı´nez et al. (54) | 2011/ Spain | 74 FM patients | Mean age = 46.5, %94.5 female | NEO-FFI | ACR 1990 criteria | Significant positive correlations between neuroticism and pain catastrophizing and pain anxiety. | A control group did not exist. | |
| Malin and Littlejohn(37) | 2012/ Australia | 27 FM patients and 29 healthy controls | Range = 20-39, %100 female | BFI | ACR 1990 criteria | Neuroticism showed a significant difference between the FM group and the HC group. | 23.52 ± 5.98 | |
| Molnar et al. (55) | 2012/ Canada | 489 FM patients | Mean age = 48.7, %100 female | BFI | ACR 1990 criteria | Higher levels of neuroticism were associated with poorer health functioning. | A control group did not exist. | |
| Torres et al. [a] (38) | 2013/ Spain | 225 FM patients and 145 rheumatologic non-FM patients | Mean age = 43.0, %95.3 female | The NEO-five factor inventory- Revised (NEO-FFI-R) | ACR 1990 criteria | FM patients were characterized by higher neuroticism and showed a worse pretreatment clinical state. At 6-month follow-up, FM patients remained more anxious and depressed. | 29.1 ± 8.7 | 28.5 ± 8.0 |
| Torres et al. [b] (38) | 2013/ Spain | 225 FM patients and 102 drug-resistant epileptic patients | Mean age = 39.7, %78.3 female | NEO-FFI-R | ACR 1990 criteria | FM patients were characterized by higher neuroticism and showed a worse pretreatment clinical state. At x, FM patients remained more anxious and depressed after 6-month follow-up. | 29.1 ± 8.7 | 25.9 ± 6.8 |
| Malin and Littlejohn (39) | 2013/ Australia | 98 FM patients and 35 healthy controls | Range = 18-60, %100 female | BFI | ACR 1990 criteria | Neuroticism did not differ significantly between the groups. | 25.95 ± 5.22 | 23.91 ± 6.04 |
| De Tommasoa et al. (56) | 2014/ Italy | 23 migraines without aura patients sharing FM comorbidity and 51 healthy controls | Mean age = 41.9, %67.64 female | The big five questionnaire (BFQ) | ACR 1990 criteria | The authors did not find neuroticism in their migraine patients, either with or without FM comorbidity. | Raw scores not reported | Raw scores not reported |
| McBeth et al. (a) (40) | 2015/ England | 60 chronic widespread pain patients and 897 chronic fatigue patients | Mean age = 47.0, %56 female | BFI | ACR 1990 criteria | Mean neuroticism scores in participants with CWP without anxiety or depression were similar to those free of CWP. | Without anxiety or depression, 17.0 ± 9.1 | 17.4 ± 7.5 |
| McBeth et al. (b) (40) | 2015/ England | 23 chronic widespread pain patients and 897 chronic fatigue patients | Mean age = 47.0, %56 female | BFI | ACR 1990 criteria | Mean neuroticism scores were higher for participants with CWP with concurrent anxiety and depression. | With anxiety or depression, 32.6 ± 6.7 | 17.4 ± 7.5 |
| Montoro & Reyes del Paso (41) | 2015/ Spain | 92 FM patients and 65 healthy controls | Mean age = 50.7, %96.8 female | The eysenck personality questionnaire Revised- abbreviated (EPQR-A) | ACR 1990 criteria | Neuroticism scores were greater in FM patients than in controls. | 4.72 ± 1.333 | 2.65 ± 1.71 |
| Denizci (Master thesis) (57) | 91 FM patients | Mean age = 35.7, %89 female | Basic personality traits inventory | ACR 2010 criteria | Men obtained significantly higher scores on neuroticism than women. | 28.40 ± 7.46 (for women), 33.54 ± 6.45 (for men) | 28.5 ± 8.0 | |
| Montoro et al. (42) | 2016/ Spain | 54 FM patients and 34 healthy controls | Mean age = 50.4, %100 female | EPQR-A | ACR 1990 criteria | FM patients displayed greater neuroticism. Neuroticism was greater in FM patients and healthy participants with high alexithymia than in those with low alexithymia | 4.67 ± 1.35 | 2.85 ± 1.65 |
| Malin & littlejohn (58) | 2016/ Australia | 98 FM patients | Mean age = Not reported, %100 female | BFI | ACR 1990 criteria | Anxiety and neuroticism showed a clear association with stress. | 25.95 ± 5.22 | A control group did not exist. |
| Yeung (Doctoral dissertation) [a] (43) | 2016/ England | 19 FM patients and 17 osteoarthritis patients | Mean age = 43.6, %100 female | EPQ-N | ACR 1990 criteria | No differences were found between FM patients and osteoarthritis patients. | 15.74 ± 4.36 | 13.47 ± 5.80 |
| Yeung (Doctoral dissertation) [b] (43) | 2016/ England | 19 FM patients and 10 healthy controls | Mean age = 39.5, %100 female | EPQ-N | ACR 1990 criteria | Neuroticism scores were greater in FM patients than in healthy controls. | 15.74 ± 4.36 | 9.30 ± 5.06 |
| Bucourt et al. [a] (44) | 2017/ France | 48 FM and 46 rheumatoid arthritis patients | Mean age = 47.1, %100 female | BFI | ACR 1990 criteria | FM patients had significantly higher scores on neuroticism than the rheumatoid arthritis patients. | 3.52 ± 0.75 | 2.98 ± 0.80 |
| Bucourt et al. [b] (44) | 2017/ France | 48 FM and 23 Sjögren’s syndrome patients | Mean age = 48.4, %100 female | BFI | ACR 1990 criteria | There were no significant differences between patients with Sjögren’s syndrome patients and FM patients in neuroticism. | 3.52 ± 0.75 | 3.32 ± 0.80 |
| Bucourt et al. [c] (44) | 2017/ France | 48 FM and 46 spondyloarthritis patients | Mean age = 45.0, %100 female | BFI | ACR 1990 criteria | There were no significant differences between patients with spondyloarthritis patients and FM patients with neuroticism. | 3.52 ± 0.75 | 3.32 ± 0.80 |
| Bucourt et al. [d] (44) | 2017/ France | 48 FM and 115 other rheumatic diseases patients | Mean age = 47.3, %100 female | BFI | ACR 1990 criteria | FM patients had significantly higher scores on neuroticism than other rheumatic disease patients. | 3.52 ± 0.75 | 3.19 ± 0.81 |
| Chang et al. [a] (45) | 2017/ Taiwan | 58 chronic widespread pain patients and 51 healthy controls | Mean age = 51.1, %68 female | The eysenck personality inventory (EPI) | ACR 1990 criteria | There were significant differences between patients with chronic widespread pain and the controls in neuroticism | 6.26 ± 2.95 | 2.71 ± 2.87 |
| Chang et al. [b] (45) | 2017/ Taiwan | 58 chronic widespread pain patients and 121 chronic regional pain patients | Mean age = 55.8 | EPI | ACR 1990 criteria | There were significant differences between patients with chronic widespread pain and chronic regional pain patients in neuroticism | 6.26 ± 2.95 | 3.57 ± 3.13 |
| Montoro et al. (59) | 2018/ Spain | 24 FM patients | Mean age = 48.9, %96.8 female | EPQR-A | ACR 1990 criteria | Neuroticism was positively associated with specific components of the anterior and the middle cerebral arteries in cerebral blood flow responses. | 4.80 ± 1.12 | A control group did not exist. |
| Bartkowska et.al. (60) | 2018/ Poland | 30 FM patients and 30 other painful spinal disorders patients | Mean age = Not reported, %100 female | NEO-FFI | ACR 2016 criteria | There were no significant differences between the two groups. | Raw scores not reported. | Raw scores not reported. |
| Burri et al. (46) | 2018/ England | 472 chronic widespread musculoskeletal pain patients and 2,585 non-CWP patients | Mean age = 56.6, %100 female | The Ten-Item Personality Index (TIPI) | The London Fibromyalgia Epidemiology Symptom Screening Questionnaire (LFESSQ) | The CWP group showed higher values in emotional instability compared to individuals without CWP. | 3.50 ± 1.40 | 3.14 ± 1.37 |
| Seto et al. (26) | 2019/ USA | 92 FM patients | Mean age = 52.3, %94.6 female | The NEO-five factor inventory-3 (NEO-FFI-3) | ACR 1990 and ACR 2010 criteria | The effect of neuroticism on fibromyalgia impact was mediated by anxiety and depression. | 23.1 ± 7.2 | A control group did not exist. |
| Gonzalez et al. (21) | 2019/ Portugal | 38 FM patients and 32 RA patients | Mean age = 45.6, %100 female | The personality psychopathology five (PSY-5) | Not reported. | FM patients had significantly higher levels on the negative emotionality/neuroticism scale. | 59.94 ± 11.05 | 52.21 ± 9.51 |
| Gonzalez et al. (16) | 2020/ Portugal | 56 FM patients | Mean age = 45.9, %100 female | PSY-5 | Not reported. | A K-Means cluster analysis identified two clusters, one (n = 24) with clinically significant levels in negative emotionality and Introversion scales. | 65.25 ± 9.66 | A control group did not exist. |
| Gonzalez et.al. (47) | 2021/ Portugal | 56 FM patients | Mean age = 45.9, %100 female | PSY-5 | Not reported. | One cluster of FM patients, characterized by a combination of negative affectivity and social inhibition, presented a more disturbed profile, with several important features of symptomatic behavior, general maladjustment, and important clinical problem areas. | 58.51 ± 10.76 | A control group did not exist |
| Davydov et al. (29) | 2021/ Spain | 110 FM patients and 60 healthy controls | Mean age = 50.7, %100 female | EPQR-A | ACR 1990 | Personality traits such as neuroticism could affect the above cognitive distraction coping effects on pain severity through catastrophizing. | 4.78 ± 1.31 | 2.71 ± 1.79 |
| Silva et al. (48) | 2022/ Brazil | 40 FM patients and 40 healthy controls | Mean age = 46.1, %100 female | BFI | ACR 1990 and ACR 2010 criteria | Neuroticism scores were higher in the FM group than in the control group. The two groups differed significantly regarding Neuroticism. | 4.5 ± 1 | 3.7 ± 1 |
Table 4.
Summary of Meta-analytic Results of Neuroticism (Random Model) a
| Domain | K | N | FM Patients | Control Group | Pooled Effect Size Hedge’s g (P-Value) | 95 % CI | Homogeneity Statistics | Test of Null (2-Tail) | ||||
|---|---|---|---|---|---|---|---|---|---|---|---|---|
| LL | UL | Q (df) | P-Value | I2 | Z-Value | P-Value | ||||||
| Neuroticism | 29 | 7,931 | 2,259 | 5,672 | 0.78 (0.000) b | 0.54 | 1.02 | 397.84 (28) | 0.000 b | 92.9 | 6.38 | 0.000 b |
a K = Number of studies; N = Total number of participants; FM = Fibromyalgia patients; HS = Healthy subjects; LL = Lower limit; UL = Upper limit; Q and I2 = Indicate heterogeneity statistics; df = degrees of freedom.
b Statistically significant values
Figure 2 demonstrates the details of the individual studies and pooled analysis, including Hedges’ g and CI calculations.
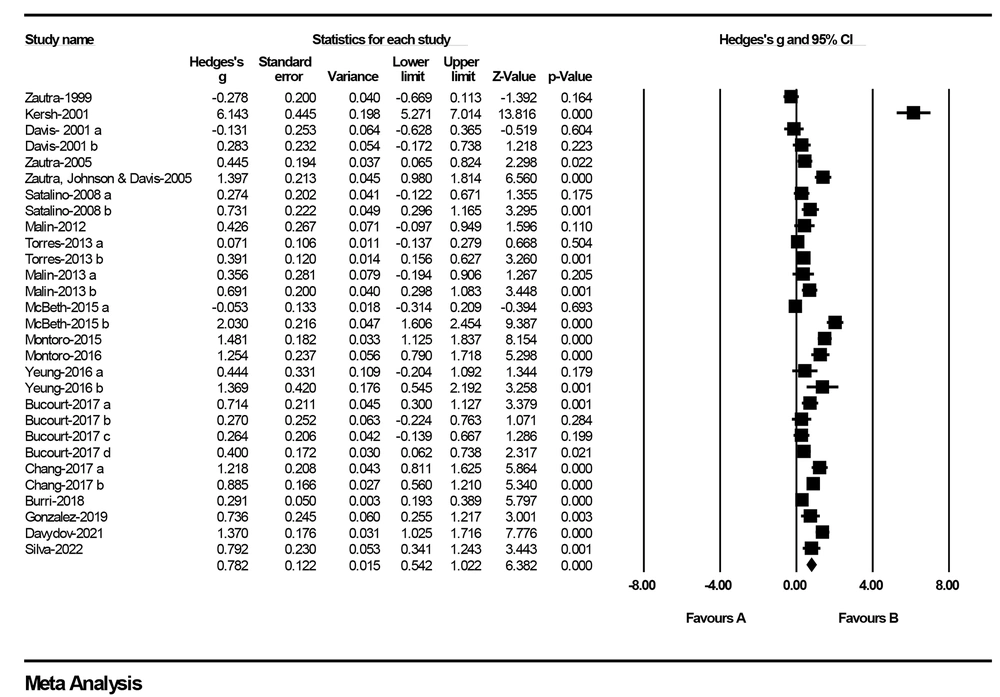
Figure 2.
Random-effects meta-analysis forest plot: Comparison between patients with fibromyalgia and controls. CI: Confidence intervals
4.6. Publication Bias and Heterogeneity Assessment
4.6.1. Publication Bias Assessment
To assess potential publication bias, multiple methods were employed (Table 5). First, a funnel plot was visually inspected, providing an initial indication of potential bias in the distribution of effect sizes by study weight (Figure 3). Second, Egger’s regression intercept was calculated to quantitatively test the significance of funnel plot asymmetry (β = 3.50, t = 2.80, P = 0.009). Third, subgroup analyses based on publication status were conducted to examine whether effect sizes significantly differed based on certain characteristics (61).
Table 5.
Publication Bias Coefficients a
| Variable | Fail-Safe N | Egger’s Test | Trim and Fill ES Obs./Adj. | |
|---|---|---|---|---|
| Intercept (SE) | t (P-Value) | |||
| Neuroticism | 19.16 | 3.50 (1.24) | 2.80 (.009) | 0.78/ 1.15 |
a ES obs./adj. = Observed versus adjusted after Trim and fill procedure effect size value.
Additionally, Duval and Tweedie’s trim and fill test was utilized. This test suggested that ten additional studies with smaller effect sizes would be required on the right-hand side of the funnel plot to make it symmetric, indicating potential publication bias.
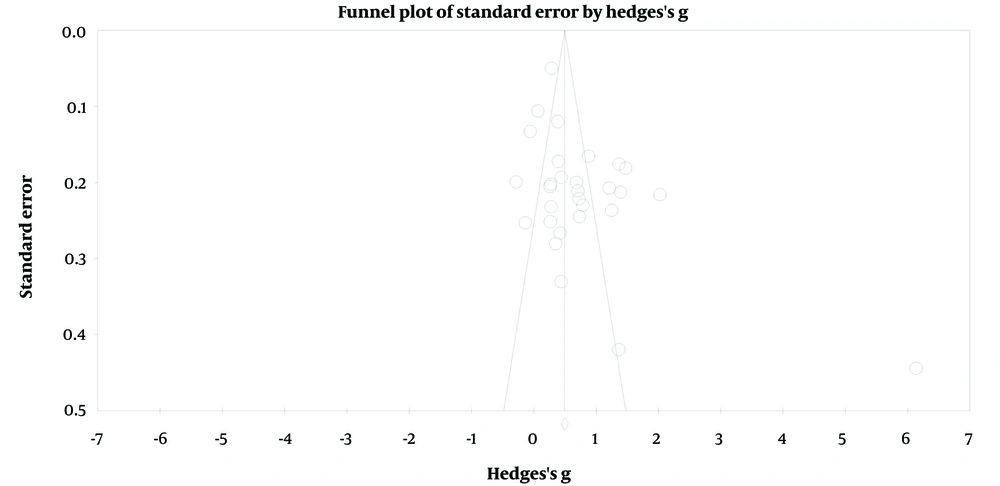
Figure 3.
Funnel plot for neuroticism meta-analysis. The vertical line indicates the estimated mean effect size, and the circles represent included studies
Finally, the classic Fail-Safe N (FSN) was calculated to assess the robustness of the results to the influence of publication bias. An FSN equal to or greater than five times the number of studies in the analysis plus 10 (FSN ≥ 5k + 10) suggested that the effect size was resilient to the influence of publication bias (62). In this case, the FSN was 2,743, indicating the high robustness of the findings.
4.6.2. Heterogeneity Assessment
Heterogeneity among the included studies was assessed using Cochran’s Q test and the I2 statistic index. A P-value of 0.05 or an I2 value greater than 50% indicated significant heterogeneity (Table 4). The high I2 value (92.96%) for the overall analysis justified the use of subgroup analyses and meta-regression to explore potential moderating factors.
4.7. Meta-regression and Subgroup Analyses
Given the observed high heterogeneity, both meta-regression and subgroup analyses were conducted to investigate the potential moderators that might have influenced the effect size. Although it was not possible to extract data on medication use, disease duration, and pain intensity from the primary studies, the effects of several key moderators, including the health condition of the control group, sex of participants, study year, marital status, neuroticism measurement, mean sample age, and continent were explored (Table 6).
Table 6.
Meta-regression Analysis a
| Variable | Moderator | K | Coefficient | Standard Error | 95% CI | Z-Value | Q | P-Value | |
|---|---|---|---|---|---|---|---|---|---|
| LL | UL | ||||||||
| Neuroticism | Year of publication | 29 | -0.012 | 0.020 | -0.052 | 0.027 | -0.61 | 0.37 | 0.544 |
| Mean age | 27 | -0.014 | 0.017 | -0.048 | 0.020 | -0.79 | 0.63 | 0.428 | |
| Marital status (married) | 17 | -0.001 | 0.010 | -0.021 | 0.018 | -0.13 | 0.02 | 0.897 | |
| Sex of participants (categorical) | 29 | -0.547 | 0.276 | -1.090 | -0.004 | -1.98 | 3.91 | 0.048 b | |
| Percentage of female | 29 | -0.008 | 0.009 | -0.027 | 0.009 | -0.95 | 0.91 | 0.339 | |
| Health condition of the control group | 29 | -0.852 | 0.225 | -1.294 | 0.410 | -3.78 | 14.27 | 0.000 b | |
a K = number of studies; LL = lower limit; UL = Upper Limit; Q = indicate heterogeneity statistics; df = degrees of freedom.
b Statistically significant values.
The results of the meta-regression and subgroup analyses revealed that the health condition of the control group and the sex of the participants were significant moderators affecting the effect size. Specifically, smaller effect sizes were observed in studies with non-FM patients in the control group (vs. healthy controls), and smaller effect sizes were found in studies with female participants (vs. male and female groups). These findings further emphasize the importance of considering these factors when interpreting the meta-analysis results.
Table 7 Summary of subgroup analysis of neuroticism based on measurement, the health status of the control group, sex of participations, and continent.
Table 7.
Summary of Subgroup Analysis of Neuroticism Based on Measurement a
| Variables | Group | K | Pooled Effect Size Hedge’s g | 95 % CI | Test of Null (2-Tail) | Homogeneity Statistics | |||
|---|---|---|---|---|---|---|---|---|---|
| LL | UL | Z-Value | P-Value | Q (df) | P-Value | ||||
| Neuroticism measurement | The Big Five Inventory (BFI) | 12 | 0.64 | 0.30 | 0.97 | 9.69 | 0.000 | 59.94 (5) | 0.000 b |
| The Eysenck Personality Questionnaire (EPQ) | 7 | 1.17 | 0.93 | 1.41 | 14.76 | 0.000 | |||
| The NEO-Five Factor Inventory | 5 | 1.40 | 0.41 | 2.04 | 5.97 | 0.000 | |||
| The Scale of Emotional Arousability (SEA) | 3 | -0.05 | -0.39 | 0.28 | -0.49 | 0.623 | |||
| The Personality Psychopathology Five (PSY-5) | 1 | 0.73 | 0.25 | 1.21 | 3.00 | 0.003 | |||
| The Personality Psychopathology Five (TIPI) | 1 | 0.29 | 0.19 | 0.38 | 5.79 | 0.000 | |||
| Health status of control group | Non-FM patients | 18 | 0.46 | 0.25 | 0.66 | 10.64 | 0.000 | 9.28 (1) | 0.002 b |
| Healthy control | 11 | 1.38 | 0.82 | 1.93 | 16.47 | 0.000 | |||
| Sex of participations | Female group | 20 | 0.60 | 0.42 | 0.79 | 6.41 | 0.000 | 3.21 (1) | 0.073 |
| Mixed group | 8 | 1.23 | 0.57 | 1.90 | 3.91 | 0.000 | |||
| Continent | America | 9 | 1.01 | 0.26 | 1.76 | 2.64 | 0.008 | 5.76 (3) | 0.12 |
| Asia | 2 | 1.02 | 0.70 | 1.35 | 6.24 | 0.000 | |||
| Europe | 15 | 0.71 | 0.43 | 0.98 | 5.07 | 0.000 | |||
| Oceania | 3 | 0.53 | 0.26 | 0.80 | 3.85 | 0.000 | |||
a K number of studies; LL = lower limit; UL = Upper Limit; Q = indicate heterogeneity statistics; df = degrees of freedom.
b Statistically significant values
5. Discussion
The current systematic review and meta-analysis focused on neuroticism in FM patients. According to the results, FM patients had higher neuroticism levels than in the control group. Growing evidence suggests that neuroticism is associated with a wide range of physical health problems, including cardiovascular disease (63), irritable bowel syndrome (64), migraine (65), and low back pain (66). Thus, patients with functional somatic syndrome and musculoskeletal pain, such as FM, appear to have a higher level of neuroticism (67, 68). Consistent with the current results, previous reviews have shown higher neuroticism in chronic pain disorders such as migraine (18) and irritable bowel syndrome (69). In addition, based on the results, FM patients showed a larger effect size compared to non-FM patients and healthy controls, indicating the role of neuroticism as a contributing factor to the development of fibromyalgia.
One of the most interesting areas of personality research is the study of how personality is related to the development of various diseases, particularly painful diseases. Neuroticism has been identified as a personality dimension most closely associated with mental and physical health (1), and a relationship between neuroticism and persistent pain has been reported (70-72). Nonetheless, there is a complex interaction between neuroticism and FM, which involves several mediated variables. At least four general underlying mechanisms exist through which neuroticism may contribute to an increased risk of persistent pain and somatic complaints.
The first pathway involves enhanced pain and bodily signal sensitivity. Neuroticism may influence pain perception thresholds and pain sensitivity (73). High neuroticism-scoring patients with chronic pain may have a lower pain threshold, resulting in increased pain sensitivity (3, 74). According to research evidence, neuroticism in patients was directly related to pain reports, decreased pain tolerance, pain catastrophizing, pain vigilance, and fear of movement/re-injury (18, 73, 75). Charles et al. examined neuroticism levels and their relationship to physical health conditions in 21,676 adult twins conducted in 1973 and 25 years later. According to their findings, even when genetic and familial environmental factors are controlled, neuroticism still plays a significant role in predicting the likelihood of reporting conditions characterized by systemic pain as a hallmark symptom. Higher neuroticism was also linked to self-reported pain, which preceded chronic physical health problems (3).
Furthermore, individuals with high levels of neuroticism may have complicated physical sensations and biased attention toward bodily danger signals such as pain, resulting in somatic complaints. Therefore, increased awareness of bodily symptoms may explain why people with an intense form of neuroticism report more somatic complaints in the absence of heightened disease rates (3, 68, 76, 77).
The second pathway through which personality may be associated with pain is health-related behavior. There is clear evidence of an association between personality traits and health-related behaviors. Several studies have found that high levels of neuroticism increase the risk of an unhealthy lifestyle, such as poor sleep, decreased physical activity, higher body mass index (BMI), increased alcohol consumption, smoking, and future alcohol problems (76, 78). There is evidence that lifestyle habits such as physical inactivity, sedentary behavior, poor sleep, unhealthy diet, and smoking are linked to chronic pain severity and sustainability. In fact, these factors may aggravate the pain (73, 79). Recent data have also suggested that a diagnosis of fibromyalgia is associated with unhealthy behaviors (80). In particular, another review found that FM risk factors included female sex, smoking, high BMI, and pre-existing medical disorders (81).
The fear-avoidance model can explain unhealthy behaviors among FM patients. This model presents putative pathways by which FM patients may become trapped in a downward spiral of increasing avoidance of movement or activities, physical disability, and pain. According to this model, negative appraisal of pain and pain catastrophizing can lead to pain-related fear and kinesiophobia, which may be followed by the initiation of avoidant and guarded movements (54, 81, 82). Furthermore, fear of movement, catastrophizing, and hypervigilance can serve as barriers to adaptive lifestyle changes. Consequently, patients may become trapped in a vicious cycle of increasing pain and disability (79, 83).
Moreover, smoking or alcohol consumption may reflect their use in coping with pain (84). According to the fear-avoidance model, patients with chronic pain who consume moderate amounts of alcohol may do so to alleviate stress and facilitate disinhibition (74, 85). Furthermore, smoking in people with chronic pain may serve as an escape or avoidance function in response to pain (84).
A third possible explanation is that personality traits may affect the use of avoidance/passive coping styles when facing stressful situations, including pain. As a result, patients will not be able to adapt appropriately to the disease (18). Personality characteristics, particularly neuroticism, are directly related to cognitive appraisals and coping strategies (86). When faced with a stressor such as pain, individuals with high neuroticism may be more likely to perceive a pain stimulus as threatening; consequently, they may tend to use distancing-avoidance coping strategies that predict poor adaptation (6, 75). As a result, neuroticism predicts problematic strategies such as wishful thinking, withdrawal, and emotion-focused coping methods used by patients with chronic pain to deal with their pain (87). Empirical evidence suggests that passive coping strategies are associated with increased pain intensity, depression, disability, and poor psychological adjustment (18, 88).
Another possible explanation is the difference in neuroticism between men and women. In general, women tend to score higher on neuroticism (45, 89), which has been observed in many cultures and nations (39). Moreover, women generally have a higher sensitivity and lower tolerance to various experimental pain stimuli. In laboratory studies on pain sensitivity, a higher female predominance seems to be correlated with actual differences between sexes (77, 90). Furthermore, mood disorders are prevalent in FM patients, with a higher rate in female patients (91, 92). Previous studies have reported that state negative affect, particularly depression, is a significant factor in exacerbating pain perception in all clinical settings (93).
A large body of evidence also suggests that high neuroticism is a risk factor for present and future depression (94). The core defining component of neuroticism is the frequent experience of negative affect (73). The results of two meta-analyses showed that patients with depressive disorders had a higher level of neuroticism than healthy controls (95, 96). Within this context, negative affect may contribute to and explain the association between neuroticism and persistent pain (73). It appears that negative affect, which is correlated with sex, contributes to pain progression (77, 90). This complex interplay may explain why females have a higher prevalence of chronic pain conditions and functional somatic syndromes than males in clinical studies (97, 98).
The results demonstrated that FM patients generally had higher neuroticism scores than the healthy controls. This is in line with other studies on patients with chronic pain (19). It is relevant to note that the difference between patients and healthy individuals may explain the importance of neuroticism in the development and maintenance of chronic pain conditions generally. Patients with FM had significantly higher neuroticism scores than non-FM patients. Additionally, there may be some sex-based differences in the FM subgroups. However, further research is warranted since the data presented here may not be sufficient to generalize the results to all patients with FM. It should be mentioned that less attention has been paid to this syndrome in males (92). This necessitates further research on sex differences and neuroticism among FM patients in the future.
Overall, the current study sheds light on the role of neuroticism in FM, emphasizing the importance of considering personality traits to understand the development and management of chronic pain conditions. Although the differences between FM and non-FM patients and potential sex-based variations within FM subgroups warrant further investigation, these findings underscore the relevance of neuroticism in the context of chronic pain and its implications for future research and therapeutic approaches.
5.1. Conclusions
The findings of this study highlighted a high level of neuroticism in fibromyalgia patients and its significant role in the development and maintenance of fibromyalgia. These significant results hold promising implications for clinicians and healthcare providers. By understanding the relationship between neuroticism and FM, clinicians can better assess and tailor treatment plans for FM patients based on their personality traits. This may result in more effective and personalized interventions, which will ultimately lead to better patient outcomes and quality of care. As an added benefit, incorporating neuroticism assessments into the diagnostic process can facilitate the identification and treatment of mental health disorders and provide a more holistic understanding of the patient's psychological profile.
While the debate on the stability of personality traits persists, emerging evidence suggests that personality traits can change, particularly with age (99) and specific interventions (100). Notably, a recent review showed that neuroticism (emotional stability) can be alleviated through therapeutic interventions (101).
One promising intervention approach in the context of emotional disorders is a Unified Protocol for Transdiagnostic Treatment of Emotional Disorders (UP). This cognitive-behavioral intervention targets fundamental emotional processes underlying conditions, such as anxiety and mood disorders, which are closely related to temperament. UP aims to modify strong negative emotional reactions and promote adaptive emotional regulation strategies. By alleviating these negative reactions, UP may impact temperamental characters and influence the frequency and intensity of future emotional experiences (102). Although UP has demonstrated effectiveness in treating emotional symptoms in populations with medical conditions (103), its potential efficacy in managing fibromyalgia, especially in patients with high neuroticism, warrants further investigation.
Furthermore, recent advances in neuroimaging have provided insights into the neural correlates of neuroticism. A meta-analysis of resting-state functional imaging studies identified five core brain regions consistently associated with neuroticism, shedding light on its neurological underlying mechanisms. These regions include the left middle temporal gyrus (MTG), left striatum, and right hippocampal gyrus, which showed positive correlations with neuroticism, as well as the left superior temporal gyrus (STG) and right supramarginal gyrus (SMG), which have negative associations. Meta-regression analyses underscored the relevance of covariates such as sex and age (104). These neuroscientific findings may have implications for brain-based therapies like transcranial magnetic stimulation (TMS) and the emerging field of psychopathology.
In light of these insights, a more individualized approach to assess and address neuroticism in the management of fibromyalgia is warranted. Integrating neuroticism into an individually tailored multimodal intervention for patients with fibromyalgia could enhance the treatment outcomes. In order to provide a more comprehensive understanding of the potential benefits of incorporating neuroticism assessments and interventions into the treatment of fibromyalgia, more research is needed.
5.2. Limitations
This meta-analysis has several limitations. The moderator effects of variables such as pain intensity, medication use, and negative affect could not be examined due to limited reporting in primary studies. The results were based on cross-sectional data, thus hindering causal interpretation. Additionally, the predominantly female participant population may leave gender differences overlooked. Therefore, future research should examine the potential influence of pain intensity, medication use, and negative effects on neuroticism and FM, and longitudinal studies are required for a more comprehensive understanding of FM development.