
1. Background
The problem of obesity among college students has shown an obvious increasing trend in the past few decades (1). This issue is of great concern around the world. According to the World Health Organization (WHO), global obesity rates have nearly doubled in the past four decades (2). The college student population is particularly vulnerable to obesity and is at a critical time of changes in lifestyle and eating habits (3). A "college student" typically refers to an individual enrolled in post-secondary education at a college or university. The age range for college students can vary depending on the educational system and country, but generally, they are between the ages of 18 and 24 years old. College students often face academic pressure, social pressure, and self-identity and body image issues, all of which can lead to unhealthy lifestyles and obesity (4). Therefore, it is important to understand the background and influencing factors of obesity in college students to formulate intervention strategies.
There is a strong correlation between obesity and mental health. Numerous studies have shown that obese people are more likely to have mental health problems such as anxiety and depression. Obesity can lead to lower self-esteem, social isolation, and dissatisfaction with one's own image, which can affect mental health (5-7). Recent systematic reviews have further supported these findings, highlighting the detrimental effects of obesity on psychological well-being (8-10). In addition, obesity can lead to physical health problems, such as diabetes and high blood pressure, which can also negatively impact mental health (11). Therefore, understanding the complex relationship between obesity and mental health is essential for comprehensive interventions.
Aerobics is a type of aerobic exercise that combines dance, music, and gymnastic movements (12). It is usually conducted in a group setting and has a certain social nature (13). Aerobics focuses on the coordination and fluency of movement and is usually carried out to music, making it a form of exercise that can improve both physical and mental health (14, 15). Aerobics is suitable for people of all ages and physical levels and is widely popular on college campuses (16). Previous research has explored the positive effects of exercise on mental health. Some studies have found that regular exercise can reduce anxiety and depression symptoms and improve self-esteem and self-confidence. Most of these studies were conducted across different age groups and populations, including teenagers, adults, and older adults (17, 18). However, research on obesity among college students is still relatively limited. Therefore, this study aims to fill this knowledge gap and investigate whether aerobic exercise as a potential intervention can improve the mental health of college students with obesity.
2. Objectives
The purpose of this study was to explore whether aerobic exercise has a positive effect on the mental health and Body Mass Index (BMI) of obese college students.
3. Methods
3.1. Research Object
To ensure the accuracy and timeliness of this study, we recruited 300 obese college students and extracted 20% of the sample size. The sample size was determined using the formula: Sample size = Total population x 20%. With a total population of 300 individuals, the final study sample size was calculated to be 60 participants, comprising 30 boys and 30 girls. According to G*Power software, which calculated the sample size based on the means difference between two independent means (two groups), the required sample size was also 60 participants. The participants were college students aged between 18 and 23 years, with an average age of 20.40 ± 2.09 years, height of 1.69 ± 0.09 meters, weight of 85.96 ± 10.30 kilograms, and BMI of 30.17 ± 0.42. Obese individuals were screened based on BMI, with a threshold of 28 or above (19, 20). Inclusion criteria included individuals with a BMI equal to or exceeding 28, ensuring the inclusion of obese individuals, college students aged 18 to 23 years to capture a homogeneous sample characteristic of the target demographic, and participants free from significant medical conditions or contraindications to aerobic exercise, ensuring the safety and feasibility of participation in the intervention. Exclusion criteria included individuals with pre-existing medical conditions (e.g., cardiovascular disease, orthopedic injuries) that may contraindicate participation in aerobic exercise or confound the study outcomes, participants taking medications known to influence body weight or mental health outcomes, as these may confound the effects of the aerobic exercise intervention, and pregnant individuals, due to physiological changes that may affect BMI measurements and the safety considerations associated with exercise during pregnancy. By clearly defining and scientifically justifying the inclusion and exclusion criteria, the completeness and rigor of the study design were ensured, ultimately contributing to the validity and reliability of the findings. During the experiment, the 60 obese college students maintained normal study, rest, and diet routines to minimize interference from unrelated factors. To ensure a diverse and representative sample, participants were recruited from different universities and colleges using random sampling methods. Prior to enrollment, subjects were asked to sign a willingness to participate in the study and an informed consent form that clearly explained the purpose, process, and potential risks of the study, emphasizing that they could withdraw at any time. This study was approved by the Ethics Review Committee of Universiti Teknologi Malaysia (approval No.: UTMREC-2024-55).
3.2. Research Method
A pre- and post-test control group design will be used in this study. Subjects were randomly assigned to two groups: Experimental and control, with an equal number of male and female participants in each group. The aerobics exercise training cycle was 12 weeks, with sessions held three times a week, each lasting one hour. This schedule aligns with the teaching arrangement at Yuncheng College, which has 16-week semesters. Students adjust in the first two weeks and prepare for exams in the last two weeks. Additionally, as the climate gets progressively colder, student participation may decrease, potentially affecting the aerobics training effect and test results. Therefore, the experiment period was set at 12 weeks, three times a week.
The experimental group received instruction from professional aerobics teachers, including basic steps, routines, and stretching exercises. Each session consisted of 5 - 10 minutes of preparation, 40 - 50 minutes of teaching and training, and 5 - 10 minutes of relaxation and summary. The aerobics exercise intensity was mainly medium to low, with heart rates controlled at 120 - 150 beats per minute, and the music rhythm adjusted accordingly. The control group engaged in physical exercise activities at the same time, selecting their own activities and aiming to complete more than 5,000 steps per session, based on the regular teaching plan of college sports or their choice within a specified time. Walking about 5,000 to 7,500 steps in an hour is considered a healthy level of activity, helping maintain basic health and physical activity levels. Table 1 explains the exercise programs of the experimental and control groups.
Table 1.
Exercise Plan of Experimental Group and Control Group
| Group | Type of Exercise | Frequency | Duration | Intensity | Progression |
|---|---|---|---|---|---|
| Experimental | Aerobics (taught by professionals: Basic steps, routines, stretching) | 3 times/week | 1 h | Medium to low (heart rate: 120 - 150 bpm) | Progressive intensity based on fitness level |
| Control | Self-selected physical activities aiming for 5000+ steps | 3 times/week | 1 h | Not specified | Not applicable |
The questionnaire survey scale used was the China College Student Mental Health Scale (CCSMHS), compiled by Professor Zheng Richang of Beijing Normal University and promoted by the Ministry of Education. The scale, with a reliability of 0.764 to 0.893, consists of 104 questions. Symptoms described by each question were graded from 1 (no) to 5 (always) according to their frequency of occurrence (21, 22). The higher the score, the worse the mental health status. The scale is further divided into 12 symptom subscales, including somatization, anxiety, depression, low self-esteem, social withdrawal, social aggression, psychosexual disorders, paranoia, compulsion, dependence, impulsivity, and psychotic tendencies. The mental health level was analyzed based on the scores of each subscale (23), as shown in Figure 1.
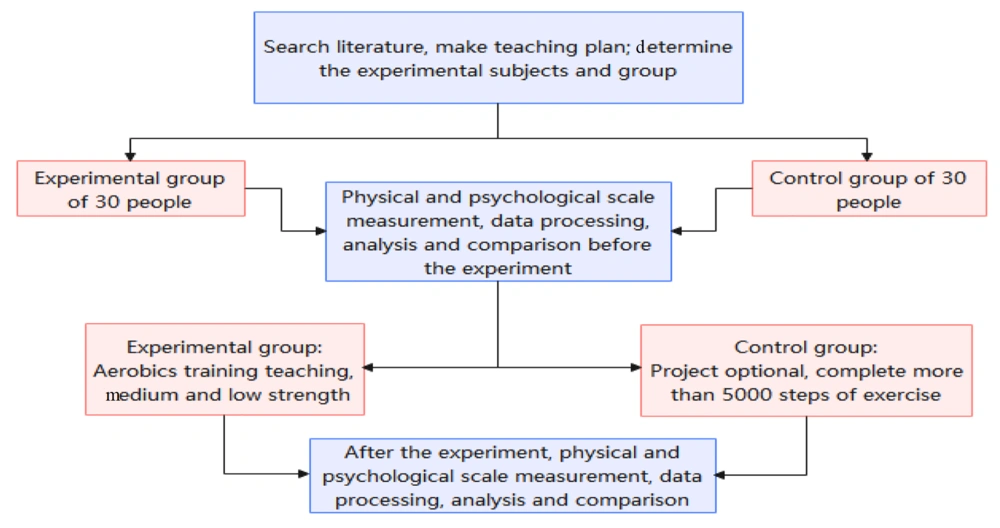
Figure 1.
Flow chart of selecting subjects
This psychological survey questionnaire is consistent with the mental health metrics for Chinese college students. By collecting questionnaire data before and after the experiment and using SPSS 25.0 (including descriptive analysis, analysis of variance, paired t-test analysis, independent sample t-test, comparative mean, etc.), Excel, and other software to summarize and analyze the data, the experimental conclusions were drawn.
4. Results
4.1. Influence of Aerobics on Body Mass Index of College Students with Obesity
After 12 weeks of moderate to low-intensity aerobics training, the weight loss effects of the experimental and control groups were measured. The chosen BMI index reflects the basic condition of the students' bodies. As shown in Table 2, before the experiment, there were no significant differences in age, height, weight, and BMI between the experimental group and the control group (P > 0.05). This data analysis ensures that the differences in height and weight between the experimental and control groups will not affect the experiment's accuracy, allowing the experiment to proceed smoothly. After the experiment, there were still no significant differences in age, height, and weight data between the experimental and control groups (P > 0.05), but the BMI data showed a P-value of < 0.01, with a range of change of 1.30 ± 0.05, indicating significant differences between the experimental and control groups after the experiment. This section focuses on the comparative analysis of the data before and after the experiment for both groups. Descriptive analysis was performed to reflect the data differences before and after the experiment.
Table 2.
Basic Information of Experimental Group and Control Group Before Experiment a
| Item | Experience Group (30) | Control Group (30) | Variation Value | P-Value |
|---|---|---|---|---|
| Age | ||||
| BE | 20.67 ± 2.60 | 20.13 ± 1.38 | 0.54 ± 1.22 | 0.33 |
| AE | 20.67 ± 2.60 | 20.13 ± 1.38 | 0.54 ± 1.22 | 0.33 |
| Height (m) | ||||
| BE | 1.69 ± 0.09 | 1.68 ± 0.09 | 0.001 ± 0.00 | 0.97 |
| AE | 1.70 ± 0.09 | 1.69 ± 0.09 | 0.005 ± 0.00 | 0.77 |
| Weigh (kg) | ||||
| BE | 86.02 ± 10.00 | 85.90 ± 10.77 | 0.115 ± 0.77 | 0.97 |
| AE | 78.72 ± 9.76 | 81.81 ± 10.46 | 3.088 ± 0.70 | 0.24 |
| BMI | ||||
| BE | 30.18 ± 0.73 | 30.16 ± 0.73 | 0.029 ± 0.00 | 0.88 |
| AE | 27.32 ± 0.84 | 28.62 ± 0.89 | 1.296 ± 0.05 | 0.00 |
Abbreviations: BE and AE ,before experiment and after experiment; BMI, Body Mass Index.
a Values are expressed as mean ± SD.
The index changes of the experimental and control groups are shown in Table 2. The height of the students in the experimental group increased from 1.69 ± 0.09 before the experiment to 1.69 ± 0.09 after the experiment, with a change range of 0.01 ± 0.00, P > 0.05, showing no significant differences. For college students, short-term exercise is unrealistic for height growth, and the same is true for aerobics. There was no significant difference in height before and after the experiment. Variations such as chest bulging, hunchback, and different test times (e.g., morning measurements) may cause slight differences in height data but do not affect the experiment's accuracy. Body weight decreased from 86.02 ± 10.00 before the experiment to 78.72 ± 9.76 after the experiment, with a range of 7.29 ± 0.24, P < 0.05, showing significant differences. Body Mass Index decreased from 30.18 ± 0.73 before the experiment to 27.32 ± 0.84 after the experiment, with a range of 2.86 ± 0.11, P < 0.01, showing significant differences. Therefore, it can be interpreted that a certain duration of aerobics exercise can achieve weight loss. The rise in height is due to the improvement of body posture after practicing aerobics.
The height of students in the control group increased from 1.68 ± 0.09 before the experiment to 1.69 ± 0.09 after the experiment, with a change range of 0.01 ± 0.00, P > 0.05, showing no significant differences. Body weight decreased from 85.90 ± 10.77 before the experiment to 81.81 ± 10.46 after the experiment, with a range of 83.19 ± 0.31, P < 0.05, showing significant differences. Body Mass Index decreased from 30.16 ± 0.73 before the experiment to 28.62 ± 0.89 after the experiment, with a range of 1.54 ± 0.84, P < 0.01, showing significant differences. Therefore, it can be interpreted that general and regular physical activity can achieve weight loss. It can be observed that the proportion of weight and BMI reduction is higher in the experimental group, indicating that aerobics exercise has a more substantial effect on weight loss among obese college students.
4.2. The Influence of Aerobics on the Mental Health of Obese College Students
Table 3 shows the mental health levels of students in the experimental and control groups, tested by the Mental Health Scale of Chinese College Students before the experiment. The test results were statistically analyzed, and the descriptive statistics of the overall mental health levels were compared with the national average level. Table 3 displays the 12 dimensions of mental health tests for both the experimental and control groups. The results indicate no significant difference in the mental health test data of the two groups before the experiment (P > 0.05), excluding interference caused by differences in the data of the two groups.
Table 3.
Comparison with the National Average Level in 12 Dimensions Before the Experiment a
| Item | Experience Group (30) | Control Group (30) | P-Value | National Average | Effect Size (Cohen's d) |
|---|---|---|---|---|---|
| Somatization | 15.03 ± 1.61 | 15.13 ± 1.613 | 0.65 | 13.27 ± 4.24 | -0.060 |
| Anxiety | 17.3 ± 2.38 | 17.17 ± 2.321 | 0.33 | 16.60 ± 5.36 | 0.055 |
| Depression | 16.47 ± 2.01 | 16.53 ± 2.389 | 0.91 | 16.00 ± 5.37 | −0.027 |
| Inferiority | 16.97 ± 3.57 | 17.13 ± 3.481 | 0.10 | 15.12 ± 5.15 | −0.045 |
| Paranoid | 16.93 ± 2.33 | 17.17 ± 4.251 | 0.76 | 15.13 ± 4.95 | −0.074 |
| Compulsion | 18.20 ± 2.73 | 18.11 ± 2.857 | 0.79 | 18.23 ± 5.32 | 0.032 |
| Withdrawal | 16.33 ± 2.10 | 16.43 ± 2.201 | 0.54 | 15.59 ± 5.37 | −0.046 |
| Aggression | 14.03 ± 2.39 | 14.00 ± 2.491 | 0.75 | 14.27 ± 4.38 | 0.012 |
| Sex psychology | 12.08 ± 3.44 | 12.17 ± 3.415 | 0.264 | 11.37 ± 4.01 | −0.026 |
| Dependence | 16.37 ± 2.70 | 16.20 ± 2.469 | 0.169 | 16.78 ± 5.45 | 0.066 |
| Impulse | 14.58 ± 2.19 | 14.47 ± 2.29 | 0.38 | 14.72 ± 4.49 | 0.049 |
| Psychosis | 11.10 ± 2.40 | 11.20 ± 2.43 | 0.48 | 12.00 ± 3.65 | −0.041 |
a Values are expressed as mean ± SD.
In terms of somatization, the experimental group exhibited a mean score of 15.03 ± 1.608, while the control group had a mean score of 15.13 ± 1.61, both exceeding the national average level of 13.27 ± 4.24. Similarly, for inferiority, the experimental group had a mean score of 16.97 ± 3.57, and the control group had a mean score of 17.13 ± 3.48, both higher than the national average level of 15.12 ± 5.15. Additionally, in terms of paranoia, the experimental group had a mean score of 16.93 ± 2.33, while the control group had a mean score of 17.17 ± 4.25, both surpassing the national average level of 15.13 ± 4.95.
Furthermore, although the average scores for anxiety, depression, compulsion, withdrawal, and sexual psychology were higher than the national average, the differences were relatively small, suggesting that the research population may exhibit some psychological issues in these areas. Conversely, the average levels of aggression, dependence, impulse, and psychosis were all lower than the national average, indicating that the subjects exhibited better psychological health in these aspects.
Table 4 shows the mental health levels of the experimental and control groups after the experiment, compared and analyzed against the national average level. The data results from Table 4 demonstrate.
Table 4.
Comparison Results with the National Average Level in 12 Dimensions After the Experiment a
| Item | Experience Group (30) | Control Group (30) | P Value | National Average | Effect Size (Cohen's d) |
|---|---|---|---|---|---|
| Somatization | 12.30 ± 1.60 | 13.67 ± 16.26 | 0.00 | 13.27 ± 4.24 | -0.119 |
| Anxiety | 14.13 ± 1.89 | 16.54 ± 2.16 | 0.00 | 16.60 ± 5.36 | -1.201 |
| Depressed | 14.20 ± 2.10 | 15.01 ± 2.28 | 0.00 | 16.00 ± 5.37 | -0.369 |
| Inferiority | 14.87 ± 0.55 | 15.70 ± 0.58 | 0.00 | 15.12 ± 5.15 | -2.024 |
| Paranoid | 15.07 ± 2.15 | 15.90 ± 2.01 | 0.01 | 15.13 ± 4.95 | -0.401 |
| Compulsion | 15.17 ± 3.10 | 16.03 ± 2.43 | 0.00 | 18.23 ± 5.32 | -0.310 |
| Withdrawal | 13.97 ± 1.45 | 15.03 ± 1.72 | 0.00 | 15.59 ± 5.37 | -0.668 |
| Aggression | 12.74 ± 1.89 | 13.33 ± 1.94 | 0.00 | 14.27 ± 4.38 | -0.309 |
| Sex psychology | 10.38 ± 1.38 | 11.27 ± 1.20 | 0.02 | 11.37 ± 4.01 | -0.735 |
| Dependence | 13.97 ± 2.36 | 14.23 ± 2.45 | 0.04 | 16.78 ± 5.45 | -0.108 |
| Impulse | 12.53 ± 2.57 | 13.47 ± 2.33 | 0.00 | 14.72 ± 4.49 | -0.384 |
| Psychosis | 9.87 ± 2.01 | 10.83 ± 1.64 | 0.000 | 12.00 ± 3.65 | -0.538 |
a Values are expressed as mean ± SD.
Somatization: 12.30 ± 1.60 in the experimental group and 13.67 ± 16.26 in the control group, P < 0.01, indicating a statistically significant difference after the experiment. This showed that the experimental group performed better in terms of physical symptoms. The experimental group also had a somatization score lower than the national average of 13.27 ± 4.24, indicating that the experimental group was relatively healthier in terms of somatization. Anxiety: 14.13 ± 1.89 in the experimental group and 16.54 ± 2.16 in the control group, P < 0.01, indicating a statistically significant difference after the experiment. The anxiety scores of the experimental group were also lower than the national average of 16.60 ± 5.36, indicating that the experimental group performed better in terms of anxiety. Depression: 14.20 ± 2.19 in the experimental group and 15.03 ± 2.28 in the control group, P < 0.01, indicating statistically significant differences after the experiment. Depression scores in the experimental group were also lower than the national average of 16.00 ± 5.37, indicating that the experimental group had a positive performance in terms of depression. Inferiority: 14.87 ± 0.55 in the experimental group and 15.70 ± 0.58 in the control group, P < 0.01, indicating a statistically significant difference after the experiment. Compared with the national average of 15.12 ± 5.15, the experimental group had lower inferiority scores, showing a positive effect on self-esteem. Paranoia: 15.07 ± 2.15 in the experimental group and 15.90 ± 2.01 in the control group, P < 0.05, indicating a statistically significant difference after the experiment. Paranoia scores in the experimental group were relatively low but close to the national average of 15.13 ± 4.95. Compulsion: 15.17 ± 3.10 in the experimental group and 16.03 ± 2.43 in the control group, P < 0.01, indicating a statistically significant difference after the experiment. The compulsion score of the experimental group was also significantly lower than the national average of 18.23 ± 5.32, indicating that the experimental group was healthier in terms of compulsive symptoms. Withdrawal: 13.97 ± 1.45 in the experimental group and 15.03 ± 1.72 in the control group, P < 0.01, indicating a statistically significant difference after the experiment. At the same time, the withdrawal score of the experimental group was also lower than the national average of 15.59 ± 5.37, indicating that the experimental group was more active in terms of social withdrawal.
Aggression: 12.74 ± 1.89 in the experimental group and 13.33 ± 1.94 in the control group, P < 0.01, indicating statistically significant differences after the experiment. The aggression score of the experimental group was also lower than the national average of 14.27 ± 4.38, indicating that the experimental group was more moderate in terms of aggressive behavior. Psychosexual health: 10.38 ± 1.38 in the experimental group and 11.27 ± 1.20 in the control group, p < 0.05, indicating a statistically significant difference after the experiment. The psychosexual score of the experimental group was relatively lower than the national average of 11.37 ± 4.01, indicating improvement in psychosexual health. Dependence: 13.97 ± 2.36 in the experimental group and 14.23 ± 2.45 in the control group, P < 0.05, indicating a statistically significant difference after the experiment. The dependence score of the experimental group was relatively lower than the national average of 16.78 ± 5.45, indicating success in reducing external dependence. Impulsivity: 12.53 ± 2.57 in the experimental group and 13.47 ± 2.33 in the control group, P < 0.01, indicating statistically significant differences after the experiment. Impulsivity scores in the experimental group were also lower than the national average of 14.72 ± 4.49, indicating greater stability in impulsive behavior. Psychosis: 9.87 ± 2.01 in the experimental group and 10.83 ± 1.64 in the control group, P < 0.01, indicating a statistically significant difference after the experiment. The psychopathic tendency score of the experimental group was also lower than the national average of 12.00 ± 3.65, indicating good mental health in the experimental group.
The aerobics exercise scores of the experimental group were significantly lower on most mental health items than those of the control group and also lower than the national average on many items. This shows that the aerobics exercise received by the experimental group has a remarkable effect on mental health.
5. Discussion
Aerobic exercises have been shown to significantly reduce symptoms of anxiety and depression (24). Aerobics exercises are usually performed in groups, encouraging social interaction and positive body expression (25). By engaging in this social activity and learning new aerobics moves, participants may improve their self-esteem and confidence, enhancing their perception of themselves (26). Aerobics can help participants reduce the sense of pressure; exercise helps to release tension in the body, improve the ability to cope with challenges, and reduce the occurrence of negative emotions (27). At the same time, sustained low-intensity exercise will not cause damage to the body, ensuring physical recovery (28). Aerobics can enhance cardiovascular health, improve muscle and joint flexibility, increase metabolic rate, and contribute to weight loss and improved body shape (29). Improved physical health can also indirectly improve mental health, as there is a strong link between physical and mental health. These positive mental and physical health effects can make aerobics an attractive intervention. Therefore, aerobics is very helpful in improving the overall health of obese college students.
5.1 Conclusions
In this study, we investigated the impact of aerobic exercise on the mental health of obese college students using a pre- and post-test control group design. Several key findings were identified. Aerobic exercise not only contributes to improved physical health but also significantly enhances the mental well-being of obese college students. Following participation in a 12-week aerobic exercise program, the experimental group exhibited significantly reduced symptoms of somatization, anxiety, depression, inferiority, paranoia, withdrawal, and other psychological symptoms, alongside notable improvements in self-esteem and confidence.
Comparison between the experimental and control groups revealed that obese college students engaging in aerobic exercise demonstrated superior mental health outcomes. This underscores the potential of aerobic exercise as a positive intervention for mental health, particularly among obese college students. By implementing pertinent policies and offering support, aerobic exercise can be optimally utilized to enhance the mental health of obese college students, thereby elevating their overall quality of life.
5.2. Limitations
Several limitations were encountered in this study. The relatively small sample size and short duration may limit the generalizability and long-term applicability of the findings. Additionally, the exclusive focus on aerobic exercise as the intervention neglects potential influences of other factors such as diet, sleep, and social support. The lack of follow-up and consideration of confounding variables further complicates the interpretation of results. Moreover, the measurement tools used to assess mental health outcomes may not fully capture the complexity of mental health among obese college students. Future research with larger sample sizes, longer follow-up periods, and comprehensive assessment of confounding variables is warranted to further elucidate the relationship between aerobic exercise and mental health outcomes in this population.