


1. Background
The global burden of musculoskeletal disorders (MSDs) is increasing (1). Musculoskeletal disorders often affect workers who engage in repetitive tasks, adopt awkward postures, or perform heavy lifting (2). Among healthcare professionals (HCPs), work-related MSDs are common, with documented rates over a one-year period ranging from 28% to 96% (3). A positive correlation has been identified between the severity of low back pain and factors such as work demands, job characteristics, ergonomics, posture, and worker activities (4).
Human factors engineering, or ergonomics, examines how humans interact with technology, systems, and their environment. Ergonomics applies theories and approaches to optimize both system performance and human well-being (5). A study conducted in Oman among biomedical scientists revealed that 54.5% had good knowledge of ergonomics, despite 93.6% possessing high qualifications (6). This finding exceeds the 25.5% reported in a Nigerian study on the ergonomics knowledge of medical laboratory scientists (7). Additionally, 41.2% of nurses were found to have limited knowledge of ergonomic principles (8). In Pakistan, 40.1% of dental practitioners were reported to have poor ergonomic knowledge (9). Another Nigerian study showed that although 96.4% of surgeons and physicians had high ergonomics knowledge, only 13.9% implemented ergonomic practices (10). A study from Iran demonstrated an inverse relationship between ergonomics knowledge and MSDs among physiotherapists (11). Furthermore, personalized ergonomic interventions for nurses significantly reduced ergonomic risks, as measured by rapid entire body assessment (REBA) scores (12). Similarly, a study in Thailand showed that ergonomics interventions reduced MSDs in the arm, upper back, and lower back regions (13). However, there is limited data on the prevalence of MSDs and the level of ergonomic knowledge and practices among HCPs in the United Arab Emirates (UAE).
2. Objectives
This study aims to assess the prevalence of MSDs among HCPs, explore the association between ergonomic knowledge, practice, and MSDs, and identify predictors of ergonomic knowledge.
3. Methods
A cross-sectional study was conducted among doctors and nurses in the northern Emirates of the UAE from September 4, 2022, to December 30, 2022. Participants were 18 years or older, of any gender or nationality, and provided informed consent. Healthcare professionals who were unavailable, declined consent, or had pre-existing degenerative musculoskeletal diseases were excluded.
3.1. Sample Size Determination and Sampling
Convenience sampling was employed. The sample size was calculated using the formula n = Z2pq/L2, where n represents the sample size, p is the estimated proportion of HCPs with MSDs, taken as 0.38 based on a study in the UAE (14), q is 0.62, L is the desired margin of error (0.05), and Z corresponds to a 95% confidence level (1.96). Considering a potential 10% refusal rate, the calculated sample size was 398. When the eligible participants were approached, 18 declined, resulting in a response rate of 96%, with 380 participants included in the study.
3.2. Instrument for Data Collection, Validation, and Pilot Testing
Data was collected using a self-administered questionnaire consisting of two parts: The first part was developed by the research team and covered socio-demographics, nutrition, job characteristics, and ergonomic knowledge and practices. The second part comprised the standardized Nordic Musculoskeletal Questionnaire (NMQ) (15). Content validation of the first part was performed by experts, including an orthopedic surgeon, a community medicine specialist, and two musculoskeletal and sports physiotherapists. After validation, the final questionnaire was used for data collection.
3.3. Ethical Considerations
Ethical approval was obtained from the Institutional Review Board (IRB/COM/STD/81/April-2022). Permissions were secured from the data collection sites, and participants' privacy was maintained throughout the study. Participants were approached in person, provided with informed consent, and informed of their right to decline participation. The researchers ensured confidentiality and anonymity, and access to the data was limited to IRB members and the research team.
3.4. Statistical Analysis
Data was analyzed using the statistical package for social sciences (SPSS version 28). The chi-square test was used to assess associations, while binary and multivariable logistic regression models were employed to identify predictors of ergonomic knowledge. Significant factors from the binary regression analysis were further analyzed using multivariable logistic regression to control for potential confounding factors. By directly approaching potential participants and using a concise questionnaire, the nonresponse rate was minimized to about 4%.
Ergonomic knowledge and practice questions were scored, with correct answers receiving one point and incorrect answers receiving zero. Ergonomic knowledge and practices were considered inadequate when participant scores fell below the median values of six for knowledge and eight for practice.
4. Results
4.1. Sociodemographic Characteristics
Table 1 presents the demographic and job characteristics of the participants. The majority of participants were under 35 years old, predominantly female, and from South-East Asia World Health Organization (WHO) Region countries. Most participants held qualifications below a master’s degree (such as a bachelor's or higher diploma) and were classified as either overweight or obese.
Table 1.Demographics and Job-related Variables (n = 380)
| Variable and Subcategories | No. (%) |
|---|---|
| Age category (y) | |
| < 35 | 191 (50.3) |
| ≥ 35 | 189 (49.7) |
| Gender | |
| Male | 92 (24.2) |
| Female | 288 (75.8) |
| Nationality (WHO regions) | |
| South-East Asia | 278 (73.2) |
| Eastern Mediterranean | 56 (14.7) |
| Others | 46 (12.1) |
| Level of education | |
| Below master’s degree | 270 (71.1) |
| Master’s degree and above | 110 (28.9) |
| Body mass index categories | |
| Normal (18.5 - 24.9) | 162 (42.6) |
| Underweight (< 18.5) | 12 (3.2) |
| Overweight/obese (> 24.9) | 206 (54.2) |
| Job | |
| Doctor | 139 (36.6) |
| Nurse | 241 (63.4) |
| Specialty (doctor) | |
| GP/emergency | 31 (22) |
| Physician | 38 (27) |
| Surgeon | 40 (28.4) |
| Dentist | 12 (8.5) |
| Others | 20 (14.2) |
| Total years of experience | |
| ≤ 5 | 86 (22.6) |
| 6 - 15 | 197 (51.8) |
| > 15 | 97 (25.5) |
| Total working hours per week | |
| ≤ 48 | 338 (88.9) |
| > 48 | 42 (11.1) |
| Workplace provided ergonomics training and promote awareness | |
| No | 332 (87.4) |
| Yes | 48 (12.6) |
Most HCPs had between 6 - 15 years of experience and worked 48 hours or less per week. Additionally, 87.4% of the participants reported that their workplaces did not provide ergonomics training or awareness programs.
4.2. The Prevalence and Sites of Musculoskeletal Disorders
Figure 1 illustrates the prevalence of MSDs among the studied HCPs. Nearly 91% of participants experienced MSDs in at least one body part over the past twelve months.
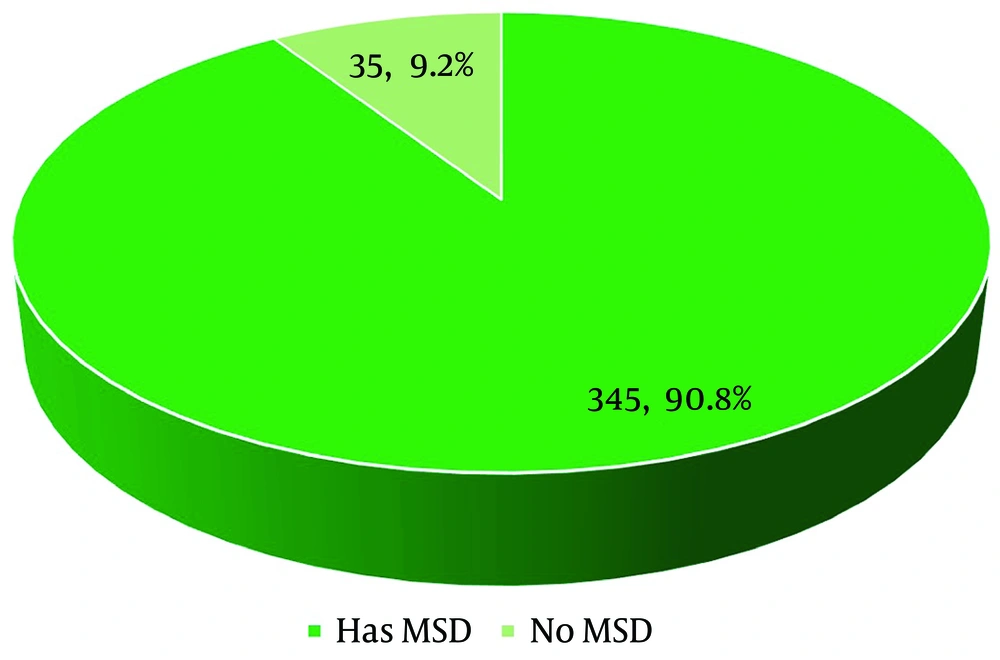
Figure 1.
The prevalence of musculoskeletal disorders in at least one body site among healthcare professionals during the past twelve-months
Figure 2 presents the prevalence of MSDs at various body sites. The lower back was the most affected area, with 56% of participants reporting discomfort, followed by the upper back (43.4%), neck (39.2%), shoulder (38.9%), and elbow (21.3%).
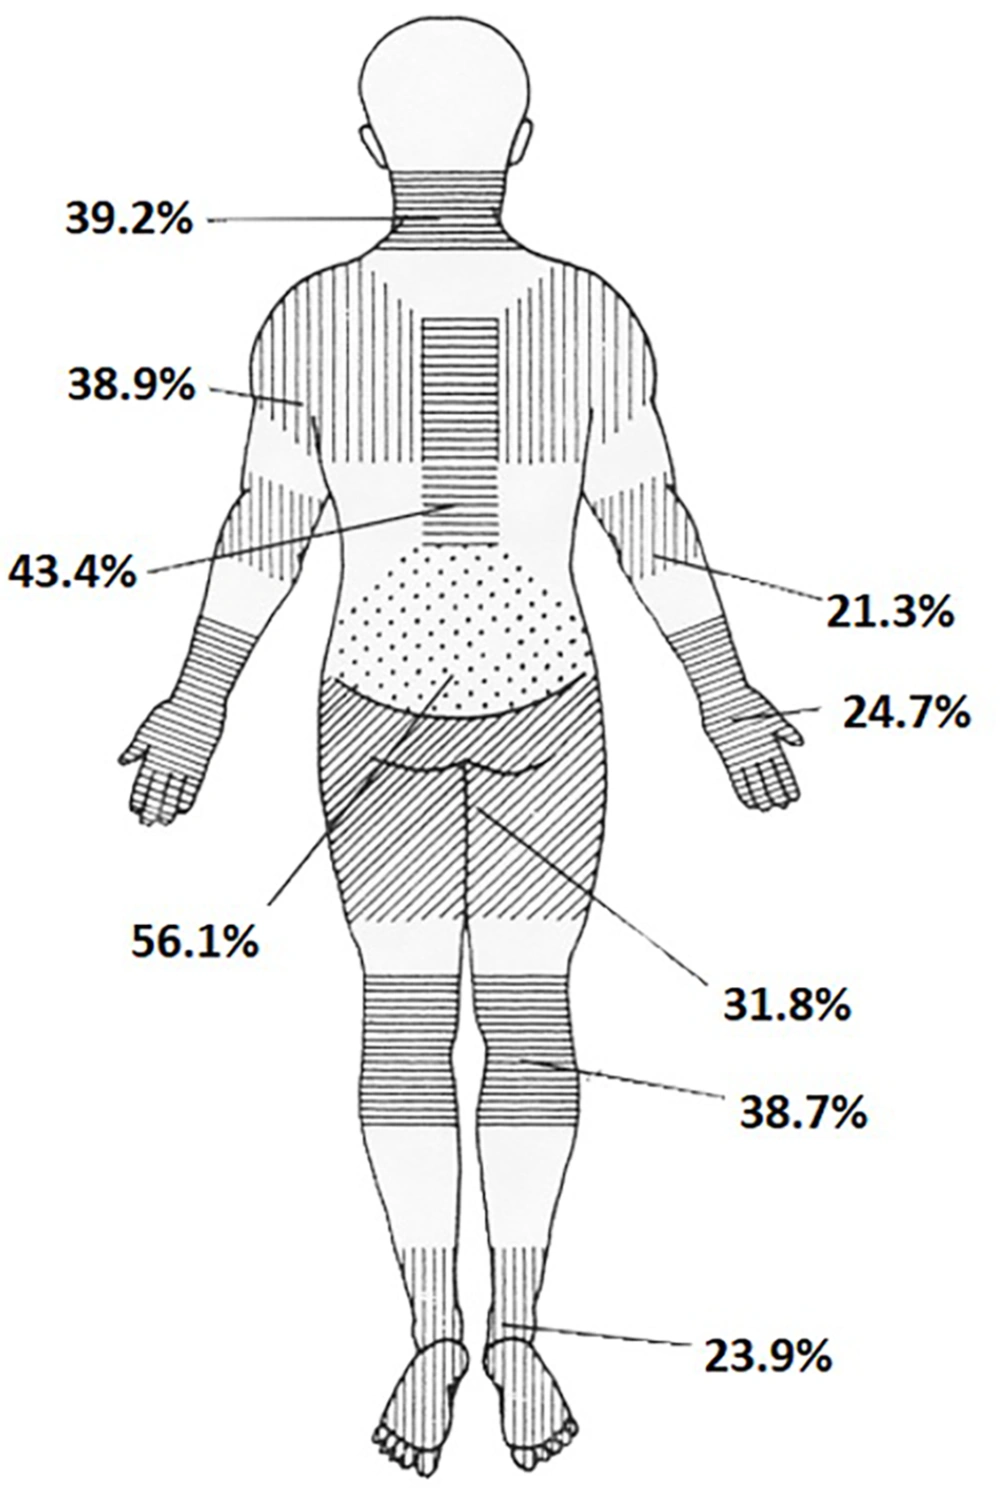
Figure 2.
Prevalence of musculoskeletal disorders at different body sites among healthcare professionals during the past twelve-months
4.3. The Ergonomic Knowledge, Practice and Musculoskeletal Disorders
The analysis revealed that 61.8% (n = 235) of HCPs had inadequate ergonomic knowledge, while 63.7% (n = 242) practiced correct ergonomic techniques. Table 2 shows a significant association between MSDs and both ergonomic knowledge and practices. The incidence of MSDs was notably higher among participants with inadequate ergonomic knowledge and incorrect practices.
Table 2.The Association Between Musculoskeletal Disorders and Knowledge and Practice of Ergonomics
Abbreviation: MSDs, musculoskeletal disorders.
a Values are expressed as No. (%).
b The chi-square test.
4.4. The Predictors of Inadequate Ergonomics Knowledge
Table 3 shows the predictors of inadequate ergonomic knowledge. Initially, nurses were found to be 3.3 times more likely than doctors to have inadequate ergonomic knowledge, but this association became insignificant after adjusting for other variables. Healthcare professionals with less than 15 years of experience were at a higher risk of having inadequate ergonomic knowledge. Additionally, professionals working in environments where ergonomics training and awareness were not promoted were 3.7 times more likely to lack ergonomic knowledge. Moreover, HCPs with incorrect ergonomic practices were about 90% more likely to have inadequate ergonomic knowledge.
Table 3.Predictors of Inadequate Ergonomics Knowledge
| Variables and Subcategory | No. | Crude Odds Ratio | Confidence Interval | P-Value a | Adjusted Odds Ratio | Confidence Interval | P-Value b | ||
|---|---|---|---|---|---|---|---|---|---|
| Age | |||||||||
| < 35 | 191 | 1.9 | 1.2 | 2.8 | 0.004 | 1.1 | 0.6 | 2.0 | 0.886 |
| ≥ 35 | 189 | 1 | 1 | ||||||
| Gender | |||||||||
| Male | 92 | 1 | 1 | ||||||
| Female | 288 | 2.7 | 1.7 | 4.4 | < 0.001 | 1.7 | 0.9 | 2.9 | 0.069 |
| Education | |||||||||
| Below masters | 270 | 2.9 | 1.8 | 4.6 | < 0.001 | 1.1 | 0.4 | 2.5 | 0.886 |
| Masters and above | 110 | 1 | 1 | ||||||
| Job | |||||||||
| Doctor | 139 | 1 | 1 | ||||||
| Nurse | 241 | 3.3 | 2.1 | 5.1 | < 0.001 | 2.0 | 0.9 | 4.6 | 0.081 |
| Number of years worked | |||||||||
| ≤ 5 | 86 | 2.1 | 1.2 | 3.9 | 0.012 | 1.6 | 0.7 | 3.8 | 0.286 |
| 6 - 15 | 197 | 2.7 | 1.6 | 4.4 | < 0.001 | 1.9 | 1.0 | 3.5 | 0.049 |
| > 15 | 97 | 1 | 1 | ||||||
| Workplace provide ergonomic training and promote awareness | |||||||||
| No | 332 | 3.5 | 1.9 | 6.6 | < 0.001 | 3.7 | 1.9 | 7.2 | < 0.001 |
| Yes | 48 | 1 | 1 | ||||||
| Practice ergonomic | |||||||||
| No | 138 | 2.5 | 1.6 | 3.9 | < 0.001 | 1.9 | 1.1 | 3.0 | 0.014 |
| Yes | 242 | 1 | 1 | ||||||
a Binary logistic regression analysis.
b Multivariable logistic regression analysis.
5. Discussion
5.1. The Prevalence and Sites of Musculoskeletal Disorders
We found a high prevalence of MSDs (91%) among HCPs, which is consistent with the studies by Zayed et al. (92.7%) and Elghazally et al. (88%) (16, 17). Previous studies attributed this high prevalence to a heavy workload and a lack of awareness about preventive approaches.
The lower back was the most affected site (56.1%), while the elbow was the least affected (21.3%). These findings align with Zayed et al., who reported 56.5% and 18.5%, respectively, for the same sites (16), and Alrimali et al., who found 68.9% and 16.9%, respectively (18). Additionally, our study found knee and ankle/feet MSD pain at 38.7% and 23.9%, which differs from Aleid et al., who reported 20.0% and 25.0%, respectively, among nurses in critical care units (19).
5.2. The Ergonomic Knowledge and Practice
Most of the HCPs in our study (68%) demonstrated inadequate ergonomics knowledge, which aligns with findings from Nigeria (74.5%) (7) and Iran (77.3%) (8). However, Saremi et al.'s study in Iran reported good ergonomic knowledge among HCPs (20). This difference could be attributed to variations in the study population and the assessment tools used.
Our study also revealed lower MSD rates among participants with adequate ergonomic knowledge and practices, consistent with findings from other researchers who reported a negative correlation between ergonomic knowledge and MSDs (8).
5.3. The Predictors of Ergonomic Knowledge
The current findings are consistent with Alwahaibi et al.'s study in Oman, which found no association between age, gender, education level, and job type with ergonomic knowledge among biomedical scientists (6). We discovered that HCPs under the age of 35 were more likely to have inadequate ergonomic knowledge, similar to a study from India, where younger dental practitioners were at a higher risk of poor or fair ergonomic knowledge (21).
Initially, lower educational levels appeared to increase the risk of inadequate knowledge by 2.9 times. However, this effect became insignificant after adjusting for other variables, aligning with a Saudi study that showed higher education improves ergonomic knowledge. The Saudi study found that Board-certified employees had 3.6 times better ergonomic knowledge than bachelor's degree holders (22).
Contrary to Oladeinde et al.'s study (7), which found that males were more likely to have lower ergonomic knowledge than females, our study suggests that gender differences are influenced by other variables, which may explain the inconsistent findings across studies.
Regarding job type, we found that nurses were 3.3 times more likely than doctors to have lower ergonomic knowledge, but this difference became insignificant after controlling for other variables in multivariable logistic regression. This may be due to inadequate ergonomic training for nurses, which tends to focus primarily on clinical skills, a trend observed in a similar study (22).
Our study also found that participants whose facilities did not provide ergonomics training had a higher risk of inadequate ergonomic knowledge. This aligns with Alruwaili et al.'s study in Saudi Arabia, which showed that ergonomic training reduced the risk of MSDs (23). Furthermore, our results demonstrated that ergonomic knowledge and practice are interconnected and significantly related to MSDs. This contrasts with Moosa and Bhayat's study from South Africa, which found no correlation between ergonomic knowledge and practice among dental students (24), while an Egyptian study among dentists did report a significant correlation (25).
Theories suggest that MSDs result from workplace exposures that lead to cumulative injuries and fatigue, emphasizing the importance of ergonomics in designing safer work environments (26). Individual and environmental factors may modify the cumulative workload, potentially explaining the varying results observed across different studies (5).
The present study underscores the need to provide ergonomic knowledge and ensure that ergonomic principles are practiced to reduce MSDs among HCPs. Hospital-wide ergonomics interventions, coupled with staff education, are essential strategies for mitigating MSDs. A systems-thinking approach can help understand the complex relationship between ergonomic knowledge, ergonomic practices, and the prevalence of MSDs (27). By considering these factors holistically, we can better address and mitigate MSDs in healthcare settings.
However, it is equally important to identify the root causes of MSDs, implement targeted interventions, and evaluate their effectiveness over time, while also considering the role of organizational culture. Longitudinal studies could provide valuable insights into these areas and inform more effective prevention strategies.
5.4. Limitation
We cannot generalize the findings since the sample was selected from a limited number of healthcare facilities and because a convenience sampling method was used to recruit participants. Additionally, there is the potential for recall bias due to the self-reported nature of the data. The cross-sectional study design also limits the ability to establish causal relationships between variables. A longitudinal study with a randomly selected sample would provide a deeper understanding of the dynamic relationships between the variables and offer more robust insights into the causal factors.
5.5. Conclusions
A very high prevalence of MSDs was observed among HCPs, with the lower back being the most commonly affected site. Significant predictors of inadequate ergonomic knowledge included the number of years worked, the presence of ergonomics training in the workplace, and inadequate ergonomic practice. This study highlights the need for targeted ergonomic-focused training programs to ensure HCPs are knowledgeable about and consistently practicing proper techniques to prevent MSDs.

