


1. Background
Drug abuse is a chronic disease that alters brain structure and function (1). The non-medical use of opioids is a growing concern for public health and law enforcement (2). Globally, 296 million people use drugs, with 60 million affected by opioids, and the problem is escalating (3). In Iran, approximately 2 million people suffer from drug abuse disorders, highlighting the need for stronger prevention and treatment efforts (4). Drug abuse affects an individual's activity as well as the proper function of the brain (5). Accurate, rapid, and early assessments are crucial in identifying brain damage and preventing further secondary damage, facilitating treatment and rehabilitation (6-8).
The Bender-Gestalt test (BGT), developed by Lauretta Bender in 1938, is a visual-motor tool used to assess cognitive and motor skills by replicating geometric shapes (9). The BGT clinical version (BGT-C) is particularly effective in detecting neurological impairments, offering a cost-effective, non-invasive alternative to brain imaging for early diagnosis and intervention (10). The BGT is a widely used, quick, and accessible neuropsychological tool that reliably differentiates between organic and functional impairments in children and adults, remaining a key assessment tool in neurology (10, 11). Bender selected nine forms from Wertheimer's famous 1923 paper for use in the test (12). The growing issue of drug abuse raises public health concerns, increasing the risks of brain injuries, cognitive deficits, and functional impairments, thereby emphasizing the need to study its neuropsychological impact.
The documentation includes Bender's experiments with Gestalt's visuals. Bender began employing Wertheimer's designs before 1932, as noted by Billingslea (13). Developed by Bender in 1940, the BGT assesses intelligence and detects functional or neurological impairments by having subjects copy nine geometric designs. Rooted in Gestalt psychology, it remains widely used despite numerous adaptations (12). Drug abuse often leads to brain damage through direct effects, risky behaviors, infections, or poor lifestyles, emphasizing the need for early brain assessment in this group (9). The BGT visual-motor test, rooted in Gestalt theory, was designed to assess children's maturational levels and is widely used by clinical psychologists to screen for neurological and neuropsychological issues (14, 15). The most important features of the test include being abbreviated, non-verbal, standardized, and perceptual-motor. Non-verbal responses in this test have minimized cultural and socio-religious differences (16). The BGT is used to detect organic brain damage by evaluating visual-motor function and perception function (14). Drug abuse can cause brain damage, complicating assessment and treatment. While widely studied in psychiatric disorders, its impact on visual-motor functioning lacks research. Neuropsychological assessment is vital for prognosis, recovery evaluation, and guiding interventions (17). The BGT assesses visual and motor abilities, often impaired in brain injuries, making it valuable for detecting neuropsychological abnormalities, which can be exacerbated by drug abuse (10). In examining neuropsychology and drug abuse, studies have shown that after abusing marijuana, memory and concentration function are reduced (18). den Hollander et al. showed that after abusing ecstasy, the volume of the hippocampus (long-term memory manager) is smaller, and generally, gray matter is lower (19). Some studies suggest heroin alone may not cause neuropsychological disorders, but others indicate that combining it with other drugs or long-term use can lead to visual-motor impairment (17, 20). Neuropsychological disorders have also been shown to occur after abusing methamphetamine in human samples (21). Studies have shown that patients with drug abuse have a weaker performance in the BGT. Also, the use of BGT in screening people with drug abuse can prevent additional brain imaging (20). The rationale for comparing BGT results between individuals with drug abuse and healthy individuals is to understand how drug abuse impacts neuropsychological performance. This study uses the BGT to compare neuropsychological performance between drug-abusing individuals and healthy controls, aiming to assess brain injury severity and improve early diagnosis. It hypothesizes that drug-abusing individuals will show more visual-motor errors and lower brain injury indices, enhancing understanding of drug abuse's neuropsychological impact.
2. Objectives
The study aimed to evaluate the BGT's ability to detect brain injuries in individuals with drug abuse compared to healthy individuals by: (A) Comparing brain injury indices on the BGT; (B) examining visual-motor errors (e.g., rotation, omission) in individuals with drug abuse.
3. Methods
3.1. Study Design
This study evaluated the accuracy of the BGT in detecting brain injuries in individuals with drug abuse compared to healthy controls. Although the test is cost-effective and non-invasive, the absence of comparison with MRI or CT scans and the small sample size (n = 70) limit the ability to draw definitive conclusions and affect the generalizability of the findings.
3.2. Setting, Dates, Participants, and Sampling
The study was conducted in the surgical ICU of Firoozgar Hospital in December 2019. The BGT was used to assess neuropsychological performance in individuals with drug abuse and healthy controls. Participants were selected consecutively based on study criteria.
3.3. Hypotheses
- Individuals with drug abuse will show a higher Brain Injury Index than healthy individuals.
- Individuals with drug abuse will have more visual-motor errors than healthy individuals.
3.4. Eligibility Criteria
3.4.1. Inclusion Criteria
The study included 70 participants, 52 individuals with drug abuse and 18 healthy individuals to ensure statistical power and account for potential dropouts or missing data.
3.4.1.1. Drug Abuser Group
- Opioid dependence based on DSM-5 criteria.
- Age 18 - 70, with at least elementary education.
- Glasgow Coma Scale (GCS) > 15, no significant cognitive disorders.
3.4.1.2. Healthy Control Group
- Age 18 - 70, no history of drug abuse.
- Matched for age, sex, and health status with the drug abuser group.
3.4.2. Exclusion Criteria
- Use of antipsychotic medications.
- Severe cognitive impairments or neurological conditions.
3.5. Identification of Participants
Participants were randomly selected from Firoozgar Hospital ICU admissions. The drug abuser group was diagnosed with opioid abuse using DSM-5 criteria and the Addiction Severity Index (ASI), while the healthy control group included ICU patients without drug abuse, matched for age, sex, and health.
3.6. Informed Consent and Data Collection
Eligibility was confirmed, informed consent was obtained, and demographic and clinical data were collected.
3.6.1. Index Tests
The BGT was used to assess visual-motor abilities. Participants were instructed to replicate nine geometric shapes as accurately as possible.
3.7. Administration Procedure
3.7.1. Materials Provided
Participants were given A4-sized blank paper, two pencils, and an eraser.
3.7.2. Instructions
Participants copied the shapes on nine cards without a time limit, receiving the next card after completing each shape. No additional instructions were provided unless necessary.
3.7.3. Test Environment
The test was administered in a quiet environment to minimize distractions, and the examiner avoided providing any guidance to ensure accurate results.
3.7.4. Rationale for Reference Standard
The BGT was used as a cost-effective screening tool for brain injuries in individuals with drug abuse, serving as an alternative to more invasive imaging methods like MRI or CT. The HEIN system set the following BGT cut-offs: (1) 0 - 5 points: Normal; (2) 6 - 12 points: Borderline (possible impairment); (3) +13 points: Positive for brain injury (neurological damage)
These test positivity cut-offs help identify individuals who may need further testing or intervention.
3.7.5. Availability of Clinical Information
Clinical information was provided to examiners after the BGT to avoid bias, ensuring the test remained objective and independent of prior knowledge.
3.7.6. Diagnostic Accuracy
The accuracy of the BGT was assessed using sensitivity, specificity, positive predictive value (PPV), and negative predictive value (NPV), measuring the correct identification of impairments and healthy participants.
3.7.7. Handling of Indeterminate Results
Indeterminate results were reviewed with additional clinical assessments. If necessary, participants were referred for further testing or imaging to ensure accurate diagnosis and follow-up.
3.7.8. Handling of Missing Data
Missing data were managed by excluding incomplete cases and using imputation for non-critical variables, with a sensitivity analysis conducted to confirm the validity of the results.
3.7.9. Variability in Diagnostic Accuracy
Variability in diagnostic accuracy was assessed through subgroup analysis, inter-rater reliability, and comparisons between groups. A sensitivity analysis checked the impact of missing data, ensuring test consistency.
3.7.10. Outcomes and Exposures
The study examined opioid abuse as the primary exposure and neuropsychological impairments as the main outcome, assessed via the BGT and HEIN systems. Scores were categorized as normal, borderline, or positive for brain injury. Secondary outcomes analyzed links between BGT scores and demographic/clinical factors.
3.7.11. Addressing Bias
Bias was reduced by selecting participants from one ICU, blinding examiners during the BGT, and adjusting for confounders. Missing data were managed via sensitivity analyses and imputation.
3.8. Participant Selection
Below is the flow diagram illustrating the participant selection process (Figure 1).
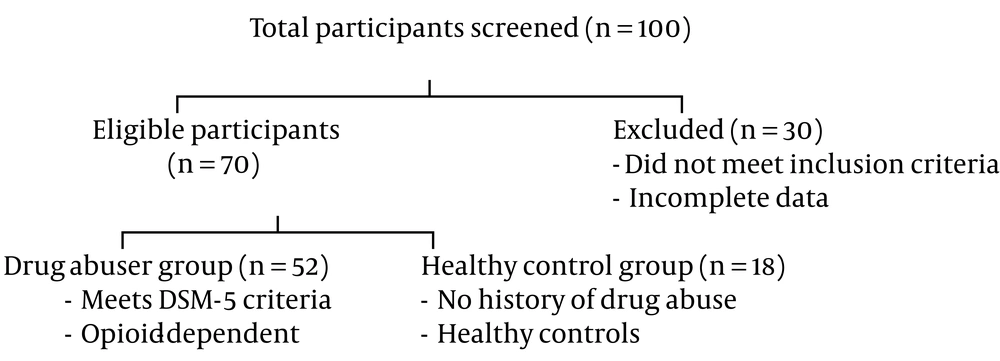
Figure 1.
Flow diagram of participant selection
The flow diagram illustrates participant recruitment, from screening to the inclusion of 52 individuals with drug abuse and 18 controls, detailing exclusions at each step.
3.9. Statistical Methods
Data were analyzed using SPSS, employing Fisher's exact test and chi-square tests for categorical variables. A significance level of P < 0.05 was set.
3.10. Ethical Criteria
The 2019 study at Firoozgar Hospital adhered to ethical guidelines, including informed consent and privacy, under the auspices of Iran University of Medical Sciences. Participants completed demographic forms, consent forms, drug abuse questionnaires, and the BGT.
3.11. Instruments
Data were collected through interviews, observations, and tests. Opioid dependence was diagnosed using DSM-5 criteria, and the ASI evaluated severity across six areas, each providing a general score (22). The Persian version of the ASI was clinically trialed by Atef Vahid at the Institute of Psychiatry and Psychology, in collaboration with the National Center for Addictive Studies. Participants completed the ASI questionnaire monthly (23).
3.11.1. Bender Visual Motor Gestalt Test
The Bender visual motor Gestalt test was developed by Loretta Bender in 1938, and her dissertation was titled "As a Visual Motor Design Test and its Clinical Application" (24). The test consists of nine geometric shapes, each drawn on a card. The first card is marked with a sign, and the rest are numbered from 1 to 8. Figure 2 is one of the shapes in the Bender Gestalt test, which is named as such in the test itself (25).
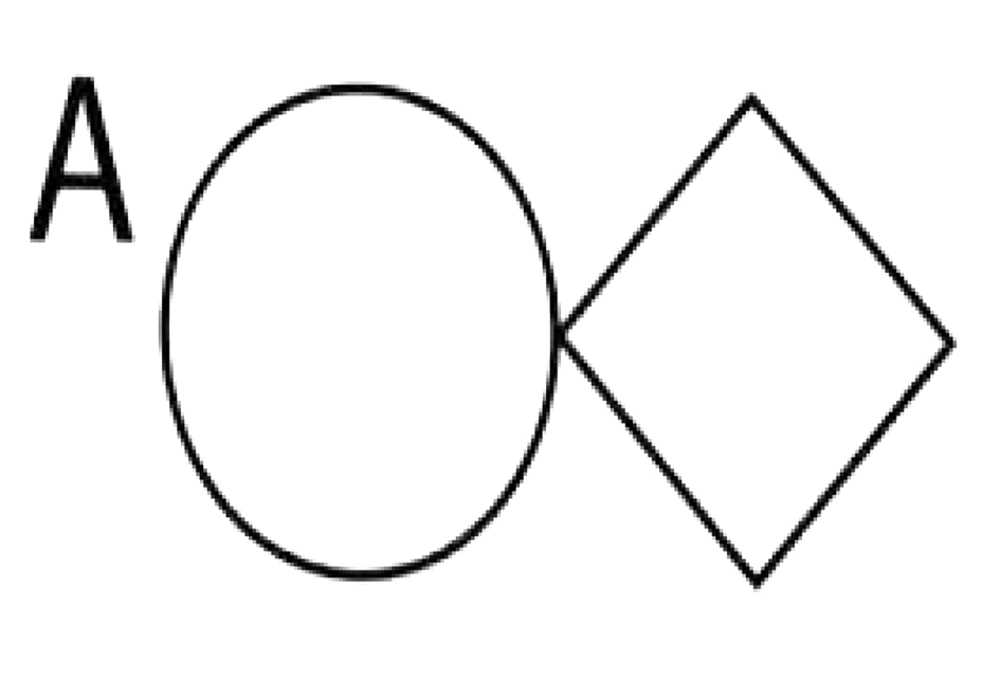
Figure 2.
One form of the Bander Gestalt test
3.11.2. Bender-Gestalt Test Administration
Each participant took the BGT individually, replicating nine geometric figures on cards within a time limit. Scoring focused on visual-motor errors such as rotation, reversal, and omissions. Standard instructions ensured consistent administration. At least eight different systems are used to score this test. The dominant scoring systems were developed by Koppitz (26, 27) and Hutt (28). The validity of the Pascal and Suttel system is 70%. Koppitz's system shows 53% - 90% validity, with a median of 77%. Hutt's Psychological Injury Scale has 87% validity, and Koppitz's developmental system has reliability of 65% - 47% when compared with the Frostig test (29). In Iran, studies show that the Bender Gestalt test with Koppitz's developmental scoring system has good validity and reliability, with correlation values ranging from 60% to 90%. A retrial conducted 4 - 6 weeks after the first test on 100 subjects resulted in a reliability coefficient of 89% (30).
4. Results
Descriptive data on participants were collected to provide insights into their demographic and clinical characteristics.
4.1. Demographic Characteristics
The study included a total of 70 individuals, comprising 52 individuals with drug abuse and 18 healthy individuals, all with a GCS score greater than 15. The demographic information of the research participants is reported in Table 1.
Table 1.The Demographic Information of the Research Participants a
| Demographic Characteristic | Drug Abuser Group (n = 52) | Healthy Control Group (n = 18) |
|---|---|---|
| Age (y) | 44 ± 26 | 43 ± 25 |
| Gender | ||
| Male | 39 (75) | 10 (55.6) |
| Female | 13 (25) | 8 (44.4) |
| Marital status | ||
| Single | 11 (21.15) | 3 (16.7) |
| Married | 41 (78.84) | 15 (83.3) |
| Education level | ||
| Elementary | 20 (38.46) | 5 (27.8) |
| Middle school | 12 (23.07) | 4 (22.2) |
| High school diploma | 11 (21.15) | 5 (27.8) |
| Associate degree | 4 (7.69) | 1 (5.6) |
| Bachelor's degree | 2 (3.84) | 2 (11.1) |
| Master's degree | 3 (5.76) | 1 (5.6) |
| Employment status | ||
| Worker | 6 (11.54) | 2 (11.1) |
| Employee | 7 (13.46) | 1 (5.6) |
| Self-employed | 16 (30.77) | 4 (22.2) |
| Housewife | 13 (25) | 9 (50) |
| Retired | 8 (15.38) | 2 (11.1) |
| Unemployed | 2 (3.84) | 0 (0) |
a Values are expressed as mean ± SD or No. (%).
The study included 52 drug-abusing individuals and 18 healthy controls. The BGT was used to assess neuropsychological impairments, while secondary outcomes examined links between BGT scores and factors such as age, education, drug abuse severity, and mental health using the ASI.
4.2. Clinical Characteristics
All drug-abusing individuals (100%) reported opioid abuse, with 40% having comorbid mental health disorders such as anxiety and depression. The mean duration of drug abuse was 5.4 years (± 2.1 years).
4.3. Main Findings
Individuals with drug abuse had significantly higher BGT scores (12.3 ± 3.5) compared to healthy controls (3.2 ± 1.4) (P < 0.001), indicating greater neuropsychological impairments. Among drug abusers, 34.6% scored in the "positive for brain injury" range (≥ 13 points), while 65.4% were borderline (6 - 12 points). All healthy controls scored in the normal range (0 - 5 points) (P < 0.001).
The BGT demonstrated high accuracy with 85% sensitivity (95% CI: 75% - 95%) and 98% specificity (95% CI: 92% - 100%) in detecting brain injuries in drug-abusing individuals.
4.4. Confidence Intervals
The BGT demonstrated strong diagnostic performance for detecting neuropsychological impairments in individuals with drug abuse. Specifically:
- Sensitivity: 85% (95% CI: 75% - 95%)
- Specificity: 98% (95% CI: 92% - 100%)
The evaluation of addictive outcomes on the BGT is summarized in Table 2.
Table 2.Association Between Opium Consumption and Visual-Motor Functioning, Developmental Disorders, and Neurological Impairments (Bender-Gestalt Test) a
| Opium Use | Bender Test Result | P-Value b | |||
|---|---|---|---|---|---|
| Normal | Marginal | Critical | Total | ||
| Yes | 1 (1.9) | 33 (63.5) | 18 (34.6) | 52 (100) | < 0.001 |
| No | 18 (100) | 0 | 0 | 18 (100) | |
a Values are expressed as No. (%).
b Fisher's Exact test.
Opium users had significantly higher BGT scores than non-users (P < 0.001), indicating an association with neurological disorders.
Table 3 revealed significant associations between opium use and specific BGT items, such as rotation, reversal, distortion, and omission (P < 0.05). Other items showed no significant relationship (P > 0.05).
Table 3.Bender Test Items and Opium Use a
| Bender Test Items | Opium Use | P-Value | |
|---|---|---|---|
| Yes | No | ||
| Perseveration | 0.360 b | ||
| Yes | 16 (30.8) | 3 (16.7) | |
| No | 36 (69.2) | 15 (83.3) | |
| Rotation and reversal | < 0.001 c | ||
| Yes | 42 (80.8) | 1 (5.6) | |
| No | 10 (19.2) | 17 (94.4) | |
| Concretism | 0.318 b | ||
| Yes | 5 (9.6) | 0 | |
| No | 47 (90.4) | 18 (100) | |
| Add angles | 0.103 b | ||
| Yes | 8 (15.4) | 0 | |
| No | 44 (84.6) | 18 (100) | |
| Overlap | 0.096 b | ||
| Yes | 13 (25.0) | 1 (5.6) | |
| No | 39 (75.0) | 17 (94.4) | |
| Distortion | 0.003 b | ||
| Yes | 18 (34.6) | 0 | |
| No | 34 (65.4) | 18 (100) | |
| Embellishments | 0.103 b | ||
| Yes | 8 (15.4) | 0 | |
| No | 44 (84.6) | 18 (100) | |
| Partial rotation | < 0.001 c | ||
| Yes | 46 (88.5) | 2 (11.1) | |
| No | 6 (11.5) | 16 (88.9) | |
| Omission of a subpart | 0.004 b | ||
| Yes | 17 (32.7) | 0 | |
| No | 35 (67.3) | 18 (100) | |
| Abbreviation | 0.027 c | ||
| Yes | 24 (46.2) | 3 (16.7) | |
| No | 28 (53.8) | 15 (83.3) | |
| Separation | 0.028 b | ||
| Yes | 17 (32.7) | 1 (5.6) | |
| No | 35 (67.3) | 17 (94.4) | |
| Absence of erasures | 0.003 c | ||
| Yes | 30 (57.7) | 3 (16.7) | |
| No | 22 (42.3) | 15 (83.3) | |
| Close the lines | 0.006 c | ||
| Yes | 21 (40.4) | 1 (5.6) | |
| No | 31 (59.6) | 17 (94.4) | |
| Design a point of contact a figure | 0.007 b | ||
| Yes | 16 (30.8) | 0 | |
| No | 36 (69.2) | 18 (100) | |
a Values are expressed as No. (%).
b Fisher's exact test.
c Chi-square test.
According to Table 4, discriminant analysis demonstrated significant group differentiation (Wilks' Lambda = 0.618, χ² = 32.433, df = 1, P < 0.001).
Table 4.Wilks' Lambda
| Variables | Test of Function(s) | Wilks' Lambda | Chi-square | df | P-Value |
|---|---|---|---|---|---|
| Values | 1 | 0.618 | 32.433 | 1 | 0.000 |
According to Table 5, classification accuracy was 91.4%, with 98.1% of drug abuse cases correctly classified and 72.2% of healthy controls correctly classified. Cross-validation confirmed the robustness of the results, maintaining an accuracy of 91.4%.
| Addiction | Predicted Group Membership | Total | |
|---|---|---|---|
| Yes | No | ||
| Original | 51 (98.1) | 1 (1.9) | 52 (100.0) |
| 5 (27.8) | 13 (72.2) | 18 (100.0) | |
| Cross-validated d | 51 (98.1) | 1 (1.9) | 52 (100.0) |
| 5 (27.8) | 13 (72.2) | 18 (100.0) | |
a Values are expressed as No. (%).
b 91.4% of originally grouped cases were correctly classified.
c 91.4% of cross-validated grouped cases are correctly classified.
d Cross-validation classifies each case using functions derived from all other cases, excluding the one being classified.
5. Discussion
The BGT is a reliable, cost-effective tool for detecting neuropsychological impairments in drug-abusing individuals, demonstrating high sensitivity (85 - 98.1%) and specificity (72.2 - 98%). It effectively distinguishes drug abusers from healthy controls, with higher error rates in the drug abuse group aligning with known cognitive and visual-motor deficits. However, the lack of comparison with imaging techniques and a small, homogeneous sample limits generalizability. Future studies should validate the BGT against imaging methods and test it in diverse populations. Clinically, it is useful for screening in resource-limited settings but should be combined with other diagnostic tools for comprehensive assessment.
These results align with previous studies indicating that excessive and chronic drug abuse increases the risk of neurological disorders and related behaviors (31-33). Karatayev et al. found that excessive use of drugs, alcohol, nicotine, and cannabis increases the risk of neurological disorders. Their research emphasized that drug abuse during vulnerable periods, such as adolescence and pregnancy, harms brain development, causing long-term neurological and behavioral issues (34). Other studies have shown that prenatal exposure to nicotine can lead to neurological disorders, including attention deficit hyperactivity disorder (ADHD) and traits associated with autism (35, 36). These disorders are linked to the neurodegenerative effects of drug abuse on brain regions, affecting functions such as perception, motor skills, attention, memory, and executive functions.
The study's results are consistent with those of Ghalehban et al., who reported more BGT errors in clinical samples due to visual-perceptual, visual-motor defects, attention disorders, executive function issues (e.g., response inhibition, decision-making), and cognitive impulsivity, which may precede or result from drug abuse (20). Chronic drug abuse increases the risk of neurological disorders, including cognitive impairments, memory issues, and, in severe cases, Alzheimer's and Parkinson's diseases (37, 38). Conversely, a recent study on cannabis showed a significant difference between users and normal controls in attention (39). Cadet and Bisagno also suggested that the specific effects of drugs on neuropsychological functions lead to weaknesses in tests of perceptual-motor speed and verbal recognition memory (40). Ghalehban et al. (20) identified moderate neuropsychological disorders in drug abuse, recommending the BGT for early brain damage screening. The study found significant BGT score differences between drug-abusing individuals and healthy controls, indicating early brain damage. While useful for screening, the BGT should be combined with other diagnostic tools for greater accuracy.
5.1. Generalizability
The study's findings may lack full generalizability due to its focus on opioid-dependent individuals from a single ICU and a small sample size (n = 70). This limits the applicability of the results to broader populations, particularly those with different types of substance abuse or from other regions. Future studies with more diverse samples are needed to validate the effectiveness of the BGT across various drug-use populations.
5.2. Limitations
This study has several limitations. The small sample size (n = 70) and focus on opioid-dependent individuals from one ICU limit the generalizability of the findings to broader populations or other types of substance abuse. The absence of gold-standard comparisons, such as MRI or CT scans, prevents definitive confirmation of structural brain injuries. The cross-sectional design, potential biases from missing data, and confounding factors hinder causal conclusions. While the BGT is a useful screening tool for visual-motor and neuropsychological impairments, it is not a standalone diagnostic method. Future studies should combine the BGT with advanced neuropsychological assessments and imaging techniques to achieve greater diagnostic accuracy and comprehensive evaluation.

