
1. Background
Severe mental illnesses (SMI) — including schizophrenia, schizoaffective disorder, and severe mood disorders — are among the leading causes of disability worldwide, profoundly impairing quality of life, increasing mortality risk, and imposing substantial economic and healthcare burdens (1, 2). In Iran, a nationally representative survey reported a 12-month prevalence of 21.3% for any psychiatric disorder among adults (3). Beyond clinical symptoms, individuals with SMI often face pervasive social exclusion, diminished self-identity, limited employment opportunities, and disrupted interpersonal relationships — factors that collectively hinder recovery and community integration (4-6). A core challenge in the recovery process is the lack of meaningful occupational engagement. Individuals with SMI typically spend less time in social, recreational, and vocational roles and report reduced capacity to derive pleasure from daily activities (7, 8). While qualitative and mixed-methods studies underscore that participation in purposeful activities — not merely the type or structure of occupation — is critical for mental health optimization (9, 10), traditional psychosocial services often fall short in fostering genuine autonomy and social belonging. Day centers, commonly used in Iran and other low- and middle-income countries, provide structured routines and social support but may inadvertently promote dependency by confining participants within institutionalized environments, thereby limiting their integration into broader community life (4, 11). In such settings, social networks often remain restricted to staff and clinicians, with minimal expansion into peer or community-based relationships (11, 12). In contrast, the clubhouse model — a non-clinical, member-driven, community-based approach — was developed specifically to address these limitations. Originating in the United States and now implemented globally, the clubhouse model emphasizes mutual support, shared responsibility, voluntary participation, and the right to meaningful work and social roles (13, 14). Unlike conventional day centers, clubhouses operate on the principle that individuals with SMI are “members,” not “patients,” and are actively involved in running the center’s daily operations. Systematic reviews and multiple controlled studies provide robust evidence for its effectiveness in high-income settings: A review by McKay et al. concluded that clubhouse participation is associated with significant improvements in quality of life, employment outcomes, and social functioning (15). Similarly, Bouvet et al. found that clubhouse members consistently report higher levels of subjective well-being and community integration compared to users of traditional day centers (16). Additional evidence from quasi-experimental and longitudinal studies further supports these findings (17, 18). However, these findings are largely derived from Western contexts, where clubhouse programs operate within well-resourced mental health systems and are often integrated with vocational and housing supports. In contrast, psychosocial services in Iran remain predominantly clinic-based, with day centers offering passive, staff-directed activities that may inadvertently reinforce dependency rather than autonomy (4, 11). Crucially, no randomized controlled trial has evaluated the clubhouse model in the Middle East or Persian-speaking populations, and existing studies in low- and middle-income countries are limited to qualitative case reports or non-controlled designs (15, 16). This gap is critical because the transferability of psychosocial interventions across cultural and systemic contexts cannot be assumed. The clubhouse model’s core principles — peer collaboration, shared responsibility, and voluntary membership — may interact differently with local values, family dynamics, and service structures in Iran. Therefore, rigorous, context-specific evidence is needed to determine whether the clubhouse model can be effectively adapted and implemented in Iranian mental health settings. To address this gap, the present study is the first pilot randomized controlled trial in Iran to examine the impact of a locally adapted clubhouse intervention on occupational engagement — a key mechanism of recovery — using validated, client-centered outcome measures (Canadian Occupational Performance Measure and the Profile of Occupational Engagement in people with Severe Mental Illness).
2. Objectives
This study aims to answer the following research question: Does participation in a clubhouse model-based program significantly improve occupational engagement — measured by performance and satisfaction in daily activities — compared to standard day center services among individuals with severe mental illness in Iran? We hypothesize that participants in the clubhouse intervention will demonstrate significantly greater improvements in occupational engagement than those receiving conventional day center care.
3. Methods
3.1. Study Design and Setting
This assessor-blinded pilot randomized controlled trial was conducted between 2023 and 2024 in Tehran, Iran, at two sites: (A) the Department of Occupational Therapy, Faculty of Rehabilitation Sciences, Iran University of Medical Sciences, and (B) the Department of Rehabilitation Day Center, Iranian Psychiatric Educational and Treatment Center. The study was approved by the Ethics Committee of Iran University of Medical Sciences (IR.IUMS.REC.1401.844) and registered in the Iranian Registry of Clinical Trials (IRCT20230820059199N1). The trial was conducted in accordance with the CONSORT 2010 guidelines; a completed CONSORT checklist is provided in the Supplementary File.
3.2. Participants
Of 32 participants initially randomized, 31 completed the study (intervention group: n = 15; control group: n = 16). One participant in the intervention group withdrew after randomization due to acute psychiatric hospitalization and was excluded from all analyses. Inclusion criteria were: (A) age ≥ 18 years; (B) a DSM-5 diagnosis of severe mental illness — specifically schizophrenia, schizoaffective disorder, or bipolar I disorder — confirmed by a licensed psychiatrist; (C) Global Assessment of Functioning (GAF) score between 40 and 70, indicating moderate psychosocial impairment; (D) voluntary participation with written informed consent. Exclusion criteria included: (A) diagnosis of dementia or neurocognitive disorders; (B) active substance use disorder; (C) acute psychiatric crisis requiring hospitalization; (D) cognitive impairment that would interfere with participation or assessment.
3.3. Randomization and Blinding
Participants were randomized using computer-generated block randomization (block size = 4) via SPSS software (v.19). The randomization sequence was printed and placed in sequentially numbered, opaque, sealed envelopes, which were stored in a locked cabinet by an independent research assistant not involved in recruitment or assessment. After baseline assessments and informed consent, the clinical coordinator opened the next envelope to assign the participant to the designated group, ensuring allocation concealment. Due to the nature of psychosocial interventions, participant and staff blinding was not feasible. However, this was an assessor-blinded randomized controlled trial: Two licensed occupational therapists — each with more than five years of clinical experience in psychiatric rehabilitation — conducted all outcome assessments using anonymized participant codes and remained unaware of group allocation throughout the study.
3.4. Intervention Duration Justification
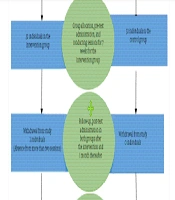
The 8-week intervention period (two 3-hour sessions per week) was selected based on (1) feasibility within the academic calendar of the host institution, (2) ethical considerations to minimize burden on a vulnerable population, and (3) evidence from local pilot studies indicating that measurable changes in occupational engagement can emerge within 6 - 8 weeks in Iranian psychiatric rehabilitation settings (Figure 1).
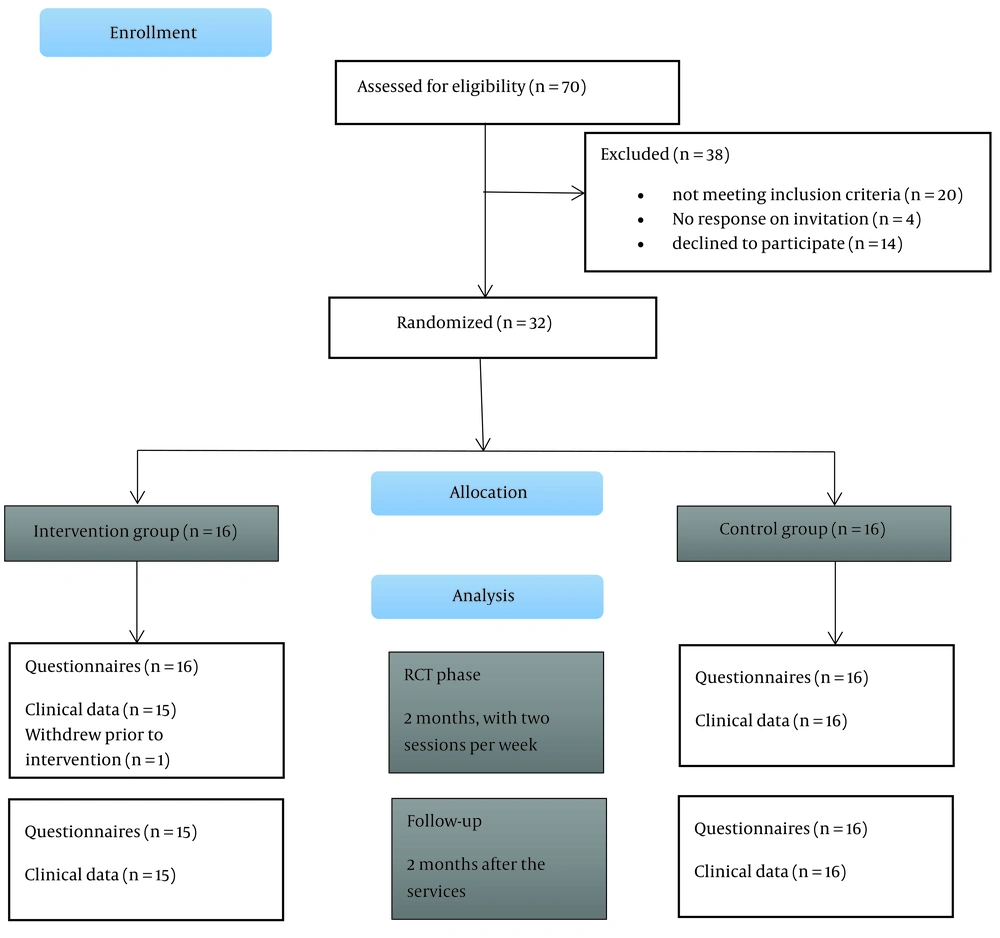
Figure 1.
CONSORT flow diagram
3.5. Intervention
3.5.1. Intervention Group (Clubhouse Model)
Participants received services based on the international clubhouse model over 8 weeks. Activities were organized into collaborative work units (e.g., meal preparation, administrative tasks, art workshops, computer training). Members were treated as active contributors — not patients — and participated in daily operations alongside staff. The program emphasized voluntary participation, peer support, shared responsibility, and individualized goal setting. The research team maintained communication with families for counseling when needed.
3.5.2. Control Group (Standard Day Center Services)
Participants attended a government-funded psychiatric day center twice weekly for 8 weeks (3-hour sessions, totaling 48 hours of intervention). The program included four main components: Psychoeducation: Weekly sessions on symptom management and medication adherence, led by a psychiatrist. Recreational Activities: Structured group activities such as board games, music therapy, and light physical exercise. Basic Occupational Tasks: Simple, pre-planned crafts including painting, beadwork, and gardening. Social Skills Training: Role-playing exercises on communication and conflict resolution, delivered by nurses. Each session was staffed by an occupational therapist.
3.6. Outcome Measures
All assessments were conducted by the two blinded occupational therapists at baseline, post-intervention (week 8), and 2-month follow-up.
3.6.1. Canadian Occupational Performance Measure
3.6.2. Profile of Occupational
Engagement in people with Severe Mental Illness (POES): Assesses engagement across nine behavioral dimensions (e.g., initiating performance, social interplay). Total scores range from 9 - 36. The Persian version was validated by Masoumi et al.; in our sample, internal consistency was α = 0.82 (21).
3.6.3. Global Assessment of Functioning
3.7. Sample Size and Statistical Analysis
The sample size was calculated based on Canadian Occupational Performance Measure (COPM) data from prior studies. We assumed a standard deviation (SD) of 6.0 and a clinically meaningful difference of 3.0 points, exceeding the MCID of 2.0 defined by Colquhoun et al. (19). Using a two-group independent t-test with α = 0.05 and power = 80%, the required sample size was 16 participants per group. Anticipating a 10% attrition rate, we aimed to enroll 32 participants in total. Normality of continuous variables was assessed using the Shapiro–Wilk test (recommended for n < 50). All variables met normality assumptions (P > 0.05). For between-group comparisons, independent-samples t-tests were used. For within-group changes, paired-samples t-tests were applied. For categorical variables with expected cell frequencies < 5 (e.g., marital status, bachelor’s degree), Fisher’s exact test was used instead of chi-square. For POES dimensions (ordinal data), changes across three time points were analyzed using the Friedman test, followed by post-hoc Wilcoxon signed-rank tests with Bonferroni correction (adjusted P < 0.017). Between-group comparisons at each time point used Mann-Whitney U tests. Effect sizes (Cohen’s d) were reported for primary outcomes.
4. Results
A total of 31 participants completed the study (intervention group: n = 15; control group: n = 16). As shown in Table 2, the two groups were well-matched at baseline. The mean age was 37.2 ± 12.7 years in the intervention group and 38.6 ± 8.5 years in the control group (P = 0.715). The mean duration of illness was 24.9 ± 8.4 years in the intervention group and 16.0 ± 11.9 years in the control group (P = 0.146). There were no statistically significant differences between groups in demographic or clinical characteristics, indicating successful randomization. Tables 1 and 2 show the mean, standard deviation, and frequency of qualitative variables in the groups. Additionally, this table demonstrates that there is no significant difference between the two groups when examining the homogeneity of demographic variables.
Table 1.
Baseline Demographic and Clinical Characteristics of Participants (N = 31) a
| Variables | Intervention Group (N= 15) | Control Group (N = 16) | P-Value |
|---|---|---|---|
| Gender | 0.193 | ||
| Female | 6 (40.0%) | 3 (18.8%) | |
| Male | 9 (60.0%) | 13 (81.3%) | |
| Diagnosis | 0.140 | ||
| Schizophrenia | 4 (26.7%) | 10 (62.5%) | |
| Bipolar I disorder | 7 (46.7%) | 3 (18.8%) | |
| Schizoaffective disorder | 4 (26.7%) | 3 (18.8%) | |
| Marital status | — | ||
| Single | 15 (100%) | 16 (100%) | |
| Married | 0 (0%) | 0 (0%) | |
| Educational status | 0.652 | ||
| Primary school | 3 (20.0%) | 2 (12.5%) | |
| High school | 4 (26.7%) | 4 (25.0%) | |
| Diploma | 5 (33.3%) | 6 (37.5%) | |
| Associate degree | 3 (20.0%) | 2 (12.5%) | |
| Bachelor’s degree | 0 (0%) | 2 (12.5%) |
aValues are expressed as No. (%).
Table 2.
Baseline Quantitative Demographic and Clinical Characteristics of Participants (N = 31) a
| Variables | Intervention (N = 15) | Control (N = 16) | P-Value |
|---|---|---|---|
| Age (y) | 37.20 ± 12.69 | 38.63 ± 8.53 | 0.715 |
| Duration of illness (y) | 24.87 ± 8.41 | 16.00 ± 11.86 | 0.146 |
aValues are expressed as mean ± SD.
As shown in Table 3, the intervention group demonstrated significantly higher scores than the control group in both COPM performance and satisfaction at post-test and follow-up (P < 0.01). At pre-test, the groups were comparable in performance (P = 0.269) but differed in satisfaction (P = 0.001), which was addressed in sensitivity analyses.
Table 3.
Between-Group Comparisons of Canadian Occupational Performance Measure Scores at Three Time Points (Independent Samples t-test) a
| Variables | Intervention Group | Control Group | Mean Difference | t | df | P-Value |
|---|---|---|---|---|---|---|
| Performance | ||||||
| Pre-test | 4.20 ± 1.10 | 3.62 ± 1.00 | 0.58 | 1.13 | 29 | 0.269 |
| Post-test | 5.79 ± 0.90 | 3.94 ± 1.20 | 1.85 | 3.63 | 29 | 0.001 |
| Follow-up | 5.73 ± 0.90 | 3.94 ± 1.20 | 1.79 | 3.35 | 29 | 0.002 |
| Satisfaction | ||||||
| Pre-test | 4.00 ± 1.30 | 2.15 ± 1.40 | 1.85 | 3.88 | 29 | 0.001 |
| Post-test | 4.92 ± 1.00 | 2.61 ± 1.50 | 2.31 | 4.15 | 29 | < 0.001 |
| Follow-up | 5.08 ± 1.00 | 2.53 ± 1.50 | 2.55 | 4.90 | 29 | < 0.001 |
aValues are expressed as mean ± SD.
The results of the t-test indicate that there is no significant difference between the two groups in the pre-test (P > 0.05). However, in the post-test and follow-up, there is a significant difference between the two groups in the variables of performance and occupational satisfaction after the intervention (P < 0.05). These results suggest that the intervention led to a significant improvement in performance and satisfaction in the intervention group compared to the control group.
As shown in Table 4, the intervention group demonstrated statistically significant improvements in both performance (+1.59, P < 0.001) and satisfaction (+0.92, P < 0.001). In contrast, the control group showed non-significant declines in both outcomes (P > 0.05). In the intervention group: In terms of performance, the difference in the mean scores between the pre-test and post-test is -1.5933, which is statistically significant (P < 0.001). In terms of satisfaction, the difference in the mean scores between the pre-test and post-test is -0.9200, which is also statistically significant (P < 0.001). These results indicate that in the intervention group, the scores for performance and satisfaction improved significantly in the post-test, whereas in the control group, this improvement was not significant.
Table 4.
Within-Group Changes in Canadian Occupational Performance Measure Scores from Pre- to Post-Intervention (Paired Samples t-test) a
| Groups | Pre-Test | Post-Test | Mean Change | t | df | P-Value |
|---|---|---|---|---|---|---|
| Intervention | ||||||
| Performance | 4.20 ± 1.10 | 5.79 ± 0.90 | +1.59 | -11.07 | 14 | < 0.001 |
| Satisfaction | 4.00 ± 1.30 | 4.92 ± 1.00 | +0.92 | -5.46 | 14 | < 0.001 |
| Control | ||||||
| Performance | 4.50 ± 1.00 | 4.17 ± 1.20 | -0.33 | -1.94 | 15 | 0.072 |
| Satisfaction | 4.30 ± 1.40 | 3.84 ± 1.50 | -0.46 | -1.45 | 15 | 0.168 |
aValues are expressed as mean ± SD.
As shown in Table 5, the only POES dimension that differed significantly between groups at follow-up was Initiating performance (U = 72.5, Z = -2.002, P = 0.045), with the intervention group scoring higher. No other dimensions reached statistical significance at any time point. Within the intervention group, initiating performance scores showed a progressive increase from pre-test (2.4 ± 0.7) to post-test (2.8 ± 0.6) and follow-up (3.1 ± 0.6), while the control group remained stable across all time points (2.6 → 2.5 → 2.5).
Table 5.
Between-Group Comparisons of Profile of Occupational Engagement in People with Severe Mental Illness Dimensions at Follow-up (Mann-Whitney U Test)
| POES Dimension | Mann-Whitney U | Z | P-Value (2-tailed) |
|---|---|---|---|
| Initiating performance | 72.5 | -2.002 | 0.045 |
| Daily rhythm | 108.5 | -0.478 | 0.632 |
| Place | 111.0 | -0.388 | 0.698 |
| Variety and range of occupations | 115.0 | -0.216 | 0.829 |
| Social environment | 115.0 | -0.218 | 0.828 |
| Social interplay | 120.0 | 0.000 | 1.000 |
| Interpretation | 118.5 | -0.062 | 0.950 |
| Extent of meaningful occupations | 112.0 | -0.336 | 0.737 |
| Routines | 119.0 | -0.041 | 0.967 |
Abbreviation: POES, Profile of Occupational Engagement in people with Severe Mental Illness.
Table 6 presents the results of the Friedman test for examining changes in the scores of the dimensions of the POES Questionnaire over time (pre-test, post-test, and follow-up) in both the control and intervention groups. The Friedman test is a non-parametric test used to compare score changes within a group across three or more time points. The results in Table 6 indicate that the control group showed significant changes in scores over time in most dimensions (except for "performance onset") (P < 0.05). These results suggest that in the control group, significant changes also occurred over time in some dimensions. As shown in Table 6, the Friedman test revealed significant within-group changes over time in most POES dimensions for both groups (P < 0.05). However, post-hoc analyses with Bonferroni correction showed that only the intervention group maintained significant improvements at follow-up in key dimensions such as Initiating performance, social environment, and Extent of meaningful occupations. In contrast, the control group showed transient improvements at post-test that were not sustained at follow-up, suggesting short-term reactivity rather than lasting change.
Table 6.
Within-Group Changes in Profile of Occupational Engagement in People with Severe Mental Illness Dimensions Over Time (Friedman Test)
| POES Dimension | χ² | df | P-Value | Post-Hoc Wilcoxon (Bonferroni-Adjusted) |
|---|---|---|---|---|
| Initiating performance | ||||
| Intervention | 18.200 | 2 | < 0.001 | Pre → Follow-up: P = 0.002 |
| Control | 4.000 | 2 | 0.135 | - |
| Daily rhythm | ||||
| Intervention | 21.412 | 2 | < 0.001 | Pre → Post: P = 0.001; Pre → Follow-up: P = 0.003 |
| Control | 10.571 | 2 | 0.005 | Pre → Post: P = 0.012 |
| Place | ||||
| Intervention | 18.000 | 2 | < 0.001 | Pre → Follow-up: P = 0.004 |
| Control | 17.688 | 2 | < 0.001 | Pre → Post: P = 0.002 |
| Variety of occupations | ||||
| Intervention | 20.182 | 2 | < 0.001 | Pre → Post: P = 0.001 |
| Control | 20.667 | 2 | < 0.001 | Pre → Post: P= 0.001 |
| Social environment | ||||
| Intervention | 26.000 | 2 | < 0.001 | Pre → Follow-up: P < 0.001 |
| Control | 15.929 | 2 | < 0.001 | Pre → Post: P = 0.003 |
| Social interplay | ||||
| Intervention | 22.167 | 2 | < 0.001 | Pre → Follow-up: P = 0.001 |
| Control | 9.000 | 2 | 0.011 | Pre → Post: P = 0.021 |
| Interpretation | ||||
| Intervention | 8.000 | 2 | 0.018 | Pre → Post: P = 0.032 |
| Control | 10.000 | 2 | 0.007 | Pre → Post: P = 0.018 |
| Extent of meaningful occupations | ||||
| Intervention | 22.000 | 2 | < 0.001 | Pre → Follow-up: P = 0.001 |
| Control | 24.154 | 2 | < 0.001 | Pre → Post: P < 0.001 |
| Routines | ||||
| Intervention | 6.750 | 2 | 0.034 | Pre → Post: P = 0.041 |
| Control | 6.615 | 2 | 0.037 | Pre → Post: P = 0.045 |
Abbreviation: POES, Profile of Occupational Engagement in people with Severe Mental Illness.
5. Discussion
This randomized controlled trial demonstrated that participation in a clubhouse model–based program significantly improved both occupational performance and satisfaction among individuals with severe mental illness, compared to standard day center services. These findings align with prior evidence indicating that theory-based occupational therapy interventions enhance engagement, empowerment, and daily functioning in this population (17, 18). Notably, the clubhouse group showed statistically and clinically meaningful gains (≥ 2-point increase on COPM), whereas the control group exhibited no significant change — highlighting the added value of the clubhouse approach beyond conventional psychosocial care. While statistical significance is important, the true value of our findings lies in their real-world meaning. A 2.55-point increase in COPM satisfaction reflects more than a number — it signifies that participants went from feeling helpless or ashamed about their inability to perform basic tasks to experiencing pride, competence, and social connection through meaningful contribution. For example, several participants in the clubhouse group reported for the first time preparing meals for peers, leading administrative meetings, or initiating conversations with staff as equals — acts that restored dignity and identity beyond symptom reduction. This aligns with the recovery principle that “doing” shapes “being”: When individuals engage in valued occupations, they reconstruct a sense of self as capable, useful, and belonging. Thus, the observed changes, though modest in duration, represent qualitative shifts in lived experience that may seed longer-term recovery.
5.1. The Clubhouse Model as a Recovery-Oriented Intervention
Our results support the growing body of literature positioning the clubhouse model as an evidence-based, recovery-focused framework (16). By emphasizing member-driven participation, shared responsibility, and meaningful work roles, clubhouses foster autonomy and social inclusion—core dimensions of mental health recovery (7, 24). As Mutschler et al. noted, such environments provide structured yet flexible opportunities for community engagement, which occupational therapists can further enhance through tailored activity planning and goal setting (25). Consistent with Bouvet’s et al. systematic review, our participants reported higher subjective quality of life, reinforcing the model’s holistic benefits beyond symptom reduction (16).
5.2. Comparative Effectiveness
Clubhouse vs. Day Centers While both interventions positively influenced within-group occupational engagement (e.g., daily rhythm, activity diversity, social participation), only the clubhouse group showed significant between-group superiority in performance and satisfaction. This distinction is critical: Day centers may offer safe, supportive routines, but they often lack mechanisms to promote self-determination and peer-led collaboration — elements that appear pivotal for sustained recovery (7, 18). Hultqvist et al. similarly found that clubhouse participants reported stronger perceptions of autonomy and social belonging, suggesting that service design — not just activity provision — shapes outcomes (4). Interestingly, our analysis of POES dimensions revealed that only “Initiating performance” differed significantly between groups post-intervention. This may reflect the clubhouse’s emphasis on proactive role-taking (e.g., choosing work units, initiating tasks), whereas day center activities are often pre-scheduled and staff-directed. Over time, both models supported engagement stability, indicating that any structured psychosocial program can prevent deterioration — but only the clubhouse model appears to catalyze active recovery.
5.3. Mechanisms of Change
Why the Clubhouse Model Works Rather than merely documenting improvement, it is essential to explore how the clubhouse model fosters occupational engagement. Our findings align with recovery-oriented frameworks that position autonomy, hope, and social connectedness as central to mental health recovery (26). In the clubhouse, participants are not passive recipients but active co-producers of the service environment. This shift — from “patient” to “member” — reconfigures identity and restores a sense of agency, which may explain the significant gains in COPM performance and satisfaction. Moreover, the work-ordered day structure provides a naturalistic context for practicing real-world tasks (e.g., meal preparation, administrative duties) that carry intrinsic meaning and social value. Unlike simulated or recreational activities in traditional day centers, these tasks mirror authentic occupational roles, thereby enhancing self-efficacy and bridging the gap between the service setting and community life. This mechanism is consistent with occupational justice theory, which emphasizes the right to participate in meaningful occupations as a determinant of well-being (27). The isolated significance of Initiating performance in POES further supports this interpretation: The clubhouse’s emphasis on self-directed task selection (e.g., choosing work units, volunteering for roles) likely cultivates proactive behavior — a skill often eroded by chronic illness and institutional care. Other POES dimensions (e.g., daily rhythm, social environment) may be more dependent on external structural factors (e.g., housing stability, family dynamics) that were not directly targeted by the 8-week intervention, explaining their lack of change. The divergence between COPM (significant change) and POES (limited change) underscores a critical methodological insight: Client-centered, goal-directed measures like COPM may be more sensitive to subjective, recovery-relevant shifts than observational tools like POES. Participants may perceive meaningful improvement in activities they personally value — even if their overall behavioral patterns (as coded by POES) appear unchanged. This highlights the importance of triangulating outcomes in psychosocial research.
5.4. Implications for Practice and Service Development
These findings suggest that integrating clubhouse principles — such as voluntary participation, peer support, and member ownership — into existing day centers could enhance their effectiveness. As Eklund et al. demonstrated, even “enriched” day center services incorporating meaningful activity frameworks yield better recovery outcomes (17). Mental health systems in Iran and similar settings should consider hybrid models that preserve the safety of day centers while embedding clubhouse-inspired elements of choice, responsibility, and community connection.
5.5. Conclusion
This study demonstrates that clubhouse-based services significantly enhance self-perceived occupational performance and satisfaction among individuals with severe mental illness in Iran, with large effect sizes and clinical relevance. However, the limited impact on most behavioral dimensions of occupational engagement (as measured by POES) suggests that certain outcomes may require longer intervention periods, larger samples, or more intensive environmental support to manifest measurable change. While the current findings support the integration of clubhouse principles into Iranian mental health services, future multi-center trials with extended follow-up are needed to confirm these results and explore nuanced effects across diverse populations.
5.6. Limitations and Strengths
This pilot randomized controlled trial is the first to evaluate the clubhouse model in Iran using validated occupational therapy outcome measures (COPM and POES). However, several limitations must be acknowledged. First, the small sample size (N = 31) limits statistical power and increases the risk of Type II error, particularly for detecting subtle changes in complex behavioral domains such as community integration or employment. Second, the 8-week intervention period and 2-month follow-up may be insufficient to capture long-term recovery trajectories or delayed effects. Recovery from severe mental illness is a non-linear, enduring process, and meaningful change in occupational roles often emerges gradually over months or years — not weeks. Third, the study was conducted in a single urban psychiatric center in Tehran, which limits the generalizability of findings to rural populations, different cultural contexts, or other regions of Iran. Importantly, while the observed improvements in COPM met the threshold for clinical significance (MCID ≥ 2.0), we cannot assume these gains translate into sustained real-world outcomes — such as stable housing, independent living, or paid employment — without extended follow-up. Future studies should employ larger, multi-center samples and longer follow-up periods (e.g., 6 - 12 months) to evaluate the durability and functional impact of clubhouse participation. Despite these limitations, this study provides the first rigorous evidence that the clubhouse model can be adapted to the Iranian mental health context and yields meaningful improvements in occupational engagement among individuals with severe mental illness.