
1. Background
University students are at a higher risk for mental health issues like depression due to academic pressure, life changes, financial stress, and social challenges (1). Globally, depression is a leading cause of disability among young adults, with rising rates in higher education (2). If left unrecognized or untreated, it can harm academic success, relationships, career progress, and long-term mental health (3).
The etiology of depression is multifactorial, involving biological vulnerability, psychological stress, social environment, and cultural influences (4). Among university students, risk factors may include burnout related to studies, uncertainty about future employment, social isolation, and limited coping resources (1). Failure to address these issues early may result in chronic mental health problems, reduced professional competence, and impaired quality of life (5).
Mental health literacy (MHL) refers to an individual's knowledge and beliefs about mental disorders that promote their recognition, management, and prevention. MHL encompasses symptom recognition, awareness of risk factors and treatments, and positive attitudes toward help-seeking (3). Among university students, especially those in health sciences, high MHL is crucial for navigating academic pressures and emotional challenges (6).
Improving MHL is essential for both preventing and addressing mental health problems. University students need accurate knowledge to maintain their mental well-being and support others (7). A well-developed understanding of mental health contributes to the early recognition of emotional difficulties and helps reduce stigma toward individuals experiencing mental illness (8). Positive attitudes toward mental illness foster more inclusive and supportive environments, thereby aiding recovery and reintegration (9). MHL also encompasses the ability to recognize one’s own emotional struggles and seek appropriate support from formal sources (e.g., mental health professionals) or informal networks (e.g., friends and family) (10).
In Thailand, the Department of Mental Health (11) has emphasized promoting MHL at both national and educational levels due to persistent gaps in public understanding. University students are expected to be equipped with strong MHL as part of their academic and professional development (1).
Depression is among the most prevalent and disabling mental health disorders globally, characterized by persistent sadness, diminished interest in activities, and impaired daily functioning (2). In children and adolescents, symptoms often vary by age: younger children may present with irritability, somatic complaints, or excessive attachment, while adolescents more commonly exhibit withdrawal, sleep disturbances, pessimism, and risk-taking behaviors such as substance use or self-harm (12). The etiology of depression is multifactorial, involving biological, psychological, hormonal, and genetic factors that interact across developmental stages (4).
Although cross-sectional studies examining MHL and depression among university students are well represented in the literature, limited research has simultaneously examined mental health knowledge, literacy, and depression risk within the Thai higher education context. Globally, low MHL has been associated with an increased risk of depression. For example, a population-based study in China reported that adults with low MHL were 2.74 times more likely to experience depressive symptoms than those with high MHL (13). Similarly, research in Southeast Asia demonstrated that MHL influenced helping behaviors toward individuals with depression among Thai and Vietnamese health science students, with self-efficacy, attitudes, and social support serving as mediators (14). Despite this growing body of evidence, few studies have focused specifically on health science students in Thailand, who represent both a potentially vulnerable group and future healthcare providers. Given the complex and multifactorial etiology of depression, it is unlikely that any single factor fully explains student mental health outcomes. While this study focuses specifically on mental health knowledge and literacy as potentially modifiable components, other psychosocial, cultural, and contextual determinants also warrant investigation. By situating mental health knowledge and literacy within Thailand’s cultural and educational environment, this study provides context-specific evidence regarding the practical role and limitations of MHL in relation to depressive symptoms among undergraduate students.
2. Objectives
This study aims to assess mental health knowledge, evaluate MHL levels, and investigate the relationships between mental health knowledge, MHL, and depression risk among undergraduate health sciences students in Thailand.
3. Methods
3.1. Study Design and Setting
This study employed a cross-sectional survey design to assess mental health knowledge, MHL, and depression risk among undergraduate health sciences students. The research was conducted at the College of Allied Health Sciences, Suan Sunandha Rajabhat University, Thailand, during the 2024 academic year.
3.2. Participants and Sampling
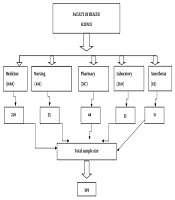
The study targeted 891 undergraduate students enrolled in Years 1 to 4 across seven academic programs at the College of Allied Health Sciences, Suan Sunandha Rajabhat University. A stratified sampling method was applied to ensure proportional representation, and using Krejcie and Morgan’s formula (15), a sample size of 270 students was determined with a 95% confidence level. Participants were drawn from the following programs: Public Health (Community Health) (n = 99), Public Health and Health Promotion (n = 73), Medical and Public Health Secretary (n = 27), Applied Thai Traditional Medicine (n = 40), Cannabis-Based Medicine (n = 19), Health and Beauty Science (n = 5), and Chinese Traditional Medicine (n = 7). All participants were full-time students aged 18 years or older, and informed consent was obtained before participation.
3.3. Instruments
Demographic information, including gender, age, academic program, year of study, monthly family income, parental marital status, birth order, student income, and income source.
Mental Health Knowledge using a 15-item scale developed by the Thai Department of Mental Health (16). This tool evaluates participants' understanding of the definition, causes, symptoms, prevention, treatment, and promotion of mental health. Responses were scored as 1 for correct and 0 for incorrect answers, with interpretation as follows: scores of 11–15 indicated high knowledge, 6–10 indicated moderate knowledge, and 0–5 indicated low knowledge.
Mental Health Literacy using the Mental Health Literacy Questionnaire for Young Adults (MHLq-YA), originally developed by Dias, Campos, Almeida and Palha (17) and the Thai version of the MHLq-YA has previously demonstrated acceptable psychometric properties in Thai student populations (18). This 29-item Likert-scale instrument (ranging from 1 = strongly disagree to 5 = strongly agree) is suitable for individuals aged 18 and older. Scores were interpreted based on standard thresholds: 4.50–5.00 = very high literacy, 3.50–4.49 = high, 2.50–3.49 = moderate, 1.50–2.49 = low, and 1.00–1.49 = very low. Cronbach’s alpha coefficient was .86 for this study.
Depression Risk using the Thai version of the PHQ-9, and it has been validated in Thai clinical and community samples (19). The 9 items reflect key depressive symptoms; each is rated on a scale from 0 (not at all) to 3 (nearly every day). Total scores were categorized as follows: 0–6 = no depression, 7–12 = mild, 13–18 = moderate, and ≥19 = severe depression. Cronbach’s alpha coefficient was .92 for this study.
3.4. Data Collection
Data were collected electronically via Google Forms between May 2024 and May 2025. Participants were briefed on the study objectives and procedures. Completion time was approximately 25–30 minutes. A research assistant monitored response quality in real time and provided technical support to ensure completeness and consistency.
3.5. Statistical Analysis
Data were analyzed using SPSS software. Descriptive statistics (frequency, percentage, mean, and standard deviation) summarized participant characteristics and scores. Pearson’s product-moment correlation was used to examine the relationships among mental health knowledge, MHL, and depression risk. Statistical significance was set at P < 0.0.05.
4. Results
4.1. Participant Characteristics
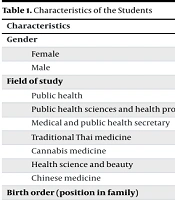
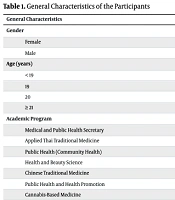
A total of 270 undergraduate students participated in the study. The majority were female (67.8%) and aged 20 years or older (68.9%). Most were enrolled in the Public Health (Community Health) (33.0%) and Public Health and Health Promotion (29.3%) programs. Over 60% were in their second or third year of study. Nearly half (42.6%) identified as first-born children, and 27.4% reported a monthly family income between 15,001–20,000 THB. Most students (64.4%) depended primarily on parental financial support (Table 1).
Table 1.
General Characteristics of the Participants
| General Characteristics | No (%) |
|---|---|
| Gender | |
| Female | 183 (67.80) |
| Male | 87 (32.20) |
| Age (y) | |
| < 19 | 11 (4.10) |
| 19 | 73 (27.00) |
| 20 | 88 (32.60) |
| ≥ 21 | 98 (36.30) |
| Academic program | |
| Medical and public health secretary | 36 (13.30) |
| Applied Thai traditional medicine | 31 (11.50) |
| Public health (community health) | 89 (33.00) |
| Health and beauty science | 11 (4.10) |
| Chinese traditional medicine | 7 (2.60) |
| Public health and health promotion | 79 (29.30) |
| Cannabis-based medicine | 17 (6.30) |
| Year of study | |
| Year 1 | 57 (21.10) |
| Year 2 | 89 (33.00) |
| Year 3 | 80 (29.60) |
| Year 4 | 44 (16.30) |
| Family monthly income (THB) | |
| < 15,000 | 45 (16.70) |
| 15,001 – 20,000 | 74 (27.40) |
| 20,001 – 25,000 | 55 (20.40) |
| 25,001 – 30,000 | 44 (16.30) |
| > 30,000 | 52 (19.30) |
| Parental marital status | |
| Married and living together | 197 (73.00) |
| Divorced/separated | 57 (21.10) |
| Widowed | 8 (3.00) |
| Other (e.g., single parent, deceased mother) | 8 (3.00) |
| Birth order | |
| First-born | 115 (42.60) |
| Middle child | 76 (28.10) |
| Youngest | 76 (28.10) |
| Other (e.g., only child, third-born) | 3 (1.10) |
| Student’s monthly income | |
| < 5,000 | 64 (23.70) |
| 5,001 – 10,000 | 130 (48.10) |
| 10,001 – 15,000 | 44 (16.30) |
| 15,001 – 20,000 | 18 (6.70) |
| > 20,000 | 14 (5.20) |
| Source of student’s income | |
| Part-time job | 44 (16.30) |
| Parents | 174 (64.40) |
| Other (e.g., salary, freelance work) | 8 (3.00) |
| Both part-time job and parents | 44 (16.30) |
4.2. Mental Health Knowledge and Literacy
As shown in Table 2, 90.0% of students demonstrated a high level of mental health knowledge, while 7.8% had moderate and 2.2% had low levels. In terms of MHL, 34.1% reported very high MHL, and 55.2% reported high MHL. Only 10.4% had moderate MHL, and just 0.4% fell in the low range. These findings indicate strong overall mental health understanding and literacy among participants.
Table 2.
Mental Health Knowledge and Literacy Levels Among Students
| Score Range/Mean Score | No (%) | Interpretation |
|---|---|---|
| Mental health knowledge | ||
| 11 – 15 points | 243 (90.00) | High knowledge |
| 6 – 10 points | 21 (7.80) | Moderate knowledge |
| 0 – 5 points | 6 (2.20) | Low knowledge |
| Mental health literacy | ||
| Mean score 4.50 – 5.00 | 92 (34.10) | Very high mental health literacy |
| Mean score 3.50 – 4.49 | 149 (55.20) | High mental health literacy |
| Mean score 2.50 – 3.49 | 28 (10.40) | Moderate mental health literacy |
| Mean score 1.50 – 2.49 | 1 (0.40) | Low mental health literacy |
| Mean score 1.00 – 1.49 | 0 (0.00) | Very low mental health literacy |
4.3. Depression Risk
The PHQ-9 results showed that most students had minimal depressive symptoms. The most frequently reported symptoms included fatigue or low energy (M = 1.28, SD = 0.97), trouble sleeping or oversleeping (M = 1.24, SD = 0.89), and reduced interest in activities (M = 1.35, SD = 0.67). The least reported symptom was suicidal ideation (M = 0.36, SD = 0.72), suggesting generally low depression risk in the sample (Table 3).
Table 3.
Mean and Standard Deviation of Depression Risk Symptoms
| Item | Mean ± SD |
|---|---|
| 1. Little interest or pleasure in doing things | 1.35 ± 0.67 |
| 2. Feeling down, depressed, or hopeless | 1.25 ± 0.78 |
| 3. Trouble falling or staying asleep, or sleeping too much | 1.24 ± 0.89 |
| 4. Feeling tired or having little energy | 1.28 ± 0.97 |
| 5. Poor appetite or overeating | 1.15 ± 0.85 |
| 6. Feeling bad about yourself, feeling like a failure, or having let yourself or your family down | 0.98 ± 0.79 |
| 7. Trouble concentrating on things such as reading or watching TV | 0.95 ± 0.76 |
| 8. Moving or speaking noticeably slower or being overly fidgety/restless | 0.63 ± 0.71 |
| 9. Thoughts of self-harm or thinking you’d be better off dead | 0.36 ± 0.72 |
4.4. Correlation Analysis
Pearson’s correlation analysis revealed statistically significant but weak positive relationships between mental health knowledge and depression risk (r = 0.089, P < 0.05), between MHL and depression risk (r = 0.074, P < 0.01), and between mental health knowledge and literacy (r = 0.077, P < 0.05). However, all correlation coefficients were below 0.10, indicating very small effect sizes and limited practical significance, with only minimal shared variance among the variables (Table 4).
Table 4.
Correlation Matrix Among Mental Health Knowledge, Mental Health Literacy, and Depression Risk a
| Variables | Mental health knowledge | Mental health literacy | Depression risk |
|---|---|---|---|
| Mental Health Knowledge | 1.000 | ||
| Mental Health Literacy | 0.077 b | 1.000 | |
| Depression Risk | 0.089 b | 0.074 c | 1.000 |
a Pearson correlation coefficient was used.
b P < 0.05.
c P < 0.01.
5. Discussion
This study examined the levels of mental health knowledge and MHL among Thai undergraduate health science students and explored their relationship with depression risk. The findings revealed that most students possessed high levels of mental health knowledge and literacy, while the prevalence of depressive symptoms was generally low. However, statistically significant yet weak positive correlations were observed between mental health knowledge, MHL, and depression risk.
The association between mental health knowledge and MHL aligns with prior research, suggesting that foundational knowledge is an important, though not sole, component of literacy (10, 18). MHL is a broader construct encompassing not only knowledge but also attitudes, help-seeking intentions, and the ability to apply mental health information in daily life (8). As Rüegg and Abel (6) emphasized, MHL must be actionable to effectively influence outcomes.
The observed positive associations between MHL and depression risk should be interpreted cautiously. Given the cross-sectional design, these findings do not imply that higher literacy increases depression risk. One plausible explanation is that students with higher literacy may be more capable of recognizing and reporting depressive symptoms (20). However, this remains a speculative interpretation and requires confirmation through longitudinal or mixed-method research. This interpretation is supported by prior research, which suggests that greater MHL may lead to increased identification and labeling of psychological symptoms, even if it does not directly reduce their prevalence (18, 21).
Cultural and contextual factors may also explain these patterns. In Thailand, mental illness is still stigmatized and sometimes attributed to supernatural beliefs (22). Such perceptions can limit the protective effects of MHL unless accompanied by shifts in attitudes, support systems, and service accessibility (23). This aligns with findings from Southeast Asia, where higher MHL has been linked to more supportive behaviors, but not always lower mental health symptomatology (14).
This study's high reported mental health knowledge may reflect participants' backgrounds as health science students. Their health literacy and emerging professional identity might influence how they interpret and report mental health concepts. Cultural norms that emphasize social image and stigma avoidance could also lead to social desirability bias. Although standardized, anonymous tools were used, no social desirability scale was included, so some participants might have overestimated their knowledge or underreported symptoms. Future studies should include bias controls or mixed methods to better assess how culture and identity affect reporting.
Importantly, the findings suggest that while improving mental health knowledge remains valuable, knowledge alone is insufficient to meaningfully influence depression risk. Universities should therefore move beyond information-based approaches and prioritize interventions that strengthen applied mental health literacy skills, including reducing stigma, developing peer-support competence, and establishing structured help-seeking pathways. Enhancing students’ confidence in recognizing symptoms and accessing appropriate, formal and informal support is critical. Integrating experiential learning, case-based simulations, and campus-wide mental health initiatives may help translate literacy into actionable behavioral outcomes. For health science faculties in particular, embedding mental health competence in curricula is essential, given that students’ dual roles include navigating academic stressors and becoming future healthcare professionals responsible for supporting the mental well-being of others.
5.1. Limitations
This study has several limitations. First, its cross-sectional design prevents causal interpretations of the relationships among mental health knowledge, literacy, and depression risk. Second, the sample was limited to students from a single Thai university, which may affect generalizability. Third, self-reported data may be subject to bias, including underreporting of depressive symptoms due to stigma. Fourth, relevant variables such as coping styles, social support, and prior mental health service use were not included and may have influenced the findings. In this study, the very high proportion of students reporting high or very high mental health knowledge and literacy suggests a potential ceiling effect, which may have attenuated observed correlations among variables. Additionally, the extended data collection period (May 2024 to May 2025) may have introduced temporal variability related to academic stress cycles, cohort differences, or broader post-pandemic adjustments. These factors could have influenced reported mental health outcomes.
6. Conclusion
This study found that Thai undergraduate health science students generally demonstrated high levels of mental health knowledge and literacy, alongside relatively low levels of depression risk. Although statistically significant associations were identified between knowledge, literacy, and depression risk, the effect sizes were small, indicating limited explanatory power of these variables alone. These findings suggest that additional psychosocial, cultural, and contextual factors likely contribute to students’ mental well-being. While promoting mental health knowledge remains important, universities should prioritize strengthening practical MHL skills, such as symptom recognition, stigma reduction, and help-seeking confidence, to translate knowledge into meaningful behavioral outcomes. Given their dual roles as individuals navigating academic stressors and as future healthcare professionals, health science students must be equipped not only to manage their own mental health but also to support the well-being of others effectively. Future research should adopt more comprehensive models that incorporate broader determinants of student mental health in the Thai context.