


1. Background
The health status and disease profile of human societies are identified based on the economic improvement and social development. By industrialization, a major cause of humans’ death and inability, most of the developed and developing societies faced nourishing inadequacies, infectious diseases, and even chronic illnesses such as cardiovascular disease (CVD), cancer, and diabetes (1, 2). The CVD rate in the developed and developing countries vary depending on geographical area. A few studies reported the association between the development of CVD and routine risk factors, such as hypertension, total cholesterol, and smoking, which seem to decrees with aging (3, 4). Some other data suggested aggravating prevalence of other risk factors of CVD; for example, diabetes, obesity, and the metabolic syndrome (5, 6). CVD, cancers, and respiratory diseases are the 3 leading causes of mortality and morbidity. Obesity increases the risk of deaths due to any of the abovementioned diseases, and is additionally associated with different complications such as infertility, osteoarthritis, etc. (7). Body mass index (BMI), considered as a risk factor in the current study, is a weight: height ratio and the most commonly utilized tool and the basic measure of body size, which is used as often as possible to evaluate the prevalence of obesity in a population (8, 9). BMI is an index, which is reliably associated with predisposition to CVD and type 2 diabetes (10). Hypertension is the most common controllable symptom of heart and vascular problems, representing about half of the risks in the developed countries. It affects 50% of adults and is the leading cause of drug prescription (11). Numerous studies evaluated the relationship between hypertension and CVD and indicated a significant, predictable, and independent relationship between the 2 diseases (12). Hypercholesterolemia is a conceivably critical modifiable risk factor for cardiovascular problems. It is noteworthy that about 25% of males and 42% of females over 65 years old have total cholesterol of ≥ 240 mg/dL. It is evident that cholesterol is a key contributor to CVD, except for artery diseases (13). For several decades, the rate of changes in the risk factors of CVD in Iran was not measured. The present study aimed at determining the status of CVD in Iran (as a developing country) by assessing the trend of risk factors such as blood pressure (BP), total cholesterol, and BMI from 1980 to 2010.
2. Methods
The present cross sectional study was conducted based on the aggregate data available on the Gapminder Website (14). No sampling was done in the current study. The study population consisted of the Iranian population with regard to the availability of the data. The research was performed from 1980 to 2010.
2.1. Data and Variables
The data were extracted from the Gapminder Website where the information about the risk factors of chronic heart disease (CHD) is provided. The variables studied in the research were as follows:
males systolic BP (SBP) (mmHg), females SBP (mmHg), standardized mean age, males BMI, females BMI, male total cholesterol (mM/L), and female total cholesterol (mM/L).
2.2. Data Analysis
The bivariate Pearson correlation was used to estimate the correlation coefficient between SBP and BMI and also between total cholesterol and BMI in both males and females. To compare the mean SBP, mean total cholesterol, and mean BMI of males and females, the independent samples t test was used. To show the trend of male SBP, female SBP, male BMI, female BMI, male total cholesterol, and female total cholesterol within the period of 31 years, the message sequence charts were employed. To analyze data, SPSS version 16 was used; α = 0.05 was considered as the level of significance.
3. Results
The average SBP in males was 127.69 mmHg, while it was 126.12 mmHg for females. The mean BP difference between males and females was statistically significant (P < 0.001). The mean total cholesterol in males was 4.95 mM/L, while it was 5.10 mM/L in females and the difference between mean values of males and females was statistically significant (P < 0.001). Furthermore, the mean BMI in males was 24.35 kg/m2 and it was 27.32 kg/m2 in females; the difference between the mean values of the 2 genders was statistically significant (P < 0.001).The correlation coefficient between the mean BP and the mean BMI in males was -0.595 (P < 0.001), and the correlation coefficient between total cholesterol and BMI was 0.476 (P = 0.007); the correlations were also significant. The correlation coefficient between the mean BP and the mean BMI for females was -0.905 (P < 0.001), while their correlation coefficient between the total cholesterol and BMI was r = -0.939 (P < 0.001); the correlation in both comparisons was significant.
3.1. The Trend of Males
The mean BP decreased from 1980 to 1997 and then, increased until 2008, and in 2009 and 2010 remained constant. The changes in the mean PB in males and females during the 31 years study are shown in Figure 1.
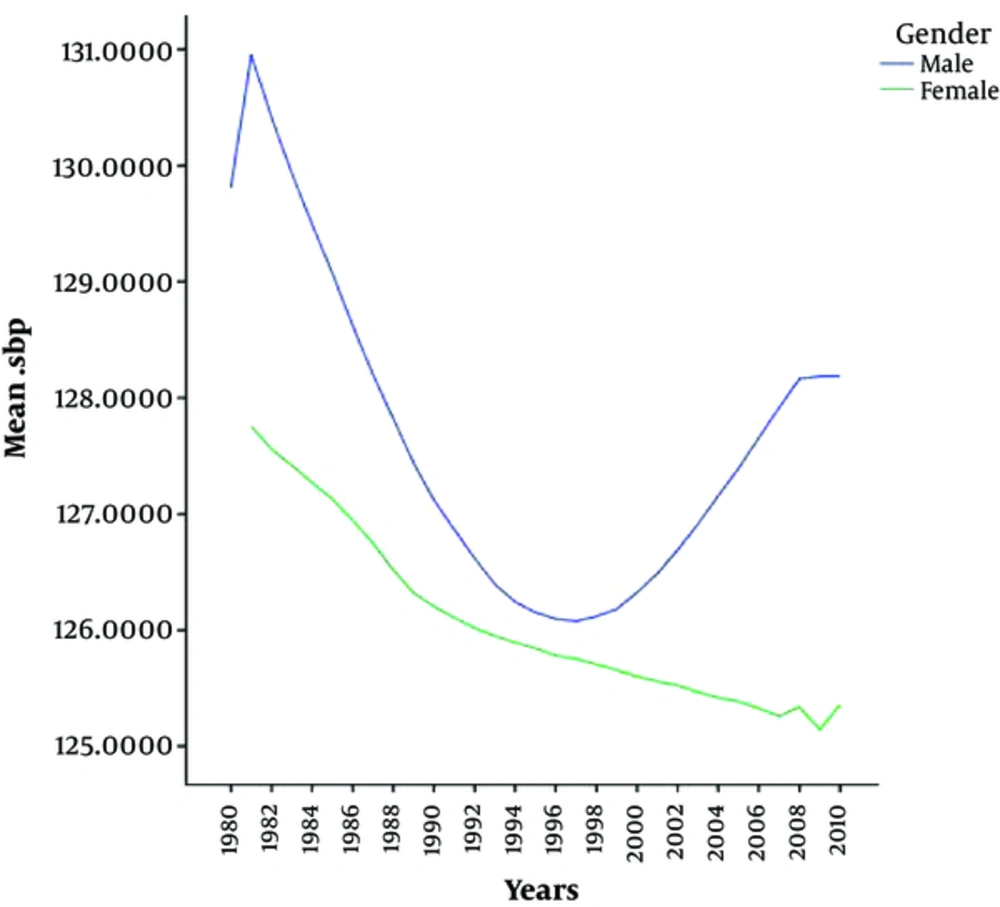
Figure 1.
The Average Blood Pressure (mmHg) in Males and Females from 1980 to 2010
The total cholesterol levels in males reduced from 1980 to 1990 and afterward increased until 2010. The average total cholesterol in females during 3 decades showed an increasing trend.
Figure 2 shows the changes in the mean total cholesterol in males and females from 1980 to 2010.
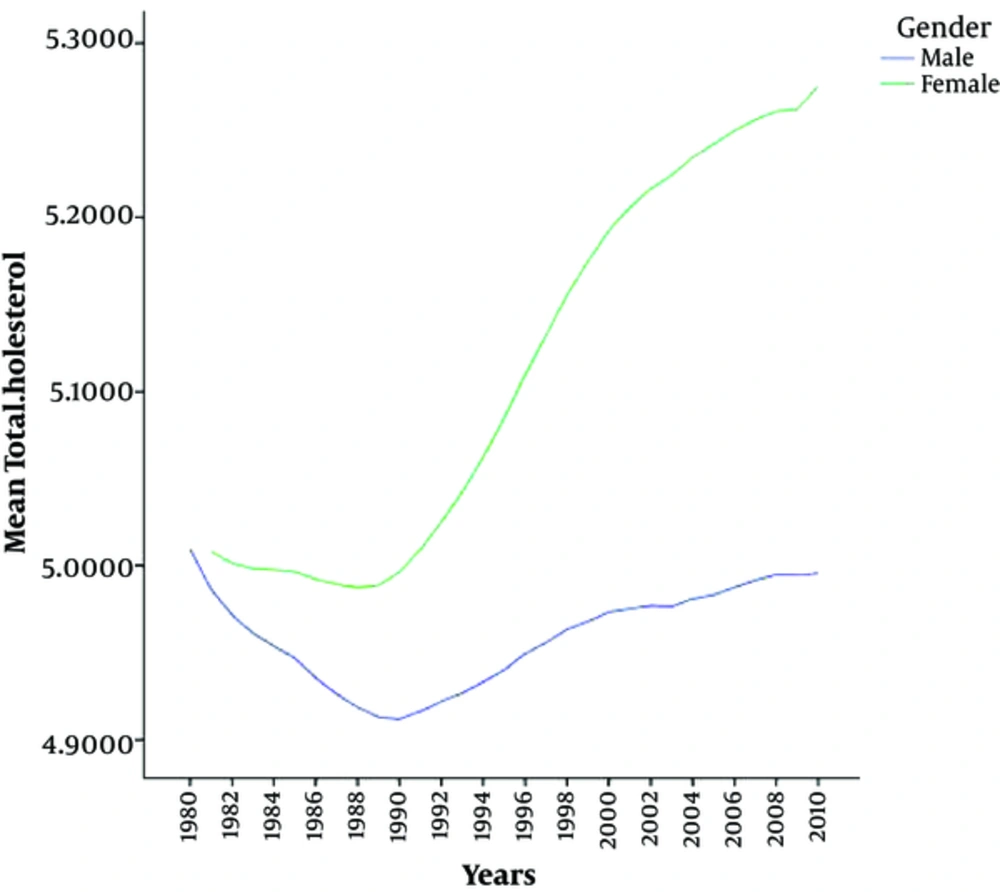
Figure 2.
The Changes in the Mean Total Cholesterol (mM/L) in Males and Females from 1980 to 2010
The average BMI variations for males and females are shown in Figure 3.
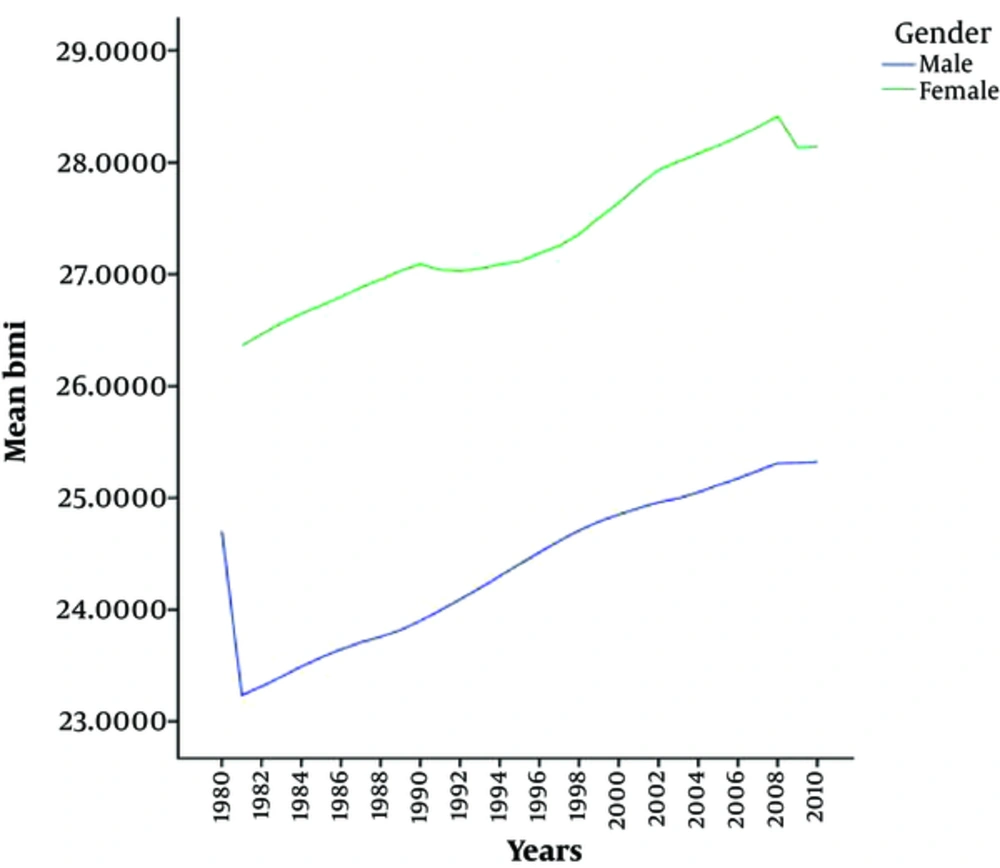
Figure 3.
The Average BMI Variations in Males and Females from 1980 to 2010
The Average BMI for males and females increased during the study years.
4. Discussion
The mean PB had a decreasing trend from 131.57 to 128.18 mmHg in males and from 128.03 to 125.35 mmHg in females from 1980 to 2010. A systematic review on adults above 25 years old in 199 countries and territories showed that males and females in Australia, North America, and Western Europe experienced a remarkable decrease in SBP. On the other hand, SBP increased for in males and females in Oceania, Eastern Africa, South and South-East Asia, and just for females in Western Africa. The current study also indicated a decline in the mean SBP all over the world from 130.5 to 128.1 mmHg from 1980 to 2008; a global decrease of SBP also observed by 0.8 mmHg per decade from 1980 to 2008 (15). A study in London regarding the mean SBP was conducted on a population within the age range of 16 to 54 years and reported BP rate of 127.5 mmHg for males and 117.3 mmHg for females. Hence, SBP increased by 0.2 mmHg in females and decreased by 0.5 mmHg in males in 2009, but a significant decrease was observed in BP rate for both genders aged ≥ 55 years (16). There was also a downward trend in BP rate in the Iranian adolescents from 1998 to 2008 (17).
Although the reason for these changes is unknown, many studies showed that the diet can shift the PB curve to a downward direction. The results of a clinical trial showed that a diet rich in fruits, vegetables, and low-fat dairy products with lower saturated and total fat can decrease SBP by 5.5 mmHg and diastolic BP (DBP) by 3 mmHg that was higher than those of the control group (18). Another clinical trial in the US on 412 companies revealed that cutting back on salt (sodium) from high to middle, reduced SBP by 2.1 mmHg in the control and 1.2 mmHg in the DASH group, and also decreased sodium from middle to lower level from 4.6 to 1.7 mmHg in the control and DASH groups, respectively (19). A meta-analysis showed that the modest and long-term reduction in salt intake for 4 weeks reduced the PB dramatically in both hypertensive and normotensive groups. A 9% decline in stroke death and 14% in coronary death in the hypertensive patients as well as 6% in stroke death and 4% in coronary death in the normotensive patients can serve as a proof of this claim (20). It seems that the increase of awareness about healthy diet in recent years greatly influenced females and they paid more attention to their health status compared with males. In the current study, the mean BMI was changed from 23.16 to 25.32 kg/m2 in males and from 26.24 to 28.14 kg/m2 in females during the study period. A national health survey of people aged 25 - 64 years showed that the mean BMI increased from 25.03 kg/m2 in 1999 to 26.14 kg/m2 in 2005 (21). It is not only about Iran, but it is a common even all around the world. A systematic review of 9.1 million participants showed that the global mean BMI increased 0.4 kg/m2 per decade for males and 0.5 kg/m2 for females from 1980 to 2008 (22). In the USA, BMI increased 0.08 kg/m2 in males and 0.19 kg/m2 in females per year (23). Katherine reported that the mean BMI remained constant as 28.7 kg/m2 from 2009 to 2010 and a remarkable increase was shown in males BMI value during the recent 12 years, but indicated no significant changes in that of females (24). Flegal in a 20-year study showed that the mean BMI increased in both white and black females at different income and educational levels (25). Unfortunately, this upward trend progresses much faster in the developing countries than the developed ones; for example, the annual rate of obesity in adult males and females in European and North American countries is 0.25, while it is 2 - 5 times higher in Latin America, Northern Africa, and Asia (26). The changes in food habits, job structure, leisure activities, and exercises are the reasons for such upwards. In addition, McTigue found that the individuals who born in the earlier decades of the century usually have a larger age-specific BMI compared with the ones born in the later decades. The people who born in 1957 had a lower mean BMI than the ones born in1964 (27).
4.1. Cholesterol
Based on the results of the current study, the total cholesterol increased in both genders, except a decreasing trend in males from 1980 to 1990. Farzadfar focused on the total cholesterol of global population and reported a significant decrease in the total cholesterol level in high-income nations including Australasia, North America, and Western Europe by 0.19 mM/L per decade in males and 0.21 mM/L per decade in females, whereas it increased by 0.08 mM/L per decade in males and 0.09 mM/L per decade in females in East and South-East Asia and the Pacific region (28). Similar studies in the developing countries also reported the same decreasing trend (29, 30). However, an increase in total cholesterol level was observed in Asian countries such as Malaysia, Singapore, Korea, China, and Philippines. Despite the fact that Japan has the least amount of total cholesterol in Asian countries as well as the world, an increase in the total cholesterol of Japanese was observed once in 1958 (31). A reason underlying this increase might be the ascending trajectory of BMI. The second national health and nutrition examination survey (NHANES II) showed that the changes in BMI are accompanied with the changes in total cholesterol (32). A study by Richard also indicated that the total cholesterol and BMI are increased simultaneously (33). Although some other factors contributing total cholesterol increase, apart from BMI increase, the total cholesterol levels can be controlled by cholesterol-lowering drugs and lifestyle modifications, i.e. physical activities and low-fat diets (30). Therefore, controlling any of these factors may induce changes in the general trend.
4.2. Conclusion
Results of the current study indicated that among the risk factors for CVDs, more attention should be paid to PB, and the average PB had a declining trend in recent years due to effective measures and policies. Meanwhile, less attention is paid to other factors such as cholesterol level and BMI; hence, purposive training and interventions to modify lifestyle and nutrition habits are of great importance.

