
1. Background
Given the increasing number of populations and resource constraints in the agricultural sector and the urgent need to increase agricultural production, we feel the need for a rational and principled struggle against pests with an emphasis on compliance with the health of farmers and community members concerning environmental issues. A major part of these strategies includes different ways of combating harmful agents and pests, as well as identifying and applying chemical pesticides. The disadvantages of these pesticides are numerous because of their persistence in the environment and adverse effects on living organisms (1, 2).
One of the most common agricultural pesticides is organophosphorus pesticides. These toxins comprise a heterogeneous group of compounds that are all derived from phosphoric acid. They have two organic side chains and one additional side chain. This chain can contain groups such as cyanide, thiocyanate, halide, phosphate, phenoxy, thiophenoxy, or carboxylate. Most of these compounds are absorbed very rapidly through contact (3).
Organophosphorus toxins bind to enzyme acetylcholinesterase and phosphorylate it. This can disrupt the activity of the enzyme for the degradation of the acetylcholine neurotransmitter. Acetylcholine is one of the most important chemical intermediates in nerve terminals that is hydrolyzed into acetic acid and choline by the cholinesterase enzyme, thereby preventing the over-transmission of nerve signals to the synapses. Thus, excessive accumulation of this chemical intermediate occurs at the nerve terminals as a result of inhibition of acetylcholinesterase enzyme and disruption of the acetylcholine degradation process (4).
Diazinon is one of the most widely used organophosphorus toxins. The introduction of this contaminant into water resources, soil, and agricultural products can have devastating effects on human health and the environment. Diazinon with a lethal density of 50 - 100 (LD50 = 50 - 100 mg/kg) is a relatively volatile phosphorus pesticide. Diazinon in the body of animals can cause death by cholinesterase depletion and disruption of nerve cells (3).
Berberine is an organic yellow alkaloid with a bitter taste that has been used in traditional Chinese medicine for nearly 3,000 years. Some of the multiple effects of berberine include the promotion of nerve protection factors/pathways and some others include the neutralization of those that increase nerve damage (5). Research has shown that berberine can increase behavioral dysfunction through cortex neurogenesis. The neuroprotective effects of berberine are said to be associated with the survival/apoptotic/GSK3β/Akt/ERK1/2 signaling pathway, as well as the inhibition of caspase 3 and JNK activity. In addition to using such substances to counter the destructive effects of diazinon toxin, it will be useful to utilize other effective methods that can increase the ability to cope with such poisons (6).
Today, sports and physical activity are viewed not only as a way of leisure, but also as an indispensable necessity for health and well-being. The positive effects of regular exercise and physical activity have been confirmed in various studies (7).
Insulin-like growth factor-1 (IGF-1) is a trophic mediator that acts through growth hormones and regulates cell growth and peripheral metabolism (8). This growth factor is expressed in many tissues including the brain and is important due to nerve cell growth, differentiation and synthesis, and the release of neurotransmitters (9). Acute exercise stimulates the expression and release of IGF-1 from the liver. Thus, it seems that the expression and secretion of IGF-1 are essential for hippocampal neurogenesis induced by acute activity, as well as recovery of function after brain damage (8, 10). It is said that resistance training increases neuronal plasticity due to an increase in IGF-1. Research has shown that IGF-1 can cross the blood-brain barrier and play an important role as a neurotrophic factor, especially in the hippocampus and in the activation of various important central mechanisms related to cognitive processes (11).
Angiogenesis is a process that drives endothelium function to produce new blood vessels by branching to the previous blood vessels (12). Angiogenic growth factors and proteases play a key role in the process of angiogenesis. Among angiogenic factors, the vascular endothelial factor has been identified as the most potent endothelial cell mitogen. Vascular endothelial growth factor (VEGF) stimulates endothelial cell proliferation and differentiation and enhances vascular permeability. Angiogenesis is a form of adaptation to physiological stimuli such as exercise that compensates for increased metabolic needs of tissue (13, 14).
Platelet-derived growth factor (PDGF) is one of the growth factors with a protein structure. These proteins are involved in the growth and metabolism of many cells and are a type of cytokines involved in the angiogenesis process (15).
2. Objectives
In the present study, we exposed rats to diazinon to induce toxicity. Then, we investigated the combined effects of resistance training and berberine chloride in rats. The effects of berberine and resistance training were also examined on changes in IGF-1, VEGF, and PDGF gene expression in rats exposed to diazinon.
3. Methods
We selected 40 male Wistar rats, 40-50-weeks-old, weighing 250 ± 50 g, at the Animal Laboratory Research Center of Islamic Azad University, Central Tehran Branch. All animals were kept under standard laboratory conditions in cages sized 15 × 15 × 30 cm made of transparent polycarbonate (four rats per cage) in controlled conditions (ambient temperature 22 ± 2°C, humidity 50 ± 5, light/dark cycle 12:12, and free access to adequate food and water). All experiments were performed following the laboratory guidelines for the care and use of animals in Iran, as well as the guidelines of the Animal Care Ethics Committee of the Research Institute of Sport Sciences (code of ethics: IR.SSRI.REC.1396.159).
Animals were randomly divided into eight groups, including G1: diazinon + berberine chloride (2 mg/kg) + resistance training, G2: diazinon + berberine chloride (15 mg/kg) + resistance training, G3: diazinon, G4: diazinon + resistance training, G5: diazinon + berberine chloride (2 mg/kg), G6: diazinon + berberine chloride (15 mg/kg), G7: control, and G8: normal saline (sham).
3.1. Chemicals and Toxins
Berberine chloride was purchased from Sigma, USA, in the powder form. The doses of berberine were 2 and 15 mg/kg of body weight for five weeks (five days per week) to be administered intraperitoneally. Berberine was diluted in normal saline 0.09%. Berberine chloride solution was prepared using a magnet on a stirrer machine without heat. Insulin syringes were used to inject berberine. Diazinon was purchased from Sigma, USA. Diazinon was administered intraperitoneally to rats at a dose of 1.5 mg/kg of body weight. Dilution was performed with normal saline 0.09%.
3.2. Training Protocol
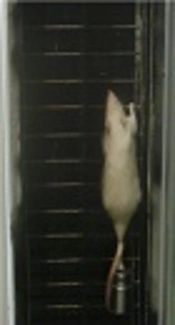
Resistance training was performed in one session per day, three days a week, for five weeks, consisting of climbing a wooden vertical ladder with 26 steps (100 cm height with 2 cm inter-step distance and 80 degrees slope) while carrying weights attached to their tail. Each training session consisted of two sets and six repetitions that required 8 to 12 active movements per climb. The rest lasted 60 s between each repetition and 2 - 3 min between each turn. Weights started at 10% of the total body weight, which increased to 20% in the second week, 30% in the third week, 40% in the fourth week, and 50% in the fifth week. The rats were weighed at the beginning of each exercise week and the new weights the rats were supposed to carry were adjusted to their weight of that week. The training protocol is presented in detail in Table 1.
Table 1.
Resistance Training Protocol
| Training Period | Number of Sessions Per Week | Type of Movement | Sets and Repetitions in Each Session | Number of Movements Per Repetition | Rest Between Each Repetition, s | Rest Between Each Set | Percent Weight of Animals’ Weight, % |
|---|---|---|---|---|---|---|---|
| 5 weeks | 3 | Climbing ladder | 2 × 6 | 8 - 12 | 60 | 2 - 3 min | 10 - 50 |
3.3. Animal Dissection and Extraction of Hippocampal Tissue
For tissue extraction, at the end of the fifth week of training and 48 hours after the last training session, rats were injected intraperitoneally with a combination of ketamine (75 mg/kg; Sigma, USA) and xylazine (10 mg/kg; Sigma, USA). To collect hippocampal specimens, rats’ heads were separated from the neck by special scissors. The skull was first surgically cleaved and the brain was removed with caution. After being placed in cold saline solution, cooling, and tissue consistency, the brain was split right into the middle by a surgical razor blade and considering the coordinates of the hippocampus. Finally, the hippocampus was separated from the limbic system with the help of a clean atlas of the sinus.
3.4. Gene Expression Assessment Using Quantitative Real-Time RT-PCR
To investigate the expression of the given genes, total RNA was extracted from hippocampal tissue by a Trizol solution (Kiazol, USA). A nanodrop machine was used to accurately measure the RNA concentration.
The cDNA was synthesized using a specific kit (BioFact) based on its instructions. Accordingly, first, 500 ng of RNA was combined with 10 µL of the kit prepared mixture (including reaction buffer, dNTP, random hexamer primers, oligo(dT) primers, nuclease inhibitor, and reverse transcriptase enzyme) and reached the maximum size using nuclease enzyme-free water.
The given mixture was kept at 42°C for 40 min and at 85°C for 5 min. The primers used in this study are shown in Table 2. We used GAPDH as the reference gene in each sample.
Table 2.
Sequences of Primers Used in Real-Time PCR
| Name | Primer | Gene Bank Number | Size (Open Pair) |
|---|---|---|---|
| VEGF | F: 5’-GAGCAGAAAGCACATGAAGTGG-3’ | XM-006241191 | 136 |
| R: 5’-GCAAACAGGACGGCTTGAAGA-3’ | |||
| IGF-1 | F: 5’-TGGACGCTCTTCAGTTCGTGT-3’ | XM-006241191 | 223 |
| R: 5’-TGAGTCTTGGGCATGTCAGTGT-3’ | |||
| PDGF | F: 5’-GACAAGAAGGGACTGAAGGAGA-3’ | NM-031524.1 | 140 |
| R: 5’-AGACAGAAGGACGAGGGGAA-3’ | |||
| GAPDH | F: 5’-AAGTTCAACGGCACAGTCAAGG-3’; | NM-017008 | 121 |
| R: 5’-CATACTCAGCACCAGCATCACC -3’ |
A kit (BioFact) was used to measure gene expression. The temperature program to perform the reaction included 15 min at 95°C, 20 s at 95°C, and one minute at 60°C for 40 cycles. The 2-ΔΔCT (fold change) method was used to determine the relative expression of the given genes. Cycle Threshold (CT) of samples was compared with internal control CT (GAPDH).
3.5. Statistics
Descriptive statistics were used to classify and determine the measures of dispersion. The Kolmogorov-Smirnov test was used to detect the normal distribution of data. One-way and two-way analysis of variance (ANOVA) and Tukey’s post hoc tests were used to determine the significance of differences between groups. Data were analyzed using GraphPad Prism software (version 8). P values of less than 0.05 were considered statistically significant. All data were expressed as mean ± SD.
4. Results
The levels of VEGF, IGF-1, and PDFG gene expression in different treatments are shown in Tables 3-5, respectively.
Table 3.
Mean IGF-1 Gene Expression in Different Treatment and Control Groupsa
| IGF-1 | Values |
|---|---|
| G1 | 0.4657 ± 0.02427 |
| G2 | 0.4399 ± 0.04207 |
| G3 | 0.1154 ± 0.02427 |
| G4 | 0.3250 ± 0.03916 |
| G5 | 0.2092 ± 0.02534 |
| G6 | 0.3095 ± 0.02534 |
| G7 | 1.004 ± 0.09287 |
| G8 | 1.011 ± 0.05450 |
aValues are expressed as mean ± SD.
Table 4.
Mean VEGF Gene Expression in Different Treatment and Control Groupsa
| VEGF | Values |
|---|---|
| G1 | 0.4635 ± 0.1585 |
| G2 | 0.5394 ± 0.2168 |
| G3 | 0.1661 ± 0.04053 |
| G4 | 0.2876 ± 0.02397 |
| G5 | 0.2387 ± 0.02274 |
| G6 | 0.2915 ± 0.02947 |
| G7 | 1.005 ± 0.1045 |
| G8 | 1.206 ± 0.03655 |
aValues are expressed as mean ± SD.
Table 5.
Mean PDGF Gene Expression in Different Treatment and Control Groupsa
| PDGF | Values |
|---|---|
| G1 | 0.6250 ± 0.02628 |
| G2 | 0.5220 ± 0.03094 |
| G3 | 0.1512 ± 0.01607 |
| G4 | 0.3714 ± 0.03633 |
| G5 | 0.2843 ± 0.02713 |
| G6 | 0.4094 ± 0.05390 |
| G7 | 1.001 ± 0.04046 |
| G8 | 1.039 ± 0.1632 |
aValues are expressed as mean ± SD.
4.1. IGF1 Gene
The results of comparison of different treatment and control groups for mean IGF-1 gene expression showed significant differences between G1, G2, G3, G4, G5, G6, G7, and G8 (P < 0.05). However, no significant differences were observed between G1 and G2, between G3 and G5, between G4 and G6, and between G7 and G8 (P > 0.05) (Figure 1).
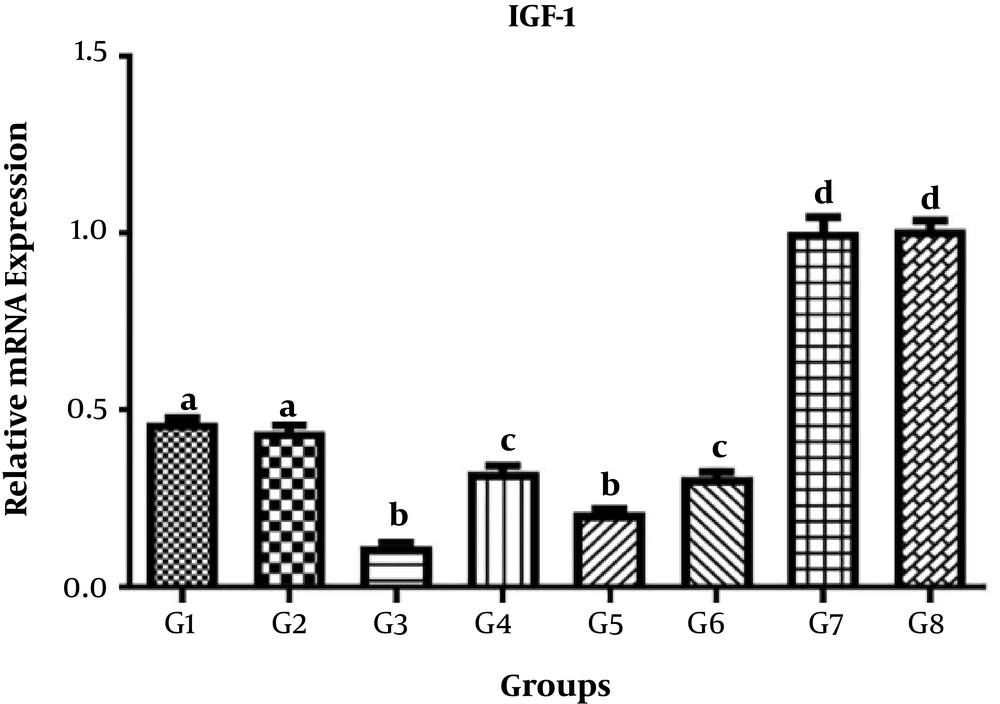
Figure 1.
Changes in IGF-1 gene expression in different treatment and control groups (mean ± SD). Similar letters indicate no significant difference (P > 0.05) and non-similar letters indicate a significant difference (P < 0.05).
4.2. VEGF Gene
The results of comparison of different treatment and control groups for mean VEGF gene expression showed that there were significant differences between G1, G2, G3, G7, and G8 groups at the level of 0.05 (P < 0.05) while no significant differences were observed between groups G2, G4, and G5 at the 0.05 level (P > 0.05) (Figure 2).
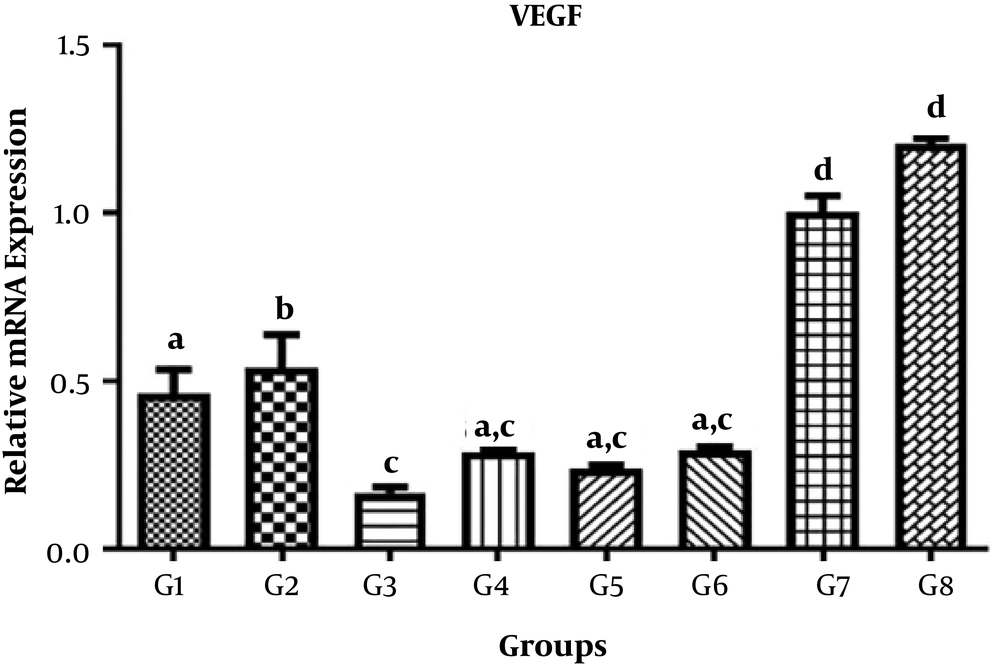
Figure 2.
Changes in VEGF gene expression in different treatment and control groups (mean ± SD). Similar letters indicate no significant difference (P > 0.05) and non-similar letters indicate a significant difference (P < 0.05).
4.3. PDGF Gene
The results of comparison of different treatment and control groups for mean PDGF gene expression showed significant differences between G1, G2, G3, G4, G5, G6, G7, and G8 (P < 0.05), but there were no significant differences between G1 and G2, between G3 and G5, between G4 and G6, and between G7 and G8 (P > 0.05) (Figure 3).
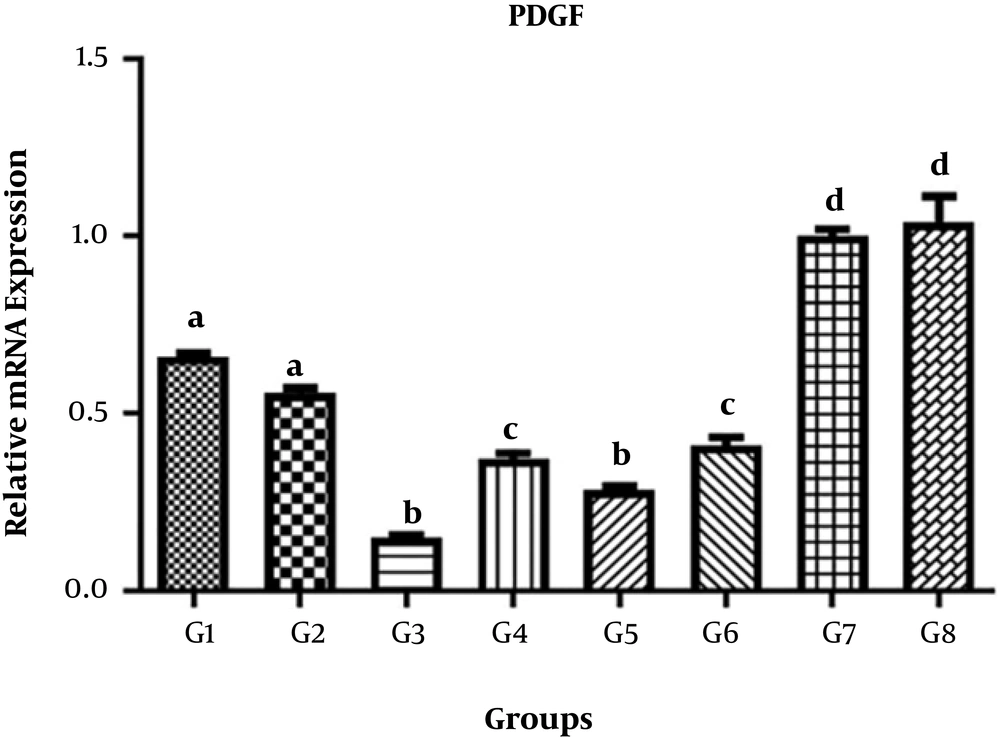
Figure 3.
Changes in PDGF gene expression in different treatment and control groups (mean ± SD). Similar letters indicate no significant difference (P > 0.05) and non-similar letters indicate a significant difference (P < 0.05).
5. Discussion
The therapeutic effects of resistance and physical exercise are well recognized on the heart and metabolic diseases (16, 17). Physical activity and exercises can affect the immune and inflammatory responses by altering the serum levels of growth factors and intermediates (18, 19). One of these factors is IGF-1.
The effect of exercise on IGF-1 has been investigated in several studies. In a study by Hagberg et al. (20), following 60 min of training on a treadmill at 70% of the subjects’ maximal oxygen consumption, a significant increase was observed in IGF-1 levels. However, in the present study, due to the effect of organophosphorus pesticides on living organisms, a significant decrease was observed in the expression of this gene compared to the control and treatment groups with different concentrations of diazinon and berberine chloride (P < 0.05).
Based on studies by other researchers, organophosphorus toxicity is induced by cellular mechanisms. Among their effects is the production of free radicals by these compounds, followed by changes in the cell's antioxidant system and membrane lipid peroxidation.
In fact, organophosphorus toxins can disrupt the antioxidant system (21, 22). As the rate of production of oxidative compounds increases, it can have devastating effects, including inflammation, damage to the DNA and cell membrane, as well as reduced ability to store glycogen (23). These consequently result in reduced gene expression.
The exercise may have contradictory results for serum PDGF and VEGF angiogenesis factors. As Van Craenenbroeck et al. (24) showed, the serum levels of VEGF increased after acute exercise. On the other hand, Suhr et al. (14) reported no change in serum VEGF following acute exercise while Gu et al. (25) reported a decrease in serum VEGF concentration.
Most researchers still believe that long-term, endurance aerobic exercise can increase angiogenesis, which is caused by increased expression of the relevant genes. But in the present study, the levels of VEGF and PDGF gene expression in diazinon-treated rats decreased despite exercise training compared to the sham and control groups, which could be due to the deleterious inflammatory effects and oxidative stress of organophosphorus toxins such as diazinon that significantly decreased the expression of this gene in the treatment group compared to the control group. On the other hand, Sihvo et al. (26) showed that increased oxidative stress decreased antioxidant capacity and caused a negative correlation between glutathione content and DNA adduct and gene expression, indicating a relationship between oxidative stress and genetic conditions in the body. It also induces changes in cellular redox conditions and the activity of trans-activating factors in many transcription factors, thereby causing alterations in the target gene expression and cell function (26).
5.1. Conclusions
In this study, berberine supplement was used to counteract the deleterious effects of diazinon toxin. The results showed that the levels of gene expression studied were lower in diazinon-poisoned rats using berberine supplementation than in rats exposed to resistance training. Of course, this ineffectiveness of berberine supplement may be due to the short-term use or the low dose of berberine. Also, the levels of gene expression were significantly lower in all treatment groups than in the control and sham groups.
Based on the results of this study, resistance training and berberine supplementation have significant effects on reducing the deleterious effects of diazinon toxin and increasing the levels of IGF-1, PDGF, and VEGF gene expression in poisoned rats.