1. Background
The development of virtual human models has recently gained considerable attention in biomechanical studies to design for ergonomics. There is an increasing interest in finding the realistic posture of the human body with application in prototype design and reduction of injuries in the workplace. The computer-based simulations of virtual human models reduces the design cycle time and cost. To model work environments, most biomechanical models require the precise body posture of the worker. Therefore, posture prediction is a significant aspect of the digital human simulation package. This paper presents a generic method based on a multi-objective optimization (MOO) for posture prediction of a sagittal-plane lifting task. Improved biomechanical models have been used to formulate the predicted posture as a multi-objective optimization problem. The hypothesis is that human performance measures (cost functions) govern the configuration of the body. There are three main methods of posture prediction. The first uses empirical data, statistical regression, and the data obtained from a large number of experiments or simulations of three-dimensional computer-based models (1-4). However, this cannot be used in engineering design, where each task requires performing thousands of trials for different percentiles of male and female subjects. The second method uses the inverse kinematics approach to determine the joint parameters that provide a desired position (5-10). However, due to the difficulty of evaluating the Jacobian when the model has many degrees of freedom, this method can only be used for simple models. The latest approach is the optimization-based method that provides computationally effective models for complex systems. Here, various objective functions that represent human performance measures (such as total effort, discomfort) are optimized (11-14), and it is possible to consider a combination of various cost functions to formulate a MOO problem and predict more accurate postures. This method addresses most of the questions associated with previous methods (15).
Development of biomechanical models that realistically predict the posture of the human body is a challenge for ergonomists. The ideal biomechanical models have certain attributes. First, realism necessitates the model to be three-dimensional. However, for symmetrical planar tasks, two-dimensional methods have been well justified (16-18). Second, there should be a balance between the complexity of the model and its computation time. Among many tasks studied by the ergonomists, static lifting posture prediction has gained considerable attention. Three main performance measures suggested to affect the postures assumed in lifting tasks are minimum overall effort (19), local effort or fatigue (20, 21), and greatest stability (22, 23). Other proposed behavioral criteria or objective functions are the minimum potential energy of a system, joint discomfort, and joint displacement (12, 13, 24-27). However, most of the previous studies have difficulty predicting the forearm and upper arm angle accurately. Furthermore, the question of why some people select the squat posture while the others prefer to assume the stoop type postures for the same lifting condition is both poorly understood and studied.
2. Objectives
The main goal of this study is to predict realistic stooped and squat postures with reasonable accuracy given the nature of actual human joints. We developed an improved biomechanical model to predict human posture for the sagittal-plane lifting task. To deal with the redundancy of the model, a MOO method with some kinematics constraint was used.
3. Methods
We first introduced a three-dimensional model and then reduced the number of modes in which it can move (degree of freedom (DOF)) to 11 for simulating a symmetric lifting task in the sagittal-plane. Then we presented the MOO formulation of our inverse kinematic problem along with the design variables and constraints.
3.1. Model
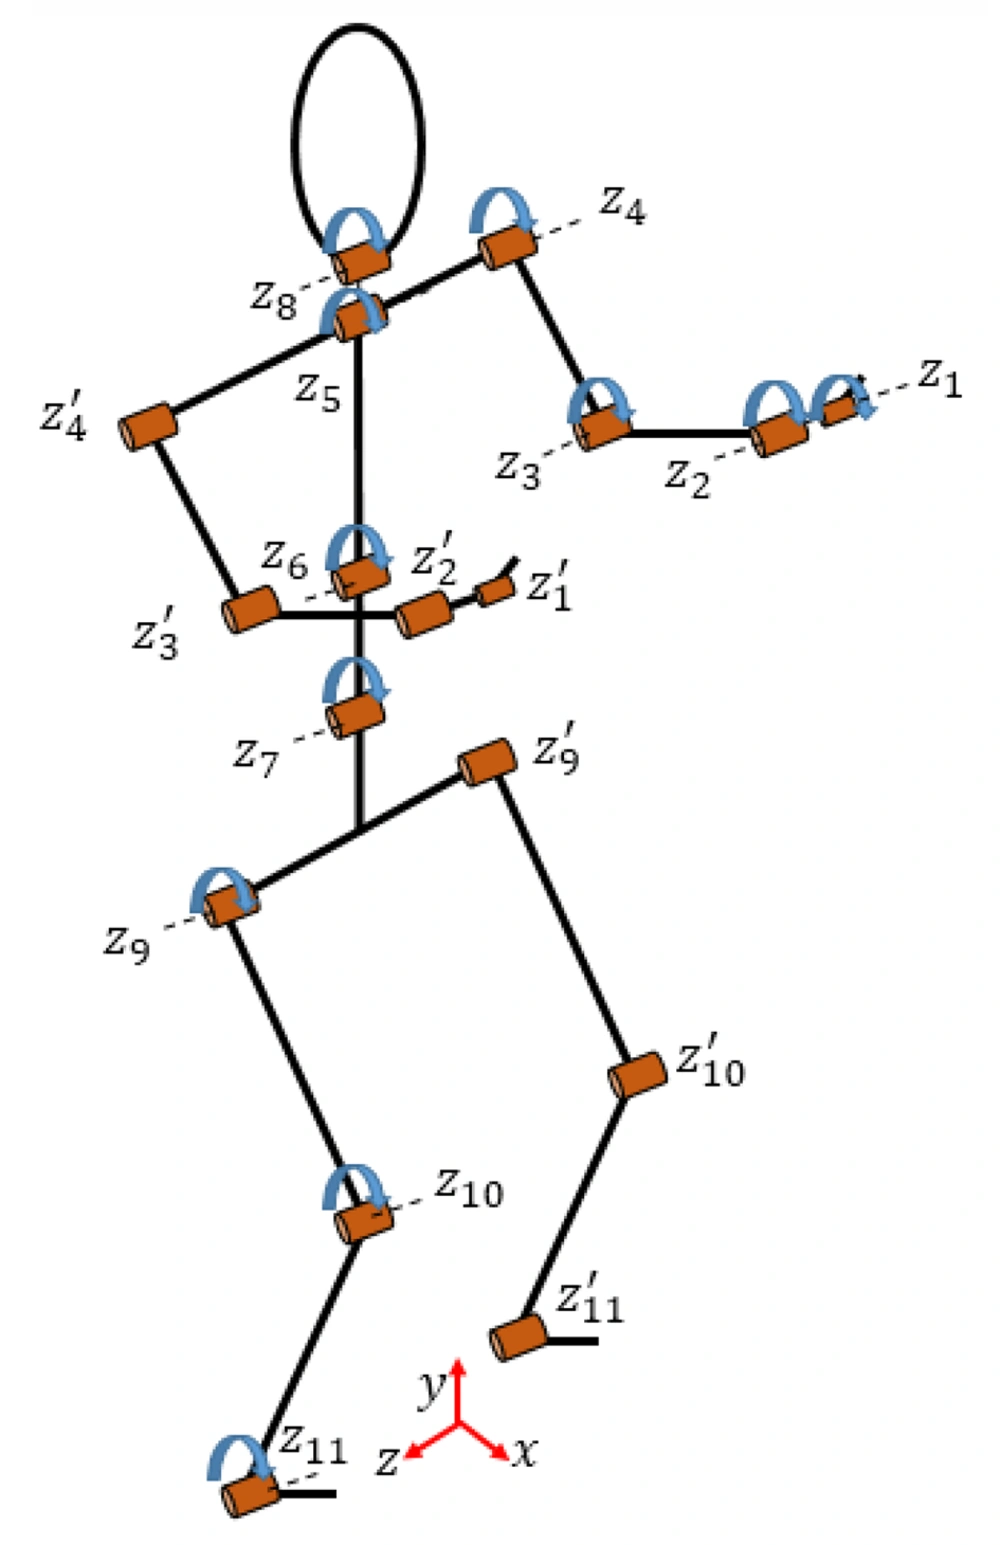
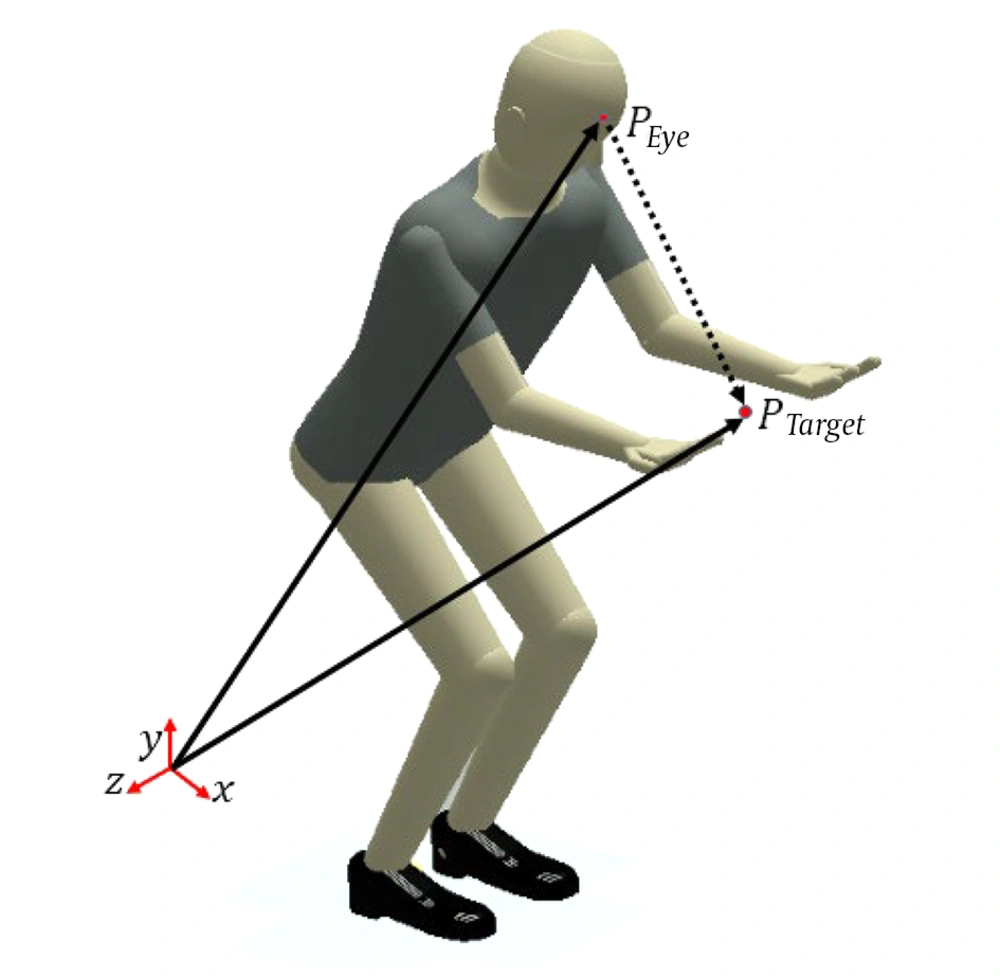
Our virtual human model is illustrated in Figure 1. The model consists of six branches, including the right and left leg, the spine, the right and left arm, and the head. The spatial skeletal human model was constructed by using the Denavit-Hartenberg (DH) method (28). Each DOF (the z’s) represents the relative rotation of two body segments connected by a revolute joint. The assumption is that in the sagittal-plane lifting task, hands and feet move symmetrically, and no out-of-plane movements occur. Therefore, the kinematics joints from the fingers to the waist have seven DOFs. The kinematic joint for the neck has one DOF, and the kinematic joints for the legs and feet have three DOFs. The virtual human model is presented in Figure 2.
3.2. Performance Measures
Among various cost functions suggested for formulating the MOO problem of posture prediction, we considered the weighted sum of seven objective functions of total torque (total effort), delta-potential energy, shear force, compression/tension force, discomfort, sight angle, and head torque about the neck. The optimization problem is formulated as the following equation.
Where Wi is positive weights that show the relative importance of the objective functions. The weights are obtained by fitting the predicted postures to postures assumed by actual subjects. We use the postures obtained by Dysart and Woldstad (23) and Gallagher et al. (29) in the experiment as a reference to obtain the weights. Our preferences can be incorporated to predict both stooped and squat postures. In what follows, a brief description of each human performance measure is presented.
3.2.1. Total Torque
The hypothesis is that the subject assumes a posture that requires minimum total effort. In this criterion, the minimum effort, which is minimized, is defined as the total external torque summed over the joints. To avoid numerical difficulties, we used the sum of the square of moments as follows:
3.2.2. Delta-Potential Energy
This criterion focuses on the change in the potential energy of each segment of the virtual human model. Mathematically, this performance measure presents a weighted summation of movements of different body segments. Here, the weights are the forces of gravity exerted on each part. The final function is suggested to be as follows:
Where n = 19 is the number of lumped masses.
Compression/tension forces: Considerable amounts of compression/tension forces are applied to the human body joints during the lifting task. To minimize compression forces, the following objective function is suggested. wc/t,i is 10 for L5/S1, neck, and knee joints, while for other joints wc/t,i = 1.
3.2.3. Shear Forces
forces acting perpendicular to the axis of the spine apply a shearing force that tries to slide the components away from their normal axis. If the shear forces are high enough, ligament and disk tears may lead to shear fractures of the vertebrae. To minimize shear forces, the following objective function is suggested. ws,i is 10 for L5/S1, neck, and knee joints, for other joints ws,i = 1.
3.2.4. Discomfort
Subjects prefer to minimize their joint displacements from a neutral position. To indicate the relative importance of each joint, specific weights are assigned to each joint based on its tendency to be activated. In this study, we used the cumulative joint displacement formulation presented by Yang et al. (24) to approximate the results of the lexicographic method. In our study, we select γ = 1 for knee, ankle, and hip joints. For other parameters in the following equation, we use the values suggested in previous studies.
3.2.5. Sight Angle
Subjects always attempt to maintain the sight of the load in the lifting task. Therefore, to quantify this performance measure, we defined the sight angle as the angle of the vector connecting the eye to the target point (Figure 2). The formulation is as follows:
Peye is the position vector of the center of mass of two eyes; Ptarget is the position vector of the target point (load).
Head torque about the neck: In analyzing the postures selected by subjects, it became apparent that they are trying to minimize the movement created by the head over the neck. Thus, the following equation is suggested for this performance measure.
Where d is the projected distance between the CM of the head and the neck joint in the x direction.
3.3. Design Variables and Constraints
First of all, the end-effector distance constraint has to be met, since the position of the load is fixed for each lifting task.
Second, the posture has to be a stable static posture. Furthermore, given the nature of actual human joints, and by analyzing the postures assumed by subjects in previous experiments, four inequality constraints were considered to avoid predicting unreal postures. These constraints are: (a) each joint angle is restricted to lie within predetermined limits suggested by empirical data, (b) The knee must always be located under the shoulder, (c) The ankle must always be located under the elbow. (d) The head must be above the end-effector (load). Constraints a, b, and c ensure that the predicted posture is not unrealistic. The last limit ensures that the virtual human always maintains sight of the load. These constraints are applicable for predicting both stoop and squat type postures.
4. Results
First, we obtain the assigned weights for each objective function in Equation 1 by the trial and error method and comparing the predicted postures with the ones obtained in the experiment. We aim to minimize the error of the predicted posture. Subsequently, we verify our model and optimization method by predicting new postures and comparing them with empirical data. All the empirical data were obtained from the experiments performed by Dysart and Woldstad (23) and Gallagher et al. (29). In addition, the process of assigning weights and verifying the results was done by comparing the predicted postures with the ones obtained with 3D SSPPTM software (3D SSPPTM software predicts static strength requirements for tasks such as lifts, presses, pushes, and pulls). For each part, we present two sets of weights for predicting both stooped and squat postures.
All optimization problems were solved using a genetic algorithm. In all simulations, the position of the hand and the ankle joint is fixed. Hand positions are specified in terms of the horizontal and vertical distance from the ankle.
4.1. Validation with Previous Experiments
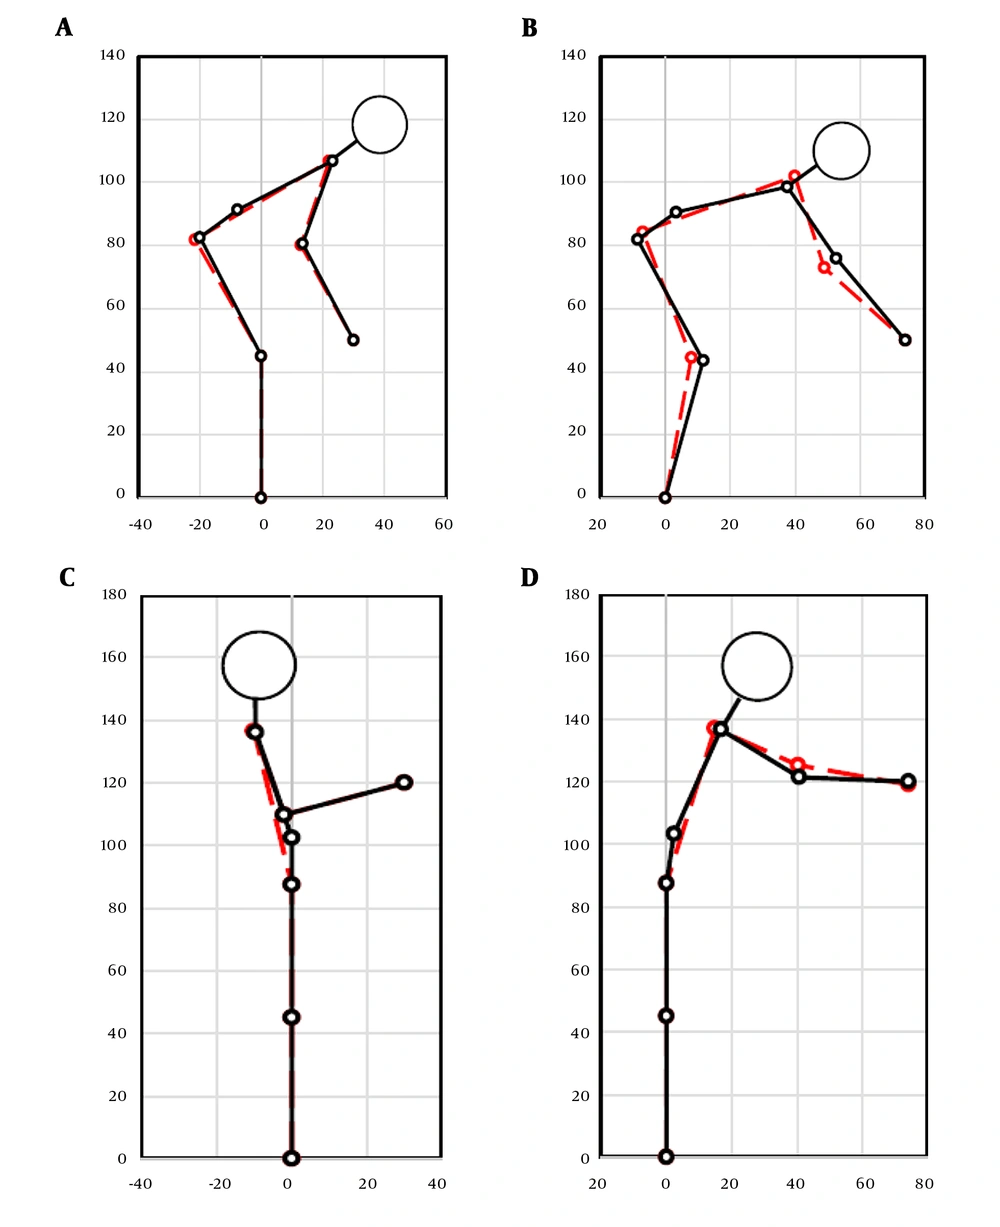
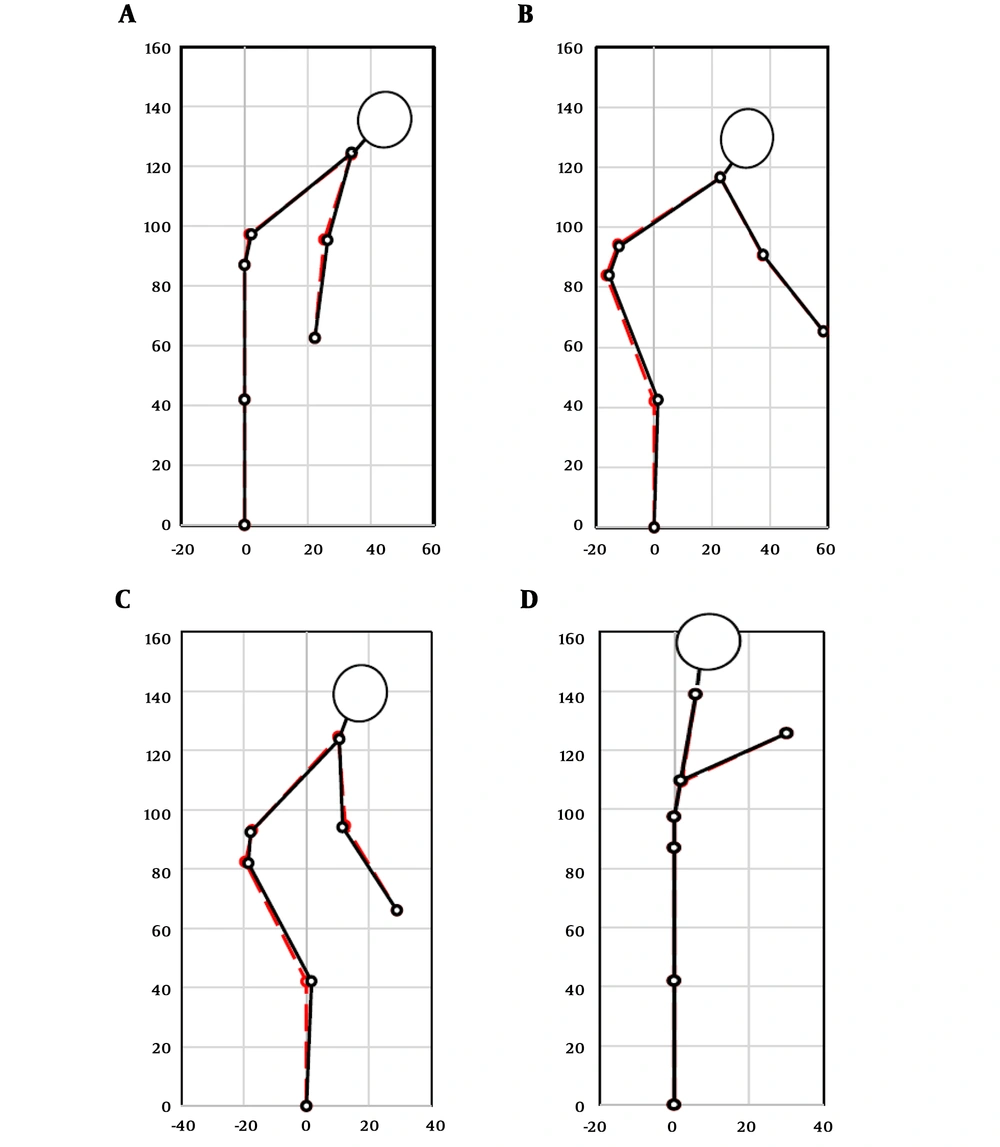
In Figure 3A, the predicted posture and the results obtained in the experiment are presented for the hand position of (30 cm, 50 cm), and lifting a weight of 4.6 kg. The weight value for each cost function is shown in Table 1, and by these weights, three other postures were predicted for the hand positions of (30 cm, 120 cm), (Max, 120 cm), (Max, 50 cm) in Figure 3. Max represents the maximum reach distance. As is visible in these figures, the upper arm and forearm angle were predicted with reasonable accuracy. The mean absolute error (MAE) of the posture prediction is also represented in Table 1 (top). The errors were calculated using the following equation.
Where fi is the prediction and yi is the true value.
A comparison between the observed postures ref and predicted postures for (A) hand position of (30 cm, 50 cm) (B) hand position of (Max, 50 cm) (C) hand position of (30 cm, 120 cm), (D) hand position of (Max, 120 cm). Black solid lines correspond to predicted postures; red dashed lines, to observed postures.
| Hand Positions (cm) | Posture Type | Mean Absolute Error (MAE) | Maximum Error (Emax) |
|---|---|---|---|
| w1 = 0.0124, w2 = 0.0125, w3 = 0.1264, w4 = 0.0322, w5 = 1.0021, w6 = 1.0125, w7 = 1.3426 | |||
| X = 30, Y = 50 | Stoop | 0.20% | 0.35% |
| X = Max, Y = 50 | Stoop | 2.25% | 2.35% |
| X = 30, Y = 120 | Stoop | 0.85% | 0.90% |
| w1 = 0.0083, w2 = 0.0013, w3 = 0.0412, w4 = 0.1245, w5 = 0.1234, w6 = 10, w7 = 10 | |||
| X = Max, Y = 120 | Stoop | 0.75% | 0.90% |
| X = 30, Y = 50 | Squat | 2.2% | 2.3% |
| X = Max, Y = 50 | Squat | 2% | 2.2% |
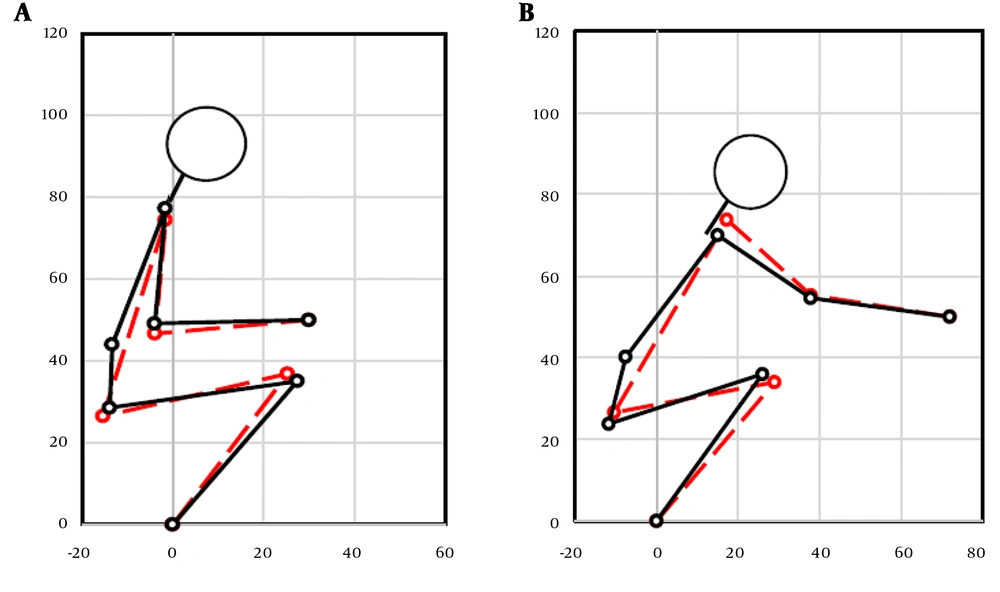
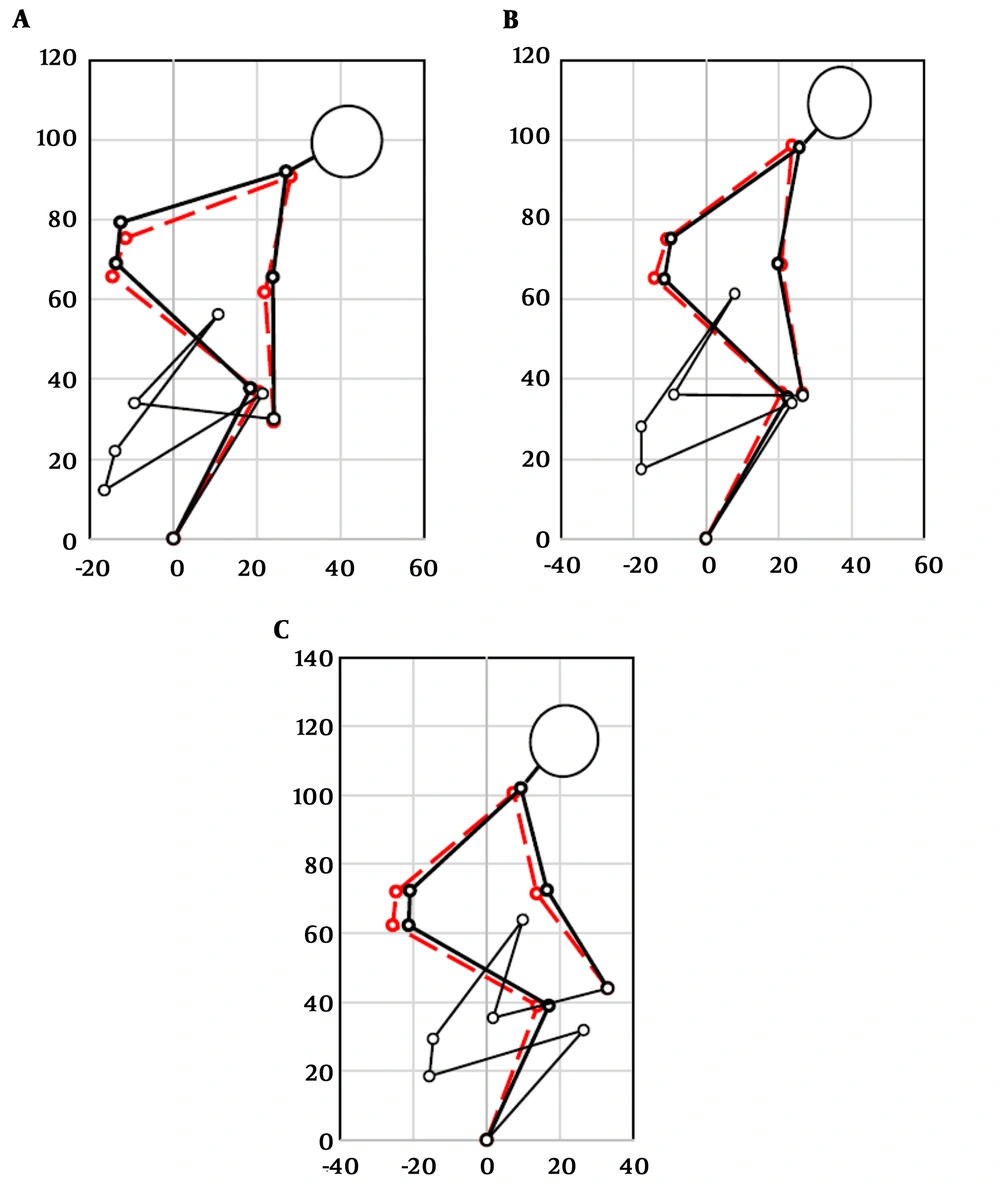
For low hand positions, postures can be separated into two different categories; stooped and squat postures. Figure 3A shows a stooped posture for the hand position (30 cm, 50 cm). However, a squat posture was observed in the experiment for this hand position (Figure 4A dashed line). Therefore, similar to the first part, we presented a new set of weights for each cost function to predict squat postures Table 1 (bottom). Squat postures obtained from human subjects and simulations have been represented in Figure 4. Errors have also been shown in Table 1.
4.2. Validation with 3D SSPPTM
To further validate our predicted postures for other populations and load positions, we have compared our simulations with the results obtained from 3D SSPPTM software for a range of percentiles from 50% male to 95% female in Tables 2-5. To increase the accuracy of our prediction method, for each population, a new set of weights is represented. The suggested weights are averaged over 50 cases and are applicable in case of various hand positions (10 cm < X < 80 cm, 10 cm < Y < 130 cm) and lifting loads (10 N to 40 N). In the case of 50% percentile male, predicted postures for four-hand positions have been illustrated in Figure 5. For low hand positions (Y < 45) squat postures are also presented along with the stooped type postures in Figure 6.
| Percentile | w1 | w2 | w3 | w4 | w5 | w6 | w7 | MAE (%) | Emax (%) |
|---|---|---|---|---|---|---|---|---|---|
| 50 | 0.0126 | 0.0122 | 0.1278 | 0.0322 | 1.0296 | 1.0095 | 1.3561 | 0.9036 | 0.9687 |
| 60 | 0.0127 | 0.0123 | 0.1303 | 0.0332 | 0.9929 | 0.9813 | 1.3578 | 0.8901 | 0.9552 |
| 70 | 0.0124 | 0.0127 | 0.1335 | 0.0342 | 0.9856 | 0.9465 | 1.3312 | 0.8604 | 0.9255 |
| 80 | 0.0130 | 0.0124 | 0.1339 | 0.0342 | 0.9599 | 0.9852 | 1.2831 | 0.6402 | 0.7053 |
| 90 | 0.0135 | 0.0131 | 0.1275 | 0.0350 | 0.9551 | 0.9750 | 1.3471 | 0.7601 | 0.8252 |
| Percentile | w1 | w2 | w3 | w4 | w5 | w6 | w7 | MAE (%) | Emax (%) |
|---|---|---|---|---|---|---|---|---|---|
| 50 | 0.0084 | 0.0013 | 0.0412 | 0.1268 | 0.1214 | 9.7596 | 10.1494 | 1.2444 | 1.8792 |
| 60 | 0.0086 | 0.0014 | 0.0416 | 0.1272 | 0.1247 | 10.1073 | 10.4616 | 1.4634 | 2.0982 |
| 70 | 0.0090 | 0.0014 | 0.0402 | 0.1229 | 0.1274 | 10.1203 | 10.3100 | 0.8318 | 1.4666 |
| 80 | 0.0088 | 0.0014 | 0.0399 | 0.1231 | 0.1288 | 9.8389 | 10.0890 | 1.7555 | 2.3903 |
| 90 | 0.0087 | 0.0014 | 0.0393 | 0.1273 | 0.1256 | 9.2793 | 10.0250 | 1.9566 | 2.5913 |
| Percentile | w1 | w2 | w3 | w4 | w5 | w6 | w7 | MAE (%) | Emax (%) |
|---|---|---|---|---|---|---|---|---|---|
| 50 | 0.0120 | 0.0127 | 0.1301 | 0.0318 | 0.9786 | 1.0143 | 1.3296 | 1.2208 | 1.3086 |
| 60 | 0.0116 | 0.0122 | 0.1346 | 0.0310 | 0.9624 | 1.0006 | 1.2749 | 0.5186 | 0.6063 |
| 70 | 0.0109 | 0.0117 | 0.1411 | 0.0303 | 1.0081 | 1.0203 | 1.3085 | 1.1747 | 1.2625 |
| 80 | 0.0104 | 0.0123 | 0.1455 | 0.0293 | 0.9960 | 1.0661 | 1.2465 | 0.9385 | 1.0262 |
| 90 | 0.0101 | 0.0122 | 0.1386 | 0.0289 | 0.9857 | 1.1296 | 1.3276 | 0.9378 | 1.0255 |
| Percentile | w1 | w2 | w3 | w4 | w5 | w6 | w7 | MAE (%) | Emax (%) |
|---|---|---|---|---|---|---|---|---|---|
| 50 | 0.0083 | 0.0012 | 0.0427 | 0.1208 | 0.1276 | 10.3937 | 10.3142 | 1.1770 | 1.7108 |
| 60 | 0.0082 | 0.0012 | 0.0407 | 0.1190 | 0.1306 | 10.4068 | 10.6025 | 1.0739 | 1.6077 |
| 70 | 0.0081 | 0.0012 | 0.0391 | 0.1126 | 0.1383 | 10.8482 | 10.4194 | 1.6844 | 2.2182 |
| 80 | 0.0083 | 0.0011 | 0.0386 | 0.1130 | 0.1355 | 10.9842 | 9.9971 | 1.0464 | 1.5801 |
| 90 | 0.0078 | 0.0012 | 0.0371 | 0.1082 | 0.1343 | 10.2961 | 9.8274 | 1.2985 | 1.8322 |
5. Discussion
As can be seen in Tables 1-5, different values for weights have been obtained for two categories of postures. The quantity of these weights determines whether the subject assumes a stoop or a squat type posture. The performance measures of delta-potential energy, shear force, and joint discomfort are more useful for predicting stoop type postures, while performance measures of compression/tension, angle sight, and head torque over neck are more applicable in predicting squat postures. Performance measures of total torque have approximately the same importance in the prediction of both categories of postures. There are also slight changes (1% to 4%) in the values of the weights for males and females with different average body sizes. Note that which posture the subject assumes depends on the range of movement of each joint, and such parameters are not the same for all populations. The MOO formulation used in this study is a generic model that can easily have been extended to a new model that considers other factors like the greatest stability or local effort.
5.1. Conclusion
We employed a three-dimensional model to evaluate the applicability of using a combination of seven performance measures for posture prediction of symmetric lifting tasks. Two cost functions of head torque over neck and sight angle were first introduced in this paper and appeared to be the essential part of the MOO method for predicting squat postures.

