


1. Background
Nowadays, the commercial fruit juices are widely consumed throughout the world and these products are an important part of the modern diet in many communities, therefore, their quality assessment is very important for consumer’s safety (1-3). Fruit juices are a tasty food, highly appreciated, and contain functional compounds such as carotenoids, vitamin C, minerals, various kinds of antioxidants and dietary fiber, and usually have exceptional nutritional qualities (3, 4). Despite the fact that these functional components are protective against degenerative and chronic diseases (e.g. cardiovascular diseases and cancer), commercial fruit juices can be a potential source of toxic heavy metals, some of them having an accumulative effect or leading to nutritional problems and adverse health effects by the interaction of juice components with transition metals or with sub-products of juice auto-oxidation. Therefore, the control of mineral composition in commercial fruit juice is necessary (1, 3-6).
Heavy metals can induce a variety middle-term and long-term affects in an exposed individual, including physiological, behavioral, and cognitive effects. Therefore, during the last few decades there has been a growing interest in assessment of heavy metal contents in foodstuffs with additional emphasis on the measurement of contamination contents in the food supply (7-9).
Aluminum (Al) as a non-essential metal and a neurotoxin agent is the third most abundant element in the Earth’s crust and has widespread throughout the environment especially in the food chain (10). Therefore, this element is a natural component of foodstuffs and also many manufactured materials. Aluminum can be toxic when injected directly into animals or accidentally to humans as in the case of dialysis. It has been shown that Alzheimer, dialysis encephalopathy, and bone disorder may result from accumulation of Al in brain, bones, and liver (11, 12). Also, osteomalacia, neurodegenerative disorders, and decreased renal function are known as the chronic effects of aluminum exposure (13, 14).
Copper (Cu) as an essential trace mineral, perform an important biochemical function in the human body and is necessary for maintaining health. The adult human body contains about 1.5 - 2.0 mg/kg of Cu, which is essential as a constituent of some metal enzymes and is required for the catalysis of metabolic oxidation and hemoglobin synthesis. Copper is found in a wide range of foodstuffs, including nuts, many fruits, and vegetables, red meat, shellfish, as well as in many vitamin supplements. Exposure to high amounts of Cu can lead to inflammation in the brain tissues, anorexia, fatigue, depression, premenstrual syndrome, migraines, anxiety, childhood hyperactivity, and learning disorders. Also, bone demineralization, depressed growth, liver cirrhosis, dermatitis and neurological disorders are the symptoms of Cu deficiency in humans (4, 15, 16).
The human health risk assessment requires identification, collection and integration of information on hazardous chemicals that their exposure to humans and also the relationship between exposure, dose and adverse health effects (17).
The presence of heavy metals in fruit juices has been documented in a number of studies worldwide (1-4, 18-21). In this regard, due to the proliferation of different brands of commercial fruit juices produced in Iran recently coupled with the lack of and/or little information available on the composition of heavy metal contamination and exposure of these products, this study was carried out for analysis and health risk assessment of Al and Cu in some of the most frequently consumed brands of commercial fruit juices marketed in Iran in 2015 to provide some baseline information for further research in this field.
2. Methods
2.1. Sample Collection and Analysis
In total, 48 commercially fruit juice samples of four different types (cherry, mango, orange, and pineapple) belonging to four famous brands were bought from different supermarkets in Hamedan city, all packaged in Tetra Pak boxes. After transporting the samples to the laboratory, the purchased fruit juice samples were kept in a refrigerator at 4°C (4).
For assayed the presence of Al and Cu, the juice samples (100 mL) were poured into quartz crucibles and evaporated to dry residue at 100°C, then ashed in a muffle furnace at 400°C. Ash was dissolved in 6 mL of HNO3 (65 %), 3 mL of HCl (35 %), and 0.25 mL of H2O2 on a hot plate and filled up in 50 mL volumetric flasks to the mark by the 1 molL-1 nitric acid (4, 19). Finally, the concentrations of Al and Cu determined using a VARIAN 710-ES model inductively coupled plasma optical emission spectrometry (VARIAN, Australia) with three replications.
2.2. Statistical Analysis
Data were statistically analyzed using one sample t-test to comparing the mean concentrations of Al and Cu with WHO maximum permissible limits (MPL) and also an ANOVA parametric test with a DMS post hoc and Duncan multiple range test for study of the variance homogeneity, using the SPSS statistical package version 19.
2.3. Assessment of Human Health Risks
For health risk assessment, estimated average daily intakes (EADIs) of a metal in food and food consumption assumption were used to survey long term health risks to consumers. For each type of exposure, the EADI was computed in accordance with Equation 1:
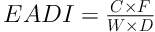
Where C is the concentration of metal in each commodity (mg/kg); F, D, and W are the mean annual intake of food per person and number of days in a year (365) and the mean body weight (70 kg for adult and 15 kg for children) respectively (22, 23).
The world health organization (WHO) has set values for toxicity, termed acceptable daily intakes (ADIs), for a large number of chemicals, including pesticides and toxic heavy metals (24). According to FAO/WHO Codex committee, the health risk indices (HI) were obtained by dividing the EADI by the ADI (mg/kg/day) in accordance with Equation 2 (22-24):

When the HI > 1; the food involved is considered a risk to the concerned consumers. While the HI < 1 means the food involved is considered as acceptable to the concerned consumers (22).
3. Results
The concentrations of Al and Cu in the analyzed fruit juices are presented in Table 1. Data in Table 1 indicates that the contents of Al in samples with an average of 1.24 ± 0.36 mg/L were relatively higher than the MPL (0.2 mg/L) (25). The highest content of Al was found in cherry (3.30 mg/L) and the lowest in mango (0.10 mg/L). Vice versa the Al, the Cu contents of samples with an average of 0.04 ± 0.02 mg/L were lower than the MPL (2.0 mg/L) (19, 26).
| Metal | Juice Sample | Mean Concentration, ± SD | |||
|---|---|---|---|---|---|
| Cherry | Mango | Orange | Pineapple | ||
| Brand 1 (n = 3 for each juice sample) | |||||
| Al | 3.30 ± 0.40 | 1.10 ± 0.09 | 1.10 ± 0.13 | 1.50 ± 0.22 | 1.75 ± 1.05 |
| Cu | 0.20 ± 0.06 | 0.03 ± 0.00 | 0.03 ± 0.01 | 0.02 ± 0.00 | 0.07 ± 0.09 |
| Brand 2 (n = 3 for each juice sample) | |||||
| Al | 1.10 ± 0.23 | 1.10 ± 0.10 | 1.20 ± 0.37 | 1.10 ± 0.09 | 1.12 ± 0.05 |
| Cu | 0.01 ± 0.00 | 0.11 ± 0.04 | 0.002 ± 0.00 | 0.02 ± 0.01 | 0.03 ± 0.05 |
| Brand 3 (n = 3 for each juice sample) | |||||
| Al | 1.01 ± 0.26 | 0.10 ± 0.04 | 1.20 ± 0.40 | 1.40 ± 0.19 | 0.93 ± 0.57 |
| Cu | 0.02 ± 0.01 | 0.01 ± 0.01 | 0.04 ± 0.05 | 0.02 ± 0.01 | 0.02 ± 0.01 |
| Brand 4 (n = 3 for each juice sample) | |||||
| Al | 1.30 ± 0.25 | 1.10 ± 0.31 | 1.01 ± 0.29 | 1.20 ± 0.42 | 1.15 ± 0.12 |
| Cu | 0.03 ± 0.01 | 0.01 ± 0.02 | 0.01 ± 0.00 | 0.03 ± 0.02 | 0.02 ± 0.01 |
Based on the results of One-way ANOVA test, no significant differences (P > 0.05) were found between the different fruit juice samples from the point of view of Al and Cu contents.
The systemic health risk assessment associated with heavy metals encountered in fruit juices are summarized in Table 2. Based on the results the EADIs calculated ranged between 1.72 × 10⁻⁵ to 2.49 × 10⁻³ mg/kg/day, while the hazard indices (HI) ranged from 4.30 × 10⁻⁴ to 1.25 × 10⁻¹ for the analyzed metals and indicating no direct hazard to human health, in spite of their presence in the food.
| Metal | ADI (11, 24) | EADI (Children) | HI (Children) | EADI (Adult) | HI (Adult) |
|---|---|---|---|---|---|
| Al | 0.02 | 2.49 × 10⁻³ | 1.25 × 10⁻¹ | 5.34 × 10⁻⁴ | 2.70 × 10⁻² |
| Cu | 0.04 | 8.04 × 10⁻⁵ | 2.01 × 10⁻³ | 1.72 × 10⁻⁵ | 4.30 × 10⁻⁴ |
4. Discussion
It has been shown that natural or anthropogenic activities, such as use of contaminated water, raw materials, industrial emissions, agricultural practices (e.g., application of metal-containing pesticides, chemical and organic fertilizers and irrigation with wastewater), car exhausts, or contamination during manufacture, can lead to contamination of foodstuffs by toxic heavy metals (27).
Contamination of food may result from harvesting, transportation, storage, processing, preparation, and marketing (28). In this regard, human exposure to toxic heavy metals through consumption of contaminated foods is to be responsible for many human health problems (29).
Due to the fact that fruit juices are widely consumed and may be they contain a large amount of hazardous compounds, strict control of toxic heavy metals in these products is advisable. Therefore, the current study was carried out for access data about the concentrations of Al and Cu in commercial fruit juices (cherry, orange, mango, and pineapple) marketed in Iran.
As the literature shows, unprocessed foods showed Al concentrations normally lower than 10 mg/kg, however, this metal is used extensively in the food industry (30). Based on the results of this study the Al was detected in amounts ranging from 1.01 mg/L to 3.30 mg/L in cherry juice, ranged from 0.10 mg/L to 1.10 mg/L in mango juice, ranged from 1.01 mg/L to 1.20 mg/L in orange juice, and also ranged from 1.10 mg/L to 1.50 mg/L in pineapple juice. Therefore, the levels of Al in samples were found upper than the WHO maximum permissible limits. In this regard, studies have shown that in food and beverages of plant origin such as fruit juices the levels of Al in soil is an important factor contributing to total Al content in plant tissues (31). In addition, it is well known that Al accumulation in plants is a problem when they are grown in acid soils (32). Also, the quality of aluminum packaging may influence substantially the levels of this element in beverages during processing and preservation. On the other hand, several factors such as temperature, pH, acid substances, and Cl- presence affect on Al leaching (13). It is reported that Al is leached more effectively by acid substances such as orange juice, and food additives presence such as tartaric and citric acids than by neutral substances (30). Szymczycha-Madeja and Welna (2013) analysis of Al in some fruit juices were purchased from Poland and reported that Al mean concentration (mg/L) in orange and pineapple juices were 0.03 ± 0.004 and 0.09 ± 0.007, respectively (32). Velimirovic et al. (2013), reported that the concentration of Al in some commercial fruit juices available in Serbia ranged from 38.83 mg/L to 91.01 mg/L in clear fruit juices and 5.328 mg/L to 47.32 mg/L in cloudy fruit juices (33).
Copper is a mineral, which is important to healthy hormone secretion, nerve conduction, and the growth of connective tissue and bones (4). Based on the results of this study the concentration ranges for Cu were: cherry juice (0.01 - 0.20 mg/L), mango juice (0.01 - 0.11 mg/L), orange juice (0.002 - 0.04 mg/L), and pineapple juice (0.02 - 0.03 mg/L). Therefore, the levels of Cu in samples were found lower than the MPL.
Researchers have determined Cu concentrations in different kinds of fruits juices from different countries in the world. Tormen et al. (2011), determined a mean Cu concentration of 0.15 mg/L in peach juice samples collected from Brazilian markets (3). Szymczycha-Madeja and Welna (2013) analysis of Cu in some fruit juices reported that mean concentration (mg/L) of Cu in orange and pineapple juices were 0.20 ± 0.007 and 0.21 ± 0.003, respectively (32). Harmankaya et al. (2012), analysis of Cu content in some commercial fruit juices marketed in Turkey and reported the mean concentration of this metal is 0.22 ± 0.10 mg/L (34). Acar (2011) reported that the Cu concentration of peach juice sampled from different market basket in Ankara, Turkey was 5.87 mg/L (35). Onianwa et al. (1999), determined a mean Cu concentration of 0.52 ± 0.60 mg/L in some fruit juice samples were obtained from Nigerian markets (20). Krejpcio et al. (2005), reported Cu level as 0.047 - 1.840 mg/L in a total of 66 fruit juice samples examined in Poland (19).
4.1. Conclusions
This study was carried out to investigate the levels and health risk assessment of Al and Cu in some brands of commercial fruit juices marketed in Iran in 2015. The results showed that the Cu contents in fruit juices samples with an average of 0.04 ± 0.05 mg/L were found to be lower than the prescribed limit. Also, based on the results, no direct hazard to human health observed through consuming of commercial fruit juices, in spite of Al and Cu presence in the food. Meanwhile, since the contents of Al in fruit juice samples with an average of 1.24 ± 0.36 mg/L were relatively higher than the MPL, control of metal-containing pesticides and chemical fertilizers residues in agricultural products and also prohibition of use the package containing a layer of aluminum in production process of the commercial fruit juice is recommended for food safety.
