


1. Background
Diabetes mellitus is a metabolic disease, that appears as a result of reduced insulin production or insufficient insulin action in the metabolism of glucose (1). This disease causes long-term problems such as cardiovascular disease, neuropathy, retinopathy, and nephropathy (2). According to the latest studies, there is a unique relationship between diabetes and Alzheimer’s disease (AD), thus, AD may be affected by increased blood glucose levels. It has also been proven that individuals with diabetes are most likely to extend AD than healthy people (3). AD is a neurodegenerative anomaly in which there are many biological disorders. In AD, two important kinds of disorders have been detected and examined extensively: The amyloid plaques and the neurofibrillary tangles (NFTs) (4).
Tau proteins perform a prominent role in maintaining the structure of microtubules and the proper function of neurons; however, if phosphate molecules connect to them, they separate from the microtubules and eventually break down the tubules. Tau molecules then accumulate together and form NFTs (5, 6). The hippocampus is a portion of the brain that has a great role in memory and learning and emotional processes (7).
According to the previous studies, neurodegeneration, due to AD, is more common among diabetic patients than healthy individuals. Besides, since this relationship has been discovered in recent years, limited research has been done in this context, especially in the field of exercise in preventing the onset of AD in diabetic patients. While more research has been done on AD alone, limited research has been done on whether patients with diabetes are at a risk of neurodegeneration and subsequently AD after diabetes. Considering the contradictory views on the occurrence time of neurodegeneration in people with diabetes (8, 9), as well as the limited research on the effect of exercise on neurodegeneration in the hippocampus of diabetic patients, it was attempted to investigate hyperphosphorylated tau protein (HTP) levels in male Wistar rats 4, 8, and 12 weeks after inducing diabetes, and continuous aerobic exercise (CAE) to observe when levels of HTP increase.
2. Objectives
The present study aimed to find out whether the amounts of HTP increase 4, 8, and 12 weeks after inducing diabetes in rats; also, whether or not 4, 8, and 12 weeks of continuous aerobic exercise (CAE) will decrease the amount of HTP in diabetic rats.
3. Methods
3.1. Animals and Treatment
A total of 84 male Wistar rats (weight: 281 ± 28 g; age: 24 weeks old) from Ilam University of Medical Sciences Center were maintained in Animal lab at Azad University, Ilam Branch, and used in the present experiment. Rats were kept in an environment with a temperature of 21 ± 2°C, 12 h/12 h cycle of darkness and light, and humidity of about 60 ± 5%.
3.2. Induction of Diabetes
In this study, rats were diabetic with nicotine amide and streptozotocin (stz) (10). First, nicotine amide (95 mg per kg body weight dissolved in saline solution) was injected intraperitoneally. After 15 minutes, 55 mg/kg of streptozotocin dissolved in 0.5 mL of citrate buffer solution was injected intraperitoneally. Five days later, blood glucose levels were measured in fasting blood samples of rats, and the blood glucose level of 126 - 400 mg/dL indicated that they were diabetic (11).
3.3. Experimental Design
In this study, 84 rats were randomly divided into 4 groups (21 rats in each group). Considering that at the end of 4th, 8th, and 12th weeks of training, seven subjects of each group were operated at each stage, thus, 21 subjects were selected for each group. The exercise protocol comprised of 12 weeks and three sessions a week, with the intensity and duration of the exercise being determined by the principle of overloading. In short, the speed of the exercise program began at 12 m/min in the first week. From the second week, the training speed increased weekly by 1 m/min. The training period from the 2nd-10th weeks increased on a regular basis for two minutes and 20 seconds each session. The duration of activity from 15 minutes on the first day of the first week reached 80 minutes in the tenth week. In this stage, the intensity of activity was determined by the speed, that is, the duration of activity from 15 minutes on the first day reached 80 minutes at the beginning of the 11th week and then remained at that value (12).
3.4. Statistical Analyses
The dependent variable was analyzed by One-way analysis of variance (ANOVA) and repeated measures analysis of variance. Significance level was determined at P ≤ 0.05.
4. Results
After executing the exercise protocol (Figure 1) the results showed that there was no significant difference in baseline weight in all three different time periods (4, 8, and 12 weeks) (P = 0.428, P = 0.584, P = 0.406, respectively). However, the weight of the subjects was significantly different after 4, 8, and 12 weeks of exercise training (P = 0.001) (Table 1).
| Variables | SCG | TCG | SDG | TDG | P Value |
|---|---|---|---|---|---|
| 4 Weeks | |||||
| Weight, g | |||||
| Baseline | 281.2 ± 39.7 | 269.2 ± 34 | 284.1 ± 24.5 | 261.1 ± 14 | 0.428 |
| After 4 weeks | 285.2 ± 37.4 | 279.2 ± 34 | 218.1 ± 21.5 | 241.1 ± 30.6 | 0.001 |
| Fasting glucose, mg/dL | |||||
| Baseline | 88.2 ± 9.9 | 93.4± 3.8 | 368.8 ± 19.9 | 369.2 ± 44.5 | 0.001 |
| After 4 weeks | 86.1 ± 9.6 | 84.8 ± 5.8 | 350.1 ± 101.9 | 205.2 ± 112.8 | 0.001 |
| 8 Weeks | |||||
| Weight, g | |||||
| Baseline | 286.7± 25.1 | 281.7± 14.3 | 288 ± 15.8 | 275.4 ±17.1 | 0.584 |
| After 8 weeks | 292.4 ± 22.2 | 299.8 ± 17.2 | 213.2 ± 45.7 | 251.4 ± 29.4 | 0.001 |
| Fasting glucose, mg/dL | |||||
| Baseline | 89.5 ± 5.6 | 87.7 ± 4.4 | 363.2 ± 52.5 | 362 ± 51.94 | 0.001 |
| After 8 weeks | 90.5 ± 6 | 73.2 ± 10.3 | 419.4 ± 97.6 | 212.4 ± 98.7 | 0.001 |
| 12 Weeks | |||||
| Weight, g | |||||
| Baseline | 300 ± 1.4 | 283.2 ± 10 | 288.4 ± 20.1 | 278.7 ± 40 | 0.406 |
| After 12 weeks | 300.8± 16.9 | 316.8 ± 14.4 | 212.2± 45.3 | 294.5± 42.4 | 0.001 |
| Fasting glucose, mg/dL | |||||
| Baseline | 92.1 ± 8.9 | 93.2 ± 5.7 | 331.5 ± 62 | 333.2 ± 54.2 | 0.001 |
| After 12 weeks | 91.8 ± 7.5 | 79.8 ± 8.7 | 452.1 ± 118.8 | 93.4 ± 15.1 | 0.001 |
Abbreviations: SCG, sedentary control group; SDG, sedentary diabetic group; TCG, trained control group; TDG, trained diabetic group.

A summary of the tasks. Abbreviations: DG, division of groups; DI, diabetes induction; WM, weight measurement; FBGM, fasting blood glucose measurement; HTPM, hyperphosphorylated tau protein measurement; Before, before exercise training programs; After, after each phase.
The subjects had a significant difference in fasting glucose (both in baseline glucose and after three different training period time) (P = 0.001) (Table 1). The results of ANOVA test showed that there was no significant difference in the factor of HTP during four weeks of exercise training (P = 0.408), however, there was a significant difference between the 8th and 12th weeks of exercise training (P = 0.001) (Table 2). The results of Bonferroni’s post hoc test are indicated in Table 3.
| Time, wk | SCG | TCG | SDG | TDG | P Value |
|---|---|---|---|---|---|
| 4 | 26.3 ± 3.8 | 19.3 ± 1.6 | 23.1 ± 2.1 | 22.1 ± 5.1 | 0.408 |
| 8 | 28.8 ± 3.2 | 20.7 ± 2.7 | 38.8 ± 4.7 | 24.6 ± 8.8 | 0.001 |
| 12 | 30.4 ± 3.3 | 17.3 ± 3.3 | 46.3 ± 4.3 | 18.9 ± 5.1 | 0.001 |
Abbreviations: SCG, sedentary control group; SDG, sedentary diabetic group; TCG, trained control group; TDG, trained diabetic group.
| (I) Time, wk | (J) Time, wk | Mean Difference (I - J) | Standard Error | P Value |
|---|---|---|---|---|
| 4 | ||||
| 8 | -6.8* | 0.7 | 0.000 | |
| 12 | -9.6* | 0.65 | 0.000 | |
| 8 | ||||
| 4 | 6.8* | 0.73 | 0.000 | |
| 12 | -2.8 | 0.78 | 0.004 | |
| 12 | ||||
| 4 | 9.6* | 0.65 | 0.000 | |
| 8 | 2.8* | 0.78 | 0.004 |
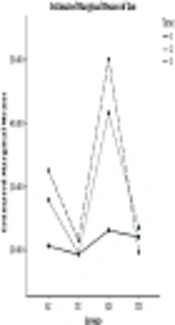
In 4, 8, and 12 weeks, the rate of HTP in SC and SD groups were more than the ST and TD groups, and the longer the time passes (from 4 weeks to 8 and then 12 weeks), the rate of HTP increased, CAE decreased the level of HTP (Figure 2).
 in all groups")
The levels of hyperphosphorylated tau protein (HTP) in all groups
Standard error bar showed in all three time (Figure 3).

Standard error bar in all three time
5. Discussion
Findings of the study indicated a significant change in the HTP after 4, 8, and 12 weeks of training, so that the more time passed from induction of diabetes (from 4 weeks to 8 weeks and then 12 weeks), the rate of HTP was increased, and CAE decreased the level of this variable. Some studies also provided similar results (12-18) and some studies have contradictory results (9, 19).
Liu et al. showed that the level and the activation of PI3K/Akt signaling pathway in their anterior cortex was greatly reduced and a large amount of glycogen synthase kinase 3 beta (GSK-3β) was phosphorylated and a great deal of abnormal HTP was seen. It is amazing that the decrease of this signal pathway was much more in people suffering from both diabetes and AD (20). One of the mechanisms that causes HTP in diabetic patients is reduced glucose metabolism in the brain due to Glut1/3 deficiency (21). GSK-3β is one of the major causes of abnormal tau hypertension in the brain of patients with degeneration (22).
Abnormal GSK-3β contributes to various diseases, including mental disorders, brain strokes, traumatic head injuries, and in particular, type 2 diabetes (23). Initially, GSK-3 function was only phosphorylation of glycogen synthase (GS) and eventually deactivating it, however, recently, many research results have indicated that GSK-3 could phosphorylate the tau protein as well (24, 25). Hyper-activation of GSK-3β increases the unusual HTP and enhances the progression of the disease in people with AD (26). GSK-3β has a key role in pathological alterations of tau protein in AD (27). Past research suggests that the PI3K/Akt/GSK-3β signaling pathway has an important impress on neuro preservation and strengthens cellular life by stimulating cell duplicate and interdict apoptosis (28, 29). However, inaccurate performance of this signaling pathway will raise GSK-3β action and as a result, HTP happens.
In some studies, by transferring GSK-3β to the rat marrow, it indicates that GSK-3β induced neurodegeneration (30, 31). Therefore, HTP is accompanied with the PI3K/AKT/GSK-3β signaling pathway, and excessive prevention of GSK-3β can reduce HTP and ultimately reduces the progression of AD (32). It has been confirmed that GSK-3β has a prominent role in diabetes mellitus (33, 34).
Kim et al. showed that mediocre practice can interdict the expression of GSK-3β in diabetic rats by interdicting HTP in the hippocampus (12).
GSK-3β is a kinase in the transmission of insulin signal and tau phosphorylation that plays a main double role in the creating and exacerbation of insulin resistance, therefore, we assume that GSK -3β is a link between diabetes and AD (26).
GSK-3β phosphorylated tau protein and over activation (GSK-3β) stimulate abnormal phosphorylation of tau and cause the accumulation of NFTs in AD (35, 36).
PI3K/Akt pathway inhibits GSK-3β, resulting in the survival of cellular life (37). Reverse PI3K/Akt pathway rejection restores GSK-3β activity, resulting in cell death. The PI3K/AKT signaling pathway is a classic anti-apoptotic pathway that regulates the transmission of the survival signal. PI3K/Akt pathway activity plays a supportive role in many conditions of neuropathy (38).
In general, the PI3K/Akt signaling pathway activity decreases through time in the brain of diabetic rats and the expression of GSK-3β increases, which itself causes HTP as a symptom of AD, and exercise training can upregulate the PI3K/AKT signaling pathway and activate GSK-3β (39).
5.1. Conclusion
It can be concluded that over time diabetic patients are at risk of increased AD than healthy people, and they can prevent AD with CAE.
