1. Background
Nowadays, there is an increasing demand to monitor heavy metal ions such as lead and cadmium due to their serious environmental impact (1). The World Health Organization (WHO) has set action levels for lead and cadmium in domestic water at 3 and 10 ppb, respectively (2). Therefore, it is highly important to develop sensitive and rapid monitoring techniques for detection of Pb (II) and Cd (II) in water samples. So far, different analytical protocols have been developed for sensing heavy metals such as flame atomic absorption spectrometry (FAAS) (3), graphite furnace atomic absorptions spectrometry (GF-AAS) (4), inductively coupled plasma optical emission spectrometry (ICP-OES) (5), inductively coupled plasma mass spectrometry (ICP-MS) (6) and fluorescence spectrometry (7). However, these methods require high implementation and maintenance costs as compared to different electrochemical methods for sensing Pb (II) and Cd (II) (8-10). The performance of electrochemical sensors depends on electrode modifiers (11). Among various modifiers, carbon nanostructures such as graphene (Gr) and carbon nanotube (CNT) have been employed for fabrication of electrochemical sensors in heavy metals (12, 13). However, application of Gr and CNT based modifiers is unfavorable from the economic point of view (14).
Sepiolite is a fibrous clay mineral with a unit cell formula of Si12Mg8O30(OH)4(OH2)4·8H2O (15). This clay material has lower cost compared to other commercial nanostructures and can be mined from the corresponding deposit as a raw mineral. However, sepiolite is not effective for electrochemical sensing applications due to its non-conductive property. Incorporation of carbon into clay material can be an effective way to improve the conductivity of natural clay materials (16). Moreover, surface modification of carbon substrate with organic ligands has been recognized as a potential strategy to improve the selectivity of modifiers in electroanalytical detection of heavy metals (17, 18).
2. Objectives
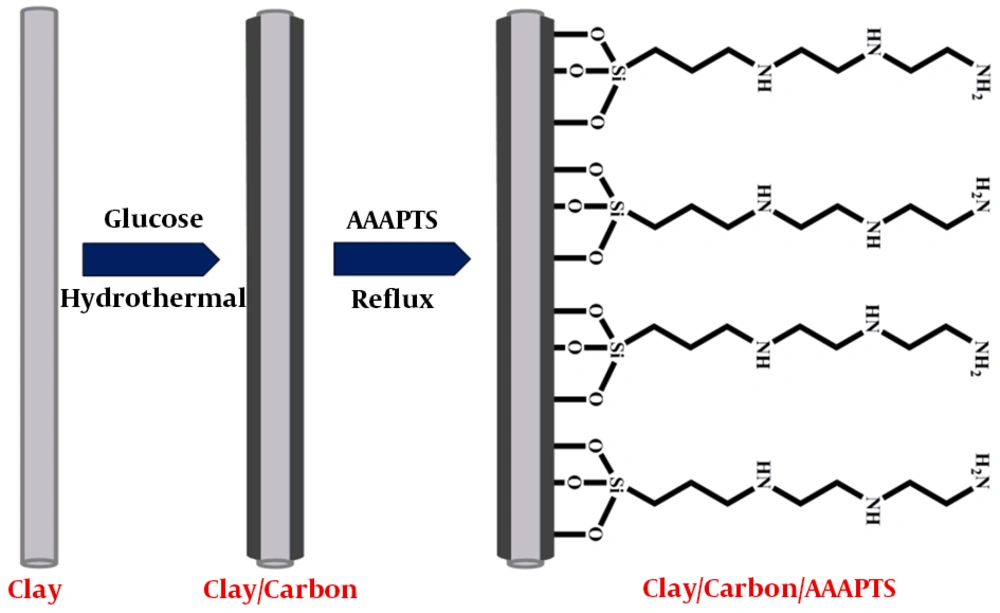
In this paper, clay/carbon nanocomposite was designed and used as substrate for preparation of a new electrode modifier. To improve the selectivity of the modifier, the prepared clay/carbon nanocomposite was modified with 3-[2-(2-aminoethylamino)ethylamino]propyl-trime thoxysilane (AAAPTS), as shown in Figure 1. The electrochemical properties of the clay-based modifier were investigated in detail. The prepared sensor showed remarkable sensitivity and good selectivity toward detection of Pb (II) and Cd (II) in water samples.
3. Methods
3.1. Materials and Apparatus
Sepiolite was obtained from a sepiolite mine (Fariman, Iran) with a particle size of ≤ 0.075 mm. Glucose, AAAPTS, graphite powder and silicon oil were obtained from Merck. Cd (II) and Pb (II) standard solutions (1000 ppm) were prepared by dissolving desired amounts of Cd(NO3)2·4H2O and Pb(NO3)2·4H2O (both from Merck), respectively, in deionized water. All other reagents were of analytical grade and were supplied from Merck. The supporting electrolyte employed in this work was acetate buffer (HAc-NaAc, 0.1 M), which was prepared throughout mixing solutions of acetic acid and sodium acetate.
All electrochemical data were acquired using a Metrohm computrace electroanalyzer Model 757 VA (Herisau, Switzerland). FT-IR spectra were recorded in the range of 400-4000 cm-1 on a PerkinElmer Spectrum 2000 FT-IR spectrometer (Norwalk, CT, USA) using the standard KBr disk method. Scanning electron microscopy (SEM) and the energy-dispersive X-ray (EDX) spectroscopy analysis were performed on a CARL ZEISS-AURIGA 60 microscope (Jena, Germany). The XRD pattern was recorded via a PANalytical Empyrean X-ray diffractometer (Almelo, Netherlands).
3.2. Preparation of Modifier
Clay/carbon nanocomposite was prepared by the hydrothermal method. For this purpose, 0.5 g of clay material was dispersed in 75 mL of deionized water by sonication. Then, 3.5 g of glucose was added and dissolved in the above suspension. The mixture was transferred into a Teflon-lined autoclave (100 mL capacity) and heated at 180ºC for 6 h. The obtained brown precipitate was first washed with distilled water and then dried at 70ºC for 24 h. In the next step, the product was heated at 650ºC for 3 h under N2 condition to improve the degree of carbonization.
The modification of clay/carbon nanocomposite with AAAPTS ligand was carried out by a simple reflux method. Briefly, 0.5 g of clay/carbon nanocomposite was suspended in 50 mL of toluene and then 3 mL of AAAPTS was added to the suspension. The mixture was refluxed at 75ºC overnight. The prepared product, as the modifier, was separated and repeatedly washed with toluene and ethanol. Finally, the resulting clay/carbon/AAAPTS nanocomposite was dried at room temperature.
3.3. Electrode Fabrication
The modified CPE was fabricated according to the literature methods (19, 20). Briefly, appropriate amounts of graphite powder (57.5% - 70% w/w), clay/carbon/AAAPTS nanocomposite (0% - 12.5% w/w) and silicone oil (30% w/w) were mixed using a mortar and pestle. Then, a portion of the achieved paste was packed into a Teflon tube (with a 2 mm inner diameter and a 10 cm length) in contact with a copper wire for electrical connection. The external surface of the prepared electrode was polished and smoothed on a paper surface before each electrochemical test.
4. Results
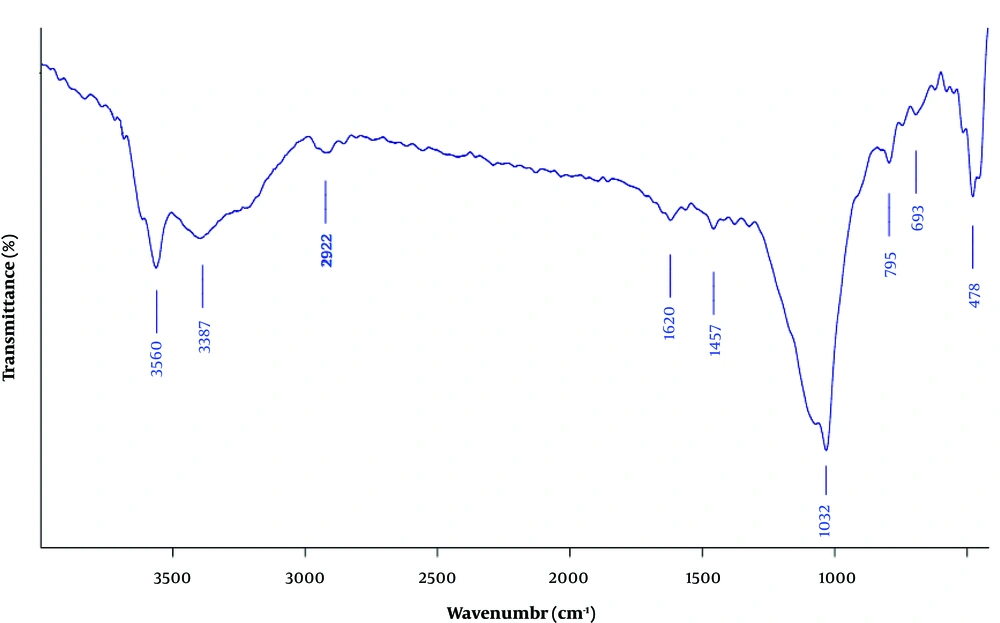
The FT-IR spectrum of the clay/carbon/AAAPTS nanocomposite is shown in Figure 2. The characteristic peak around 1032 cm-1 was attributed to the plane vibrations of Si-O-Si groups (21). The bands at 3560 and 1620 cm-1 were related to the stretching and bending vibrations of zeolitic water, respectively (22). Moreover, the band at 693 cm-1 was assigned to the bending vibration of Mg-O groups (23), and the band at 1467 cm-1 was ascribed to the stretching of C-N stretching bonds (24). The absorption band around 2922 cm-1 was due to the C-H stretching vibration of ethylene groups in AAAPTS (25).
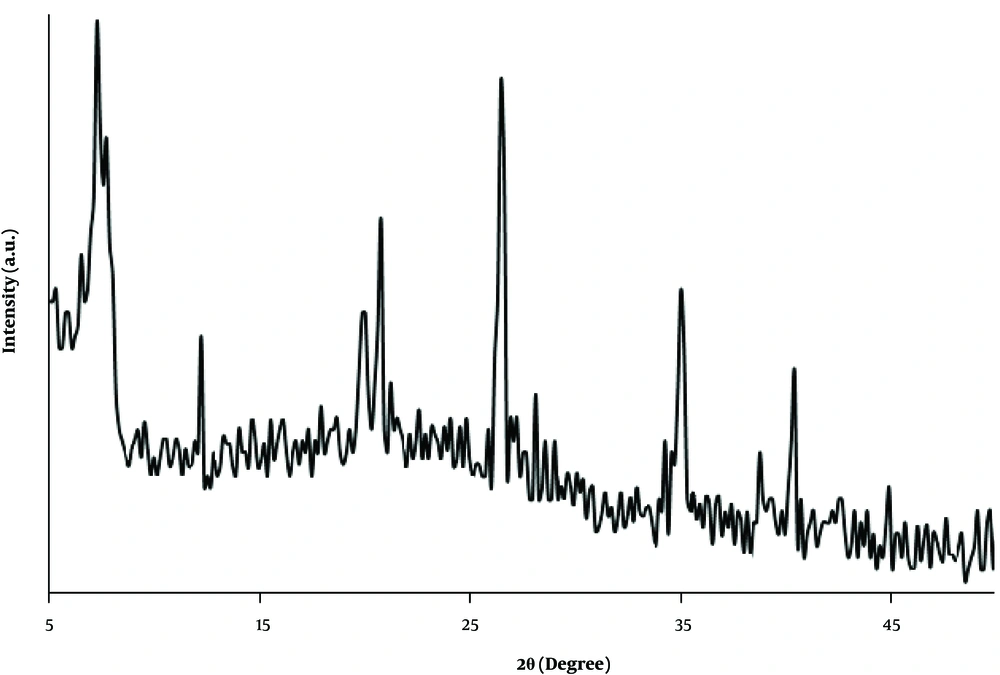
The crystalline structure of the prepared nanocomposite was studied by XRD analysis. As shown in Figure 3, the diffraction peaks at 2θ = 7.3º (110), 12.2º (130), 19.9° (060), 20.7º (131), 26.5º (080), 35.1º (441) and 40.2º (541) corresponded to the standard pattern of sepiolite (JCPDS card No. 13-0595) (26). Moreover, no obvious peak was observed for carbon in the prepared nanocomposite. This may be due to the amorphous structure of the carbon deposited on the clay material.
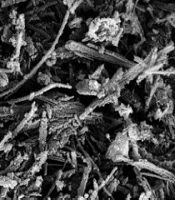
The SEM image of the clay/carbon/AAAPTS nanocomposite is illustrated in Figure 4. The clay material obviously had a fibrous structure. In addition, the EDX spectrum revealed the presence of carbon, nitrogen, oxygen, magnesium and silicon in the prepared nanocomposite. Based on the above results, it can be concluded that the clay/carbon/AAAPTS nanocomposite is successfully synthesized.
5. Discussion
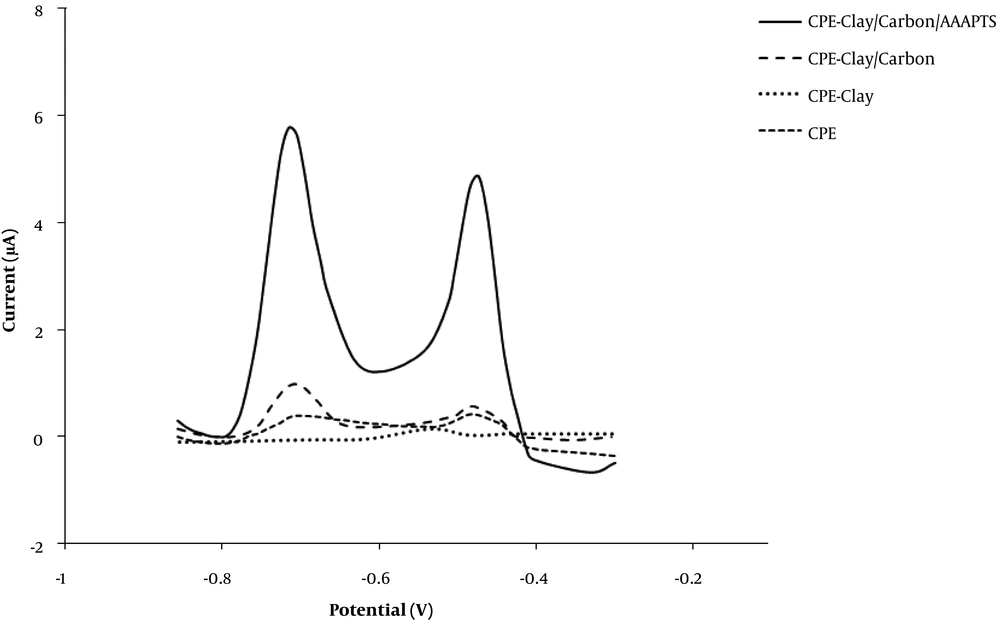
The DPASV responses of different electrodes including bare CPE, CPE-clay, CPE-clay/carbon and CPE-clay/carbon/AAAPTS in buffer solution (pH = 4) containing 25 ppb of Pb (II) and 25 ppb of Cd (II) are shown in Figure 5. As can be observed, the highest sensitivity was obtained at CPE-clay/carbon/AAAPTS. Therefore, the modified electrode was applied in the present study for simultaneous measurement of Pb (II) and Cd (II).
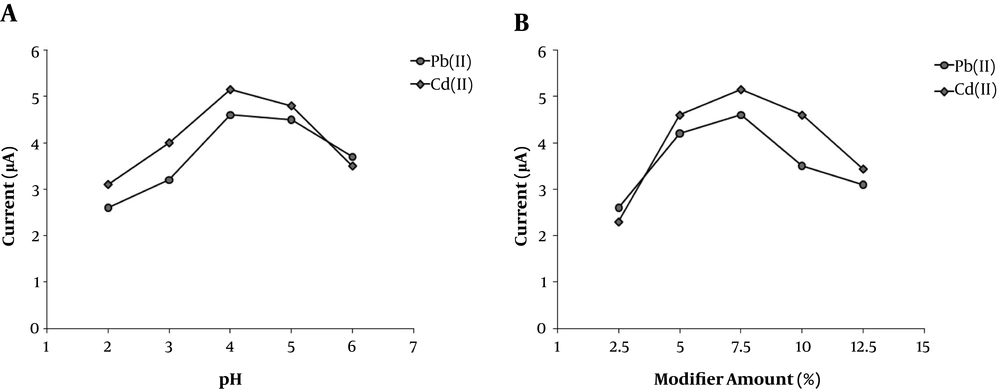
To improve the sensitivity of CPE-clay/carbon/AAAPTS toward detection of Pb (II) and Cd (II), some important experimental factors such as solution pH and modifier amount were examined and optimized. The influence of buffer pH (2.0 - 6.0) on the DPASV responses of CPE-clay/carbon/AAAPTS is demonstrated in Figure A6. As observed, the peak currents first increased with increasing the pH value up to 4 and then decreased at higher pH values. Thus, an optimum pH of 4.0 was selected in the next electrochemical experiments.
Further, the effect of the clay/carbon/AAAPTS amount was investigated on the response of the modified electrode. As shown in Figure 6B, the peak responses first increased with the amount of modifier in the carbon paste up to 7.5% (mass/mass) and then decreased at higher modifier content. By taking into account these results, a carbon-paste composition of 7.5% clay/carbon/AAAPTS, 62.5% graphite powder and 30% (mass/mass) silicon oil was employed for construction of the chemically modified electrode.
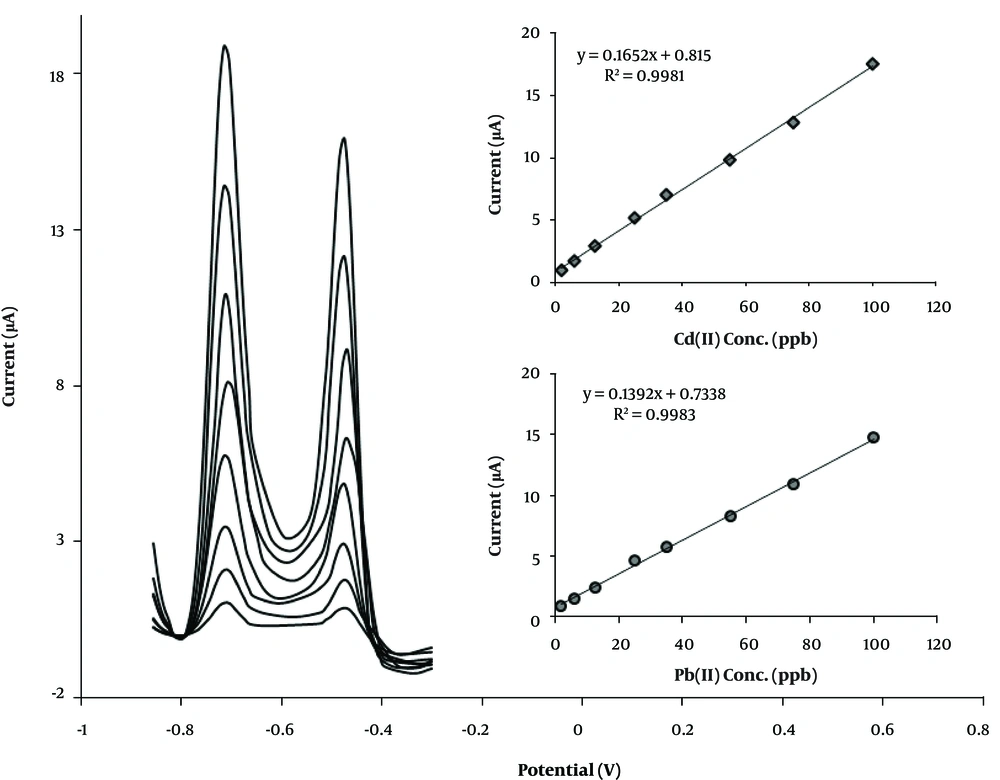
The calibration plot of CPE-clay/carbon/AAAPTS for Pb (II) and Cd (II) under optimum conditions is presented in Figure 7. The linear concentration range of 2.0 - 100.0 ppb for the both ions was achieved via CPE-clay/carbon/AAAPTS. The detection limit of the present sensor was found to be 1.1 ppb and 0.7 ppb for Pb (II) and Cd (II), respectively. The detection limit of the proposed sensor was also compared with those of some previously reported sensors (27-31) for analysis of Pb (II) and Cd (II) (Table 1). As can be observed, the detection limit of the prepared sensor was lower than the limits of other reported techniques. Moreover, the present procedure showed good reproducibility with a relative standard deviation (RSD) values of 4.5% for Cd (II) and 3.8% for Pb (II) at seven individually prepared electrodes in a solution containing 25 ppb of each ion.
Abbreviations: CPE, carbon paste electrode; GCE, glassy carbon electrode; GECE, graphite-epoxy composite electrode; SPE, screen-printed electrode
The selectivity of the method was also investigated. According to the experimental results, the analysis of Pb (II) and Cd (II) (at the concentration of 25 ppb) was not affected by a 20-fold excess of Ni (II), Co (II), and Mn (II); 10-fold excess of Hg (II) and Zn (II); and 5-fold excess of Cu (II). Accordingly, CPE-clay/carbon/AAAPTS can be applicable for selective detection of Pb (II) and Cd (II) in real samples.
The application of CPE-clay/carbon/AAAPTS was investigated for simultaneous determination of Pb (II) and Cd (II) in tap water, dam water and wastewater samples. The standard addition method was applied in the recovery tests, and the acquired results are reported in Table 2. Typical stripping voltammograms of CPE-clay/carbon/AAAPTS as well as different concentrations of metal ions in tap water samples are shown in Appendix 1 in Supplementary File. It is evident that the suggested electrochemical sensor is capable of determining the concentration of the both analyte ions in real water samples without any significant interferences and matrix problems. To verify the method accuracy, this procedure was applied for determination of Cd (II) and Pb (II) in a synthetic sample. The analytical results are presented in Appendix 2 in Supplementary File. As can be observed, the obtained results were in good agreement with the reference values and there was no significant differences between the results and the accepted values.
| Sample | Metal Ion | Added (ppb) | Found (ppb) | Recovery (%) + RSD |
|---|---|---|---|---|
| 1 (Tap water, Gorgan, Iran) | Pb (II) | 0 | - | - |
| 10.0 | 9.7 | 97.0 ± 3.4 | ||
| 20.0 | 20.5 | 102.5 ± 2.1 | ||
| Cd (II) | 0 | - | - | |
| 10.0 | 10.3 | 103.0 ± 2.8 | ||
| 20.0 | 19.6 | 98.0 ± 2.3 | ||
| 2 (Urban wastewater, Gorgan, Iran) | Pb (II) | 0 | 6.2 | - |
| 10.0 | 16.4 | 102.0 ± 4.3 | ||
| 20.0 | 25.9 | 98.5 ± 5.4 | ||
| Cd (II) | 0 | 4.3 | - | |
| 10.0 | 14.8 | 105.0 ± 4.0 | ||
| 20.0 | 24.6 | 101.5 ± 4.8 | ||
| 3 (Toshan Dam, Gorgan, Iran) | Pb (II) | 0 | - | - |
| 10.0 | 10.1 | 101.0 ± 3.8 | ||
| 20.0 | 19.7 | 98.5 ± 4.1 | ||
| Cd (II) | 0 | - | - | |
| 10.0 | 9.8 | 98.0 ± 4.6 | ||
| 20.0 | 20.4 | 102.0 ± 3.9 |
5.1. Conclusions
In this study, a novel electrochemical sensor was introduced for sensitive analysis of cadmium and lead ions in water resources. Due to the good synergistic integration of the materials in the clay/carbon/AAAPTS modifier, the sensor showed high sensitivity and good selectivity for analysis of analyte ions. Under the optimum conditions, the detection limit of the proposed sensor was 1.1 ppb and 0.7 ppb for Pb (II) and Cd (II), respectively, well below the WHO guideline. In addition, the electrochemical method indicated good selectivity for measuring analyte ions in presence of some common interfering species. Finally, the sensor was utilized as a powerful tool for quantification of Pb (II) and Cd (II) in real water samples.
