


1. Background
Cancer is one of the leading causes of mortality in industrialized and advanced societies, with breast cancer being the most common malignancy in women worldwide and accounting for about one-third of all female cancers. Breast cancer is the second most common cancer after lung cancer, which is increasing in Iranian women (1). Elimination of malignant cells using the effect of ionizing radiation on living tissue is one of the most effective methods in the treatment of cancerous tumors (2). Among different medical applications, radiation therapy has the highest level of radiation exposure. Therefore, the use of such radiation levels without consideration, along with the undeniable role of radiation therapy, can have painful clinical outcomes. National and international organizations such as the International Atomic Energy Agency (IAEA), International Commission on Radiation Units and Measurements (ICRU), and American Association of Physicists in Medicine (AAPM) have put forward strategies to prevent possible events and to achieve desired therapeutic outcomes, including modifying structures, setting limits for uncertainties, and quality control programs (3-5). In radiation therapy, the goal is to transfer the maximum dose to the tumor so that healthy tissues around the dose receive the minimum dose (6, 7). According to the World Protocol, only ± 5% of treatment uncertainties are allowed, indicating the need to carefully monitor the dose and control it to improve the quality of treatment. The only viable way to ensure the accuracy of treatment and control the actual dose delivered to the patient is an in vivo dosimetry that empirically checks the correct dose delivered to the patient during treatment and if any discrepancies are found, it can be resolved before treatment is continued (3, 8-10). Various detectors such as a diode, thermoluminescence dosimeter (TLD), MOSFET, film dosimeter, as well as electronic portal imaging systems are used for in vivo dosimetry (8, 11-14). Diode properties such as immediate response, high sensitivity to radiation, high mechanical strength, small and simple, robust and independent of air pressure and availability in medical centers make them a more suitable choice for in vivo dosimetry (12, 13, 15-17).
2. Objectives
This study aims at performing in vivo dosimetry, using diode semiconductor detectors in the treatment of patients with breast cancer in the Radiotherapy Department of Imam Hossein Hospital in Tehran to determine the amount of error at the end of each treatment session. For this purpose, the entrance dose, exit dose, and middle dose of the breast and supraclavicular (SC) area of 33 patients with breast cancer under radiation therapy were measured and compared with calculations.
3. Methods
In this experimental study, for measurement of dose, two semiconductor detectors with T60010MP serial number for 5 – 13 MV photons and two semiconductor detectors with T60010HP serial number for 13 – 25 MV photons were employed. These semiconductor detectors are of p-type silicon, which is connected to a PTW-MUTIDOS T10004 multichannel electrometer simultaneously by an accessories diode ceiling mount system. In addition, a 0.6cc Farmer ionization chamber made by PTW-Freiburg TM30010 model with PTW-UNIDOS T10001 electrometer was used as a reference detector to determine calibration factors and correction factors. Also, the RWS slab phantom with dimensions of 30 × 30 cm2 in the thickness of 1, 2, 5, and 10 mm T40006 model made by the PTW factory was used to determine the calibration and correction factors. The accelerator used was the American-made Varian linear accelerator 2300C/D model. Also, in this regard, VivoSoft software (PTW-Freiburg, Gmbh) was used to obtain calibration factors and correction coefficients and doses of entrance and exit points of patients in vivo, as well as Monte Carlo simulation algorithm to determine the midline dose of patients by transfer method. To convert the read number from the diode in the electrometer to the absorption dose and also to perform a high-precision in vivo dosimetry, the calibration of the diodes was done. Diode calibration was performed in two steps:
The first step was calibration under reference conditions to determine the calibration factors of detectors and the second step was the calibration to obtain the correction factors when the measurement conditions were different from the reference conditions.
In the measurements to avoid the shadow effect, the entrance diode was placed 2 cm away from the central axis of radiation on the phantom surface (18). The reproducibility of the diode was tested after calibration and the variation responses were less than 0.5%. The temperature dependency was not considered because of (a) small differences between the calibration temperature and measurement temperature, (b) layer of epoxy resin beneath the diodes that delays the transfer of body heat to the diode over a 2 to 3 minute period of measurement, and (c) small temperature dependency for the diode that was used in this study (about 0.1% per°C).
3.1. Determination of the Calibration Factors Fentrance and Fexit
The in vivo semiconductor probes were placed on the surface of the slab phantoms by the calibration adapter "S" so that the thickness of the slab phantoms and the thickness of the adapter in the position of the probe was a total of 15 cm. The Farmer ionization chamber was placed in the central axis beam in the maximum depth dose; this depth is 1.5 cm for the 6 MV photon beam and 3.3 cm for the 18 MV photon beam. The radiation conditions close to the treatment conditions were set to field sizes 10 × 10 cm2 and SSD = 100 cm. The head of the Linac was placed at a zero-degree angle, in which the central axis of radiation was perpendicular to the phantom surface. The entrance diodes and ionization chamber were, then, irradiated once by a 6 MV photon beam and again by an 18 MV photon beam for a given time. The calibration factor for each energy was, then, determined separately as the ratio of the absorption dose measured by the ionization chamber at the maximum depth dose to the semiconductor signal in reference conditions.
For exit conditions, only the head of the Linac was rotated 180 degrees to radiate from the bottom of the phantom. In this case, only the source surface distance (SSD) setting from the bottom to the phantom level was set to 100 cm. The calibration factor for each energy was, then, calculated separately.
The detector entrance and exit dose calibration factors, Fen, and Fex are given by (19-23):
Where Den and Dex are measured by the ion chamber, and Men and Mex are responses of the entrance and exit semiconductor detectors. For this purpose, dosimetry protocol IAEA TRS-398 for determination of dose by ion chamber and VivoSoft software for assigning dose to diodes were used. In Figure 1A, the diode system and Linac that was used in this study were illustrated and in Figure 1B, setup for determination of the calibration factor for entrance point by ion chamber was shown.

A, Illustration of diode system and Linac for in vivo dosimetry; B, Setup for determination of the calibration factor for entrance point by ion chamber
3.2. Determination of Correction Factors
Correction factors are required when the measurement conditions are different from the reference conditions. In this study, correction factors were determined for SSD, field sizes, and radiant angles.
Slab phantoms were used to determine these correction factors. The diodes were placed at the surface of the phantom and the ion chamber was placed at the maximum depth dose. To determine the SSD correction factor, with a 10 × 10 cm2 field size at SSDs of 85, 90, 95, 100, and 105 cm, the ionization chamber and the diode were irradiated simultaneously for a certain monitor unit (MU). The reference SSD was 100 cm. Also, to determine the field size correction factor, the ionization chamber and diodes were irradiated simultaneously for a given MU by changing the field size (5 × 5, 8 × 8, 10 × 10, 12 × 12, 15 × 15, 18 × 18, 20 × 20 cm2) at a constant SSD (100 cm). The reference field size was 10 × 10 cm2. The SSD and field size correction factors were determined by Equation 3 (16, 18, 23, 24):
Where
Slab phantoms were used to determine the angle correction factor. The diodes were placed at the surface of the phantom. In addition to the radiation angle, the radiation conditions were adjusted to the reference conditions. The change in diode response with different radiation angles was determined for angles 0, 30, 60, 330, 300 degrees. In this case, at a constant time, the reading rate of the diode was obtained with different radiation angles. The angle correction factors are determined as (23, 25):
Where R(θ) is the diode reading for different angles and R(
3.3. Entrance and Exit Dose Measurement
Before irradiation, diode detectors were placed on the patient's skin, in the central axis of the radiation, at the entrance and exit of the beam. To avoid the shadow effect, the entrance diode 2 cm away from the center of the radiation field, and the exit diode in the center of the radiation field was glued to the skin with anti-allergy glue. After irradiation, the readings of the diodes were read online. Measured entrance dose and exit doses by the diode were calculated, using the following equations (6, 19, 20, 26-28):
Where Men and Mex are the amounts of entrance and exit diode reading, Fen, and Fex are the entrance and exit calibration factor,
3.4. Middle Dose Estimation
The best way to determine the amount of dose at the midpoint is to place the dosimeter directly inside the body at the target point. In most cases, it is not possible to place the dosimeter inside the body. For this purpose, various methods have been proposed to determine the amount of dose at the midpoint. In this study, the transfer method and the arithmetic mean method have been used. The middle of the line between the input and output points was considered the midpoint.
In the arithmetic mean method, the middle point dose (Dmidline) is estimated from the average dose of the entrance and exit points obtained by in vivo dosimeter (21, 29, 30).
In the transfer method, the simulation algorithm was used, using the Monte Carlo code. For this purpose, a homogeneous cubic water phantom with dimensions of 15 × 30 × 30 cm3 was designed in the algorithm. The head of the accelerator was considered at a zero degree angle and the field size was 10 × 10 cm2 and SSD = 90 cm. The codes were performed once for the 6 MV photon beam and once for the 18MV photon beam. Then, doses for the 6 MV photon beam were calculated at a depth of 1.5 cm (maximum depth dose) from the entrance level, at the midpoint of the phantom. Also, doses for 18 MV photon beam were calculated at a depth of 3.3 cm from the input surface (maximum depth dose), at the midpoint of the phantom. After measuring the entrance (Den), exit (Dex), and middle doses (Dmid) of a phantom, the coefficients of intermediate transfer rate (Tmid) were calculated as follows (21):
Thus, with the entrance dose (Den) measured by the diode and by the use of the intermediate transfer rate (Tmid), the middle dose was obtained from the following equations (31-33):
3.5. Data Analysis
To evaluate the purpose of this study that is an investigation of agreement between the given dose and the treatment planning system calculations, the calculated dose of the entrance, exit, and middle points (Dcal) from the treatment planning system was extracted and compared with the measured values (Dmeas) in the same points. The treatment planning system was Isogray (Dosisoft Company) and dose calculation was done by collapsed cone convolution (CCC) algorithm.
The analysis of results was done, using Equation 9 based on the percentage deviation of the measured dose from the calculated dose. The SPSS (ver.16, Chicago IL, USA) software was used for statistical analysis. For a value of P ≤ 0.05, the difference was assumed to be statistically significant. For this purpose, the K-S method was used to investigate the normal distribution of data and to check the significance of the measured dose deviation from the calculated dose, the paired-sample t test, and Wilcoxon methods were used.
4. Results
4.1. Calibration Factors of Diode Detectors
Calibration of diodes was performed to determine the absorption dose at the input and output points of the phantom. The values of input and output calibration factors are given in Table 1.
| Semiconductor Detectors | Color and Energy Range | Entrance Calibration Factor (mGy/nC) | Exit Calibration Factor (mGy/nC) |
|---|---|---|---|
| T60010MP- 4 | Yellow, 5 – 13 MV | 5.327 × 10⁶ | - |
| T60010MP- 5 | Yellow, 5 – 13 MV | - | 5.725 × 10⁶ |
| T60010HP- 8 | Red, 13 – 25 MV | 3.374 × 10⁶ | - |
| T60010HP- 9 | Red, 13 – 25 MV | - | 4.359 × 10⁶ |
Results of Calibration Factors for Different Diode Detectors
4.2. Field Size Correction Factor
The variations of field size correction factor for entrance and exit points as a function of field size for diode detectors T60010MP-4 model and T60010HP-8 model at the entrance point for 6 MV and 18 MV photon beams and for diode detector T60010MP-5 model and T60010HP-9 model in the exit points for 6 MV and 18 MV photon beams are shown in Figure 2. These field size correction factors are normalized to the value of 10 × 10 cm2 field size for each diode model.

Field size correction factor for entrance and exit diode types for 6 MV and 18 MV photon beams
4.3. SSD Correction Factors
The variations of SSD correction factor for entrance and exit points as a function of SSD for diode detector T60010MP-4 model and T60010HP-8 model at the entrance point for 6 MV and 18 MV photon beams and diode detector T60010MP-5 model and T60010HP-9 model in the exit points for 6 MV and 18 MV photon beams are shown in Figure 3. These SSD correction factors are normalized to the value of 100 cm SSD for each diode model.

SSD correction factor for entrance and exit diode types for 6MV and 18MV photon beams
4.4. Angle Correction Factor
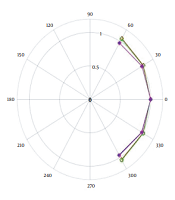
The changes of the angle correction factor for different angles (from 60 to 300 degrees) for diode detector T60010MP-4 model and T60010HP-5 model for 6 MV photon beam and diode detector T60010MP-8 model and T60010HP-9 model for 18 MV photon beam are displayed in Figure 4. The values are normalized to zero degrees as the reference condition.

Angle correction factor for different diode detectors
4.5. Comparison of Measured Dose and Calculated Dose
The percentage of deviation of the measured dose from the calculated dose for the entrance and exit points of the breast and SC region is shown in Table 2.
| Average Deviation (%) | Standard Deviation (%) | Error Greater than ± 5 (%) | |
|---|---|---|---|
| Entrance dose of tangent fields | 0.47 | ± 3.1 | 13.63 |
| Exit dose of tangent fields | 0.62 | ± 3.82 | 25.75 |
| Midpoint dose of breast (transfer method) | 0.48 | ± 4.7 | 39.39 |
| Midpoint dose of the breast (arithmetic mean method) | -0.51 | ± 2.12 | 3.03 |
| Entrance dose of SC fields | 0.56 | ± 2.58 | 10.81 |
| Exit dose of SC fields | -0.51 | ± 3.84 | 21.26 |
| Midpoint dose of SC (transfer method) | -0.61 | ± 4.34 | 25.81 |
| Midpoint dose of SC (arithmetic mean method) | -3.54 | ± 2.82 | 35.45 |
Deviation of Measured Dose from a Calculated Dose as a Percentage for Entrance, Exit, and Midpoint Dose
The differences between measured dose and calculated dose based on the transfer method showed a normal distribution with an average of 0.48% and standard deviation of ± 4.7% for breast area as shown in Figure 5 and average of -0.61% and standard deviation of ± 4.39% for SC area as shown in Figure 6.

Percentage deviation of estimated middle dose from calculated dose based on transfer method for the breast region

Percentage deviation of estimated middle dose from calculated dose based on transfer method for SC region
Also, the differences between measured dose and calculated dose based on the arithmetic mean method showed a normal distribution with an average of 0.51% and standard deviation of ± 2.12% for breast area as shown in Figure 7 and average of -3.54% and standard deviation of ± 2.83% for SC area as shown in Figure 8.

Percentage deviation of estimated middle dose from calculated dose based on the arithmetic mean method for the breast region

Percentage deviation of estimated middle dose from calculated dose based on the arithmetic mean method for SC region
5. Discussion
Regarding the effect of field size on the entrance and exit points as shown in Figure 2, by increasing the field, the correction factor for the entrance and exit points for photon 6MV and 18MV increases at first and reaches an almost constant value from field size 12 × 12 cm2 onwards. The entrance diode located on the phantom surface is slightly affected by the scattered of the phantom to determine the correction factor, while it is completely dependent on the scattered from the linac head. Considering the relationship (3), the change in the correction factor with the field size is due to the different sensitivity of the diode and the ionization chamber to the scattered photons and average energy. Since the response of the diode depends on the radiant energy but the response of the ionization chamber is almost energy-independent, if the dimensions of the field increase, the energy spectrum increases, and the scatter photons inside the linac head are added to the beam. As a result, the average energy of the beam decreases, and the response of the diode differs from the ion chamber. For the field size correction factor at the exit point by increasing the field size, in addition to the scattered beam, the scattered beam from the phantom increased and this effect is more valuable. These results are in good agreement with Yaparpalvi et al. (34) that reported confirmation of dose for breast cancer with diode, Huang et al. (35) that reported characteristics of the diode for clinical use, and Rodríguez et al. that reported Isorad diodes on patients of pelvic cancer (18).
Changing the response of diodes with radiant angles, the maximum change of the measured ratios for diodes is about 4%. The response of the diode to the radiant angle was investigated by Yaparpalvi et al. and the result for the diode was about 2% for angles greater than 60 and about 1.5% for angles less than 60. The reason for the differences could be due to the directional dependence of the diodes on the shape and structure of the diode (34).
The results of the one-sample Kolmogorov-Smirnov test showed that the diagram of the percentage of relative deviation for the measured input, output, and middle doses from the calculated dose for the breast area (P = 0.2) and the SC area (P = 0.2) has a normal distribution.
5.1. Measuring the Dose at the Entrance Point
The results of the paired-sample t test showed no significant difference between the measured and calculated input dose of the breast area (P = 0.32), but there was a significant difference for the SC area (P = 0.032). The relative difference greater than ± 5% can be seen in 13.63% of the breast entrance dose and 10.81% of the SC entrance dose. In radiation therapy of breast cancer with the SAD technique, some errors can happen such as an error in patient positioning setup or adjusting treatment parameters. Histogram analysis of the input dose showed that the mean error and standard deviation is 0.47% (± 3.1%) for the breast area and 0.56% (± 2.58%) for the SC area. The results indicate that the error in the breast area at the entry point is greater and wider than in the SC area. This can be due to the curvature of the breast tissue, as well as the instability of the breast tissue, which can lead to errors in SSD adjustment and patient positioning. The errors observed in the supraclavicular region can be due to the placement of the bed and breast board in the path of radiation entering the body in the posterior field and defective TPS in applying the appropriate absorption coefficient. Also, the errors can be due to the diode not being in the proper position at the point of entry of the posterior field due to not seeing the optical field. Also, in the SAD breast treatment technique, the SSD is first fixed to the anterior field and, then, the gantry is rotated for posterior irradiation without changing the SSD, thus increasing the contour error in the posterior field for the entry point. Besides, in the fields of the supraclavicular area, due to the shielding of the humerus bone in patients and the use of trays to hold the shield, these trays have different absorption coefficients, which are all considered with the same absorption coefficient in the treatment planning system and this can cause errors in measuring entrance dose.
In 1998, Voordeckers et al. performed in vivo dosimetry on the entrances of various patients and reported a relative deviation for patients with breast cancer more than other patients, which was consistent with the results of this project (36). Also, in 2012, Vasile et al. achieved a relative deviation with a mean and standard deviation of -0.6% (± 2.208%) during in vivo dosimetry with diodes at the entrance points of patients undergoing breast cancer treatment with 6MV and 25MV photons and reported that most of these errors probably due to SSD differences and the detector being in the wrong position (37). In general, measuring the input dosage by the in vivo dosimetry method is useful for detecting errors in checking and confirming the system such as patient setup and beam parameters, output and operation of the machine, as well as data transmission that should be corrected for the next session before treatment. Errors greater than 10% can be due to the patient's movement (voluntary or involuntary) and the lack of proper diode installation.
5.2. Measuring the Dose at the Exit Point
The results of the paired-sample t test showed no significant difference between the measured and calculated output dose of the breast area (P = 0.067) and the SC area (P = 0.565). The relative difference greater than ± 5% can be seen in 25.75% of the breast exit dose and 21.62% of the SC exit dose. Histogram analysis of the output dose showed that the mean error and standard deviation is 0.62% (± 3.82%) for the breast area and -0.51% (± 3.84%) for the SC area. The error at the exit point of the breast area can be due to the curvature of the breast tissue, which results in an error in adjusting the SSD and adjusting the patient's position, which affects the output point dose. The errors observed in the supraclavicular region can be due to the placement of the diode in the wrong position at the point of the output of the anterior field, placement of the bed and breast board in the beam path at the point of the output of the posterior field, and passing the beam through the tray used to protect the head of the humerus in the anterior field. Also, in the SAD breast treatment technique, the SSD is first fixed to the anterior field and, then, the gantry is rotated for posterior irradiation without changing the SSD, thus increasing the contour error in the posterior field for the output point.
In general, measuring the output dose by the in vivo dosimeter method can be useful for detecting errors related to the patient's contour, changing the patient's thickness, which may be due to swelling, contraction, or tissue analysis. It is also possible to obtain information about the amount of heterogeneity in the path of the beam, although the impact of heterogeneity is largely taken into account in the new TPS systems, it cannot be said that the effect of heterogeneity is completely considered because this effect varies from one computational algorithm to another. According to the results obtained in all fields and patients, the extent of deviation of the outlet from the input is greater than the calculated dose, which can be because the non-uniformity, curvature, and density of the tissue have less effect on the input point, while beam after passing through the breast tissue, undergoes more changes due to non-uniformity, curvature, the density of the breast tissue and the diameter of the transient tissue, and as a result, it deviates more than the calculated dose. This is consistent with the results of Strojnik since the wider spread of exit dose deviations (SD 3.3%) was reported in comparison to the entrance dose deviations (SD 2.1%) in patients with rectal cancers (38).
5.3. Estimating the Dose at the Middle Point
The results of the paired-sample t test showed no significant difference between the measured and calculated middle dose based on the transfer method for the breast area (P = 0.439) and the SC area (P = 0.436). In 1996, Yaparpalvi et al. (34) used the transfer rate algorithm to calculate the midpoint dose of patients with breast cancer and concluded that the midline dose corresponded to the expected dose for all patients. Rodríguez et al. (18) used the same algorithm to calculate the midpoint dose of pelvic patients and did not report a significant difference between the measured and calculated values.
The results of the paired-sample t test showed no significant difference between the measured and calculated middle dose based on the arithmetic method for the breast area (P = 0.159), but there was a significant difference for the SC area (P = 0.001). It seems that the arithmetic means algorithm for the breast region can be a suitable substitute for the transfer rate method in estimating the midpoint dose. The appropriateness of the arithmetic means algorithm for determining the midpoint dose for the breast region is recommended in a study conducted by Allahverdi and Vaezzadeh in 2010 (32).
Considering that there is no significant difference between the calculated and measured midpoint dose in the breast region in both methods, the result of this study can be reported with more certainty. However in the supraclavicular region, because the results of the two methods are not the same, there may be differences that can be due to the placement of the bed and breast board in the path of radiation entering the body in the posterior fields and tray plate for the anterior fields, which TPS is defective in applying the appropriate absorption coefficient.
Comparison of the standard deviation between the input, output, and center point histograms shows the highest bandwidth at the output point and the next level the midpoint, and the lowest bandwidth at the input point. The reasons for this discrepancy, as previously explained, could be due to differences in the thickness of the heterogeneities, the contour error, and the curvature. Also, the amount of dose decreases with the passage of the tissue, and the relative errors are apparent more in small amounts. This is consistent with the findings of Rodríguez et al. and Yaparpalvi et al. (18, 34).
5.4. Conclusions
In vivo dosimetry, as part of quality control, can be useful for examining and evaluating all the therapeutic chains of a radiotherapy department, and the errors that are far from the eye and the errors that occur in the treatment can be detected. Errors seen at the end of treatment can be caused by systematic or accidental errors and occur from various sources, including errors in calibration and correction factors, patient adjustment, equipment and devices, patient contouring, data transmission, computational algorithms, device output, patient movement, and individual errors were noted. Of course, errors need to be evaluated in separate fields as well, because the total error may be within the allowable range, but errors in a separate field may be too permissible to be considered. Errors from separate fields may compensate for each other and mislead our total error.
The results of this study show that in the breast area, despite the errors mentioned above, the dose delivered to the breast tumor is not significantly different from the expected dose. In the supraclavicular region, there was no significant difference between the delivered dose and the expected dose according to the transfer method, but there was a significant difference according to the arithmetic mean method; it seems that the cause of the error may be larger and a significant error may occur. Therefore, to reduce these errors based on the results of this study, it is recommended due to the absorption in the immobilization devices and the treatment bed, in the techniques that the radiation field passes through these devices, their effect on the given dose should be considered. Also for shielded fields, each center must use the trays by the same absorption coefficient.
