1. Background
The mammalian cell cycle is a highly ordered process and is divided into discrete phases including G1 the phase (gap 1), DNA synthesis phase (S phase), G2 phase, and mitosis phase (M phase). In this cycle, genetic information is transmitted from one cell to the next. The cycle is derived by the cyclin-dependent kinases (Cdks) and their regulatory subunit, cyclin, together, which propel the cell cycle through the various phases of the cell cycle (1). The transition between each phase is controlled by the kinase activity composed of cyclins and their partner, Cdk. Cyclins have fluctuated levels during the cell cycle. In contrast, the level of Cdk proteins typically remains unchanged throughout the cycle (2).
Cyclin-dependent kinase inhibitors (CKIs) are the negative regulator of cell cycle progression, which inhibit cyclin-cdk complexes, resulting in cell cycle arrest (3). Two families of CKIs have been identified: CIP/KIP and INK4 families. The first family members comprise p21CIP1 (p21), p27KIP1 (p27), and p57KIP2 (p57) (4). The INK4a/ARF includes 3 important tumor suppressor genes (TSGs): p14ARF (p14), p15INK4b (p15), and p16INK4a (p16) (5). The post-translational modifications of cell cycle include phosphorylation, histone acetylation, DNA methylation, ADP-ribosylation, and ubiquitination (6).
Aberrant DNA methylation is known as an important epigenetic change occurring in cancer. The silencing of the INK4a/ARF (7) and CIP/KIP (8) families by methylation plays an important role in several cancers. The hypermethylation of INK4a/ARF has been reported in breast cancer (9), Mantle cell lymphoma (MCL) (10), colorectal cancer (11), colon cancer (12), and gastric cancer (13). Similarly, the hypermethylation of the CIP/KIP family has been shown in the lung, gastric, and colon cancer (14). In mammals, cytosine methylation is achieved by 3 DNA methyltransferases (DNMT's) comprising DNMT1, DNMT3A, and DNMT3B (15). Several studies have indicated the role of DNMT1 in the regulation of the expression of TSGs in colon cancer cells (16).
DNA methyltransferase inhibitors (DNMTIs) can inhibit DNMTs activity resulting in the re-activation of silenced TSGs. These compounds are divided into two groups including the nucleoside inhibitors and the nonnucleoside inhibitors. First group includes 5'-fluoro-2'-deoxycytidine (FdCyd), 5-azacytidine (5-AzaC, vidaza), and 5-aza-2'–deoxycytidine (5-Aza-CdR, decitabine). The second group includes epigallocatechin3-gallate (EGCG), procaine, and RG108 (17). The inhibitory effect of these compounds has been demonstrated in lymphoid cancer, ovarian cancer, cervical cancer, lung cancer (18), breast cancer (19), and human colon cancer cells (20, 21). Recently, we evaluated the effect of 5-Aza-CdR on DNMT1 gene expression in the WCH-17 hepatocellular carcinoma (HCC) cell line (22).
2. Objectives
The current study was designed to analyze the effects of 5-azac, 5-Aza-CdR, and FdCyd on the INK4a/ARF family (p15INK4a, p14, and p15), CIP/KIP family (p21, p27, and p57), and DNA methyltransferase 1 gene expression, cell growth inhibition, and cell apoptosis induction in colon cancer HCT-116 cell line.
3. Methods
Human colon cancer HCT-116 cell line was provided from the National Cell Bank of Iran-Pasteur Institute and maintained in DMEM supplemented with fetal bovine serum 10% and antibiotics (0.1 mg/mL streptomycin and 100 U/mL penicillin). 5-azac, 5-Aza-CdR, and FdCyd were purchased from Sigma (St. Louis, MO, USA) and dissolved in DMSOto make a master stock solution (23). Further concentration was obtained by diluting the provided solution. Other compounds including materials and kits were purchased as provided for our previous works (22, 24, 25), including FBS (fetal bovine serum), MTT, Real-time PCR kits (qPCRMaster Mix Plus for SYBR Green I dNTP), and total RNA extraction Kit (TRIZOL reagent). This work is a lab trial study approved by the Ethics Committee of Jahrom University of Medical Sciences with a code number of IR.JUMS.REC.1398.099.
3.1. Cell Culture and Cell Viability
The HCT-116 cells were cultured in DMEM supplemented with 10% FBS and antibiotics (0.1 mg/ml streptomycin and 100 U/mL penicillin) at 37°C in 5% CO2 for 24 h. Subsequently, the cells were seeded into 96-well plates (4 × 10⁵ cells per well). After 1 day, culture medium was removed and the experimental medium containing various doses of 5-azac (0, 0.5, 1, 2.5, 5, and 10 μM), 5-Aza-CdR (0, 0.5, 1, 2.5, 5, and 10 μM), and FdCyd (0, 0.5, 1, 2.5, 5, and 10 μM). The concentrations were selected based on and in the range of our previous works and other researchers' reports. The control groups were treated with the solvent (DMSO) only at a concentration of 0.05 %. After 24 and 48 h of treatment, the treated and untreated HCT-116 cells were evaluated by MTT assay to obtain cell viability, the MTT solution (5 mg/mL) was added to each well and allowed incubation for 4 h at 37°C. To dissolve all of the crystals, the solution was replaced by DMSO for 10 min. Subsequently, the absorbance spectrum was determined by a microplate reader at a wavelength of 570 nM.
3.2. Cell Apoptosis Assay
To determine cell apoptosis, the HCT-116 cells were cultured at a density of 4 × 10⁵ cells/well and incubated overnight and, then, the cells were treated with 5-azac, 5-Aza-CdR, and FdCyd, based on IC50 values indicated in Table 1 for different periods (24 and 48 h). Subsequently, the treated and untreated HCT-116 cells were harvested and prepared for flow cytometry by trypsinization, washing twice with cold PBS, and then stained with annexin-V-(FITC) and propidium iodide (PI). The apoptotic cells were determined by FACScan flow cytometry.
| Cell Line | Duration/Hour | IC50 Value/μM | LogIC50 | R Squared | Apoptosis (%) | P-Value a |
|---|---|---|---|---|---|---|
| FdCyd | 24 | 1.72 | 0.2357 | 0.7815 | 7.64 | < 0.0003 |
| FdCyd | 48 | 1.63 | 0.2121 | 0.9729 | 11.15 | < 0.0001 |
| 5-AzaC | 24 | 2.18 | 0.3391 | 0.8771 | 9.45 | < 0.0001 |
| 5-AzaC | 48 | 1.98 | 0.2981 | 0.8066 | 50.1 | < 0.0001 |
| 5-Aza-CdR | 24 | 4.08 | 0.6116 | 0.7221 | 13.16 | < 0.0001 |
| 5-Aza-CdR | 48 | 3.18 | 0.5034 | 0.7001 | 83.66 | < 0.0001 |
IC50 Values and Apoptosis. The Cells Were Treated with Compounds, to Determine IC50 Values and Apoptosis
3.3. Real-time Quantitative Reverse Transcription Polymerase Chain Reaction (qRT-PCR)
To determine the relative expression level of the INK4a/ARF family (p15INK4a, p14, and p15), CIP/KIP family (p21, p27, and p57), and DNA methyltransferase 1 gene, qRT-PCR was done. The HCT-116 cells were treated with 5-azaC, 5-Aza-CdR, and FdCyd, based on IC50 values indicated in Table 1 for different periods (24 and 48 h). Total RNA from the HCT-116 cells was extracted, using the RNeasy kit according to the protocol and treated by RNase‑free DNase to eliminate the genomic DNA before cDNA synthesis (26). Real-time PCR reactions were performed, using the Steponeplus. Thermal cycling conditions were initial denaturation at 95°C for 10 minutes, followed by 40 cycles of denaturation at 95°C for 20 seconds, annealing at 58°C for 15 seconds, and extension at 72°C for 15 seconds. Thermal cycling conditions for DNMT1 was initial denaturation at 95°C for 10 minutes, followed by 40 cycles of denaturation at 95°C for 15 seconds, annealing at 60°C for 20 seconds, and extension at 72°C for 20 seconds.
The data were analyzed, using the comparative Ct (ΔΔct) method. A melting curve was used to determine the melting temperature of specific amplification products and primer dimmers. GAPDH was used as a reference gene for internal control. The primer sequences of the genes used in the current article are shown in Table 2 (27-32). The relative RT-PCR determines the expression level in comparison with a reference sample. It is based on the expression levels of a target gene versus a housekeeping gene (Pfaffl 2004) (33).
| Primer | Primer Sequences (5' to 3') | Product Length/bp | Reference |
|---|---|---|---|
| P14 | Forward: TACTGAGGAGCCAGCGTCTA | 146 | (27) |
| Reverse: TGCACGGGTCGGGTGAGAGT | |||
| P15 | Forward: AAGCTGAGCCCAGGTCTCCTA | 93 | (28) |
| Reverse: CCACCGTTGGCCGTAAACT | |||
| P15 | Forward: CTTCCTGGACACGCTGGT | 162 | (29) |
| Reverse: GCATGGTTACTGCCTCTGGT | |||
| P21 | Forward: CGATGGAACTTCGACTTTGTCA | 220 | (30) |
| Reverse: GCACAAGGGTACAAGACAGTG | |||
| P 27 | Forward: GGTTAGCGGAGCAATGCG | 127 | (30) |
| Reverse: TCCACAGAACCGGCATTTG | |||
| P 57 | Forward: GCGGCGATCAAGAAGCTGT | 52 | (31) |
| Reverse: GCTTGGCGAAGAAATCGGAGA | |||
| DNMT1 | Forward: GCACAAACTGACCTGCTTCA | 213 | (32) |
| Reverse: GCCTTTTCACCTCCATCAAA | |||
| GAPDH | Forward: TGTGGGCATCAATGGATTTGG | 116 | (31) |
| Reverse: ACACCATGTATTCCGGGTCAAT |
The Primer Sequences of INK4a/ARF, CIP/KIP, and DNMT1 Genes a
3.4. Statistical Analysis
Data from three independent experiments were analyzed with one-way analysis of variance (ANOVA) using Graphpad Prism Software version 8.0. A significant difference is expressed as P < 0.05.
4. Results
4.1. Cell Viability
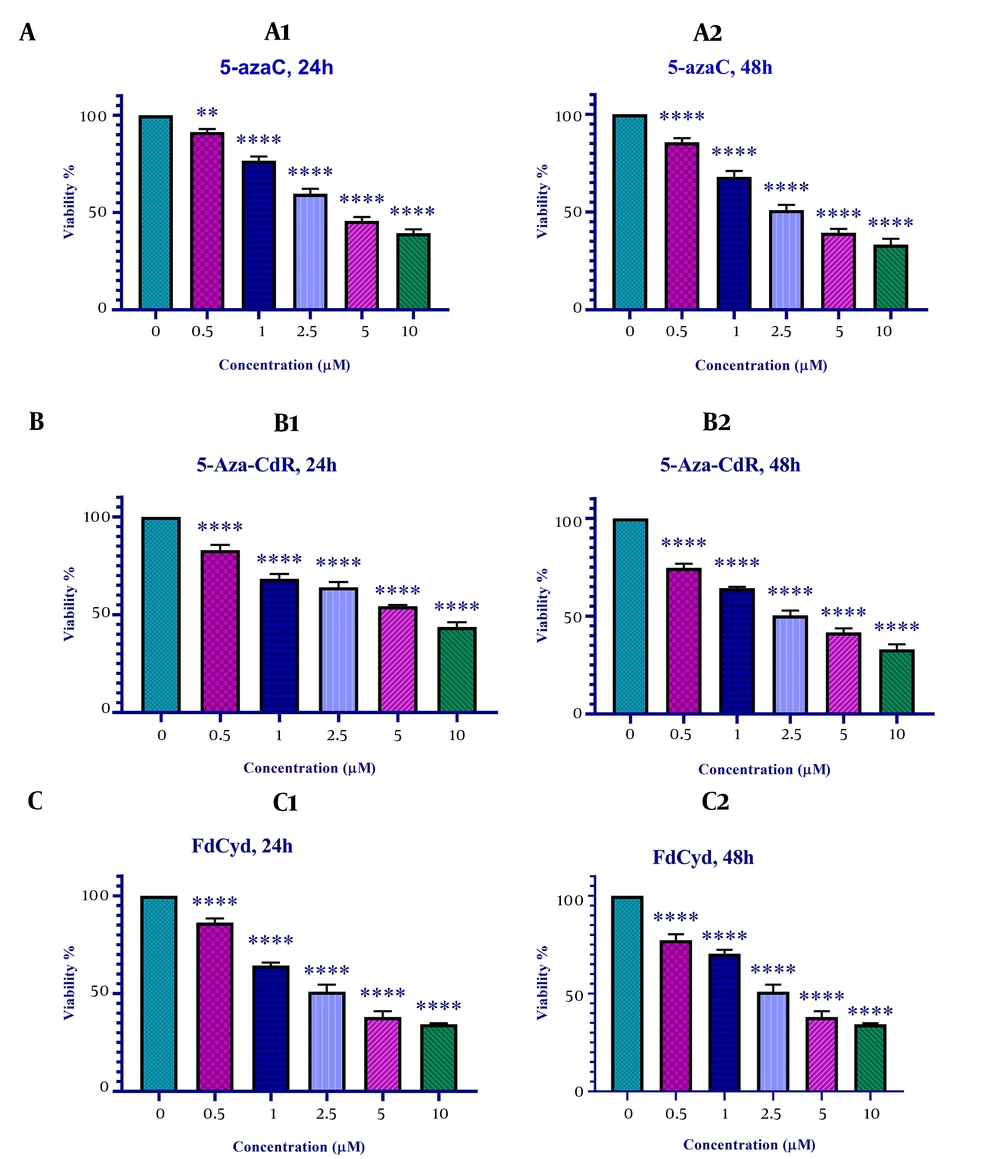
The viability of colon cancer HCT-116 cells treated with 5-azac, 5-Aza-CdR, and FdCyd was measured by MTT assay. As indicated in Figure 1, 5-azac, 5-Aza-CdR, and FdCyd induced significant cell growth inhibition. The half-maximal inhibitory concentration (IC50) values are demonstrated in Table 1. As indicated in Table 1, The IC50 for CAF for FdCyd was 1.72 ± 0.23 and 1.63 ± 0.21 μM at 24 and 48h, respectively. The IC50 for CAF for 5-AzaC was 2.18 ± 0.33 and 1.98 ± 0.29 μM at 24 and 48h, respectively. The IC50 for CAF for 5-Aza-CdR was 4.08 ± 0.61 and 3.18 ± 0.50 μM at 24 and 48h, respectively.
In vitro effects of 5-azaC, 5-Aza-CdR, and FdCyd on HCT-116 cell line viability determined by MTT Assay at 24 and 48 h. Asterisks demonstrate significant differences between HCT-116 treated and untreated control groups. It should be noted that **and **** indicate P < 0.0013 and P < 0.0001, respectively.
4.2. Cell Apoptosis
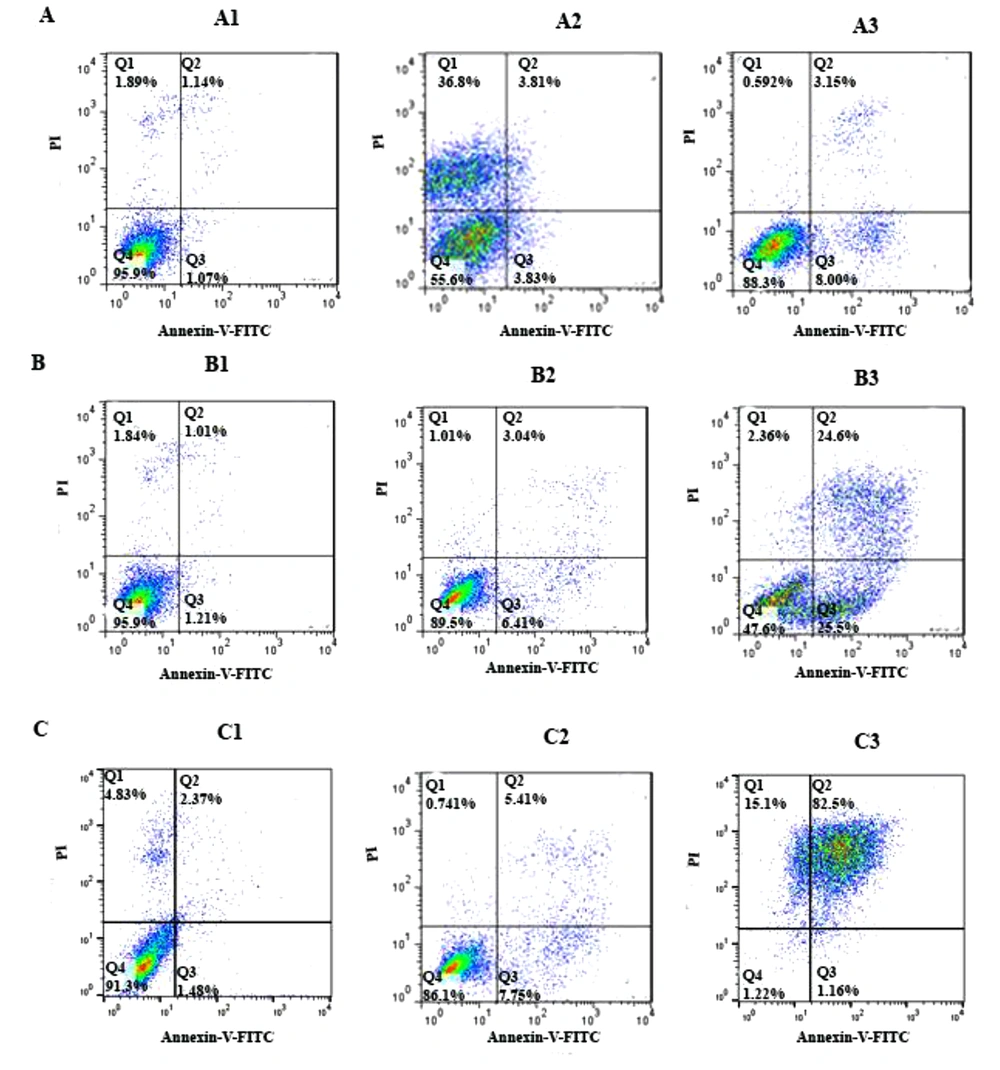
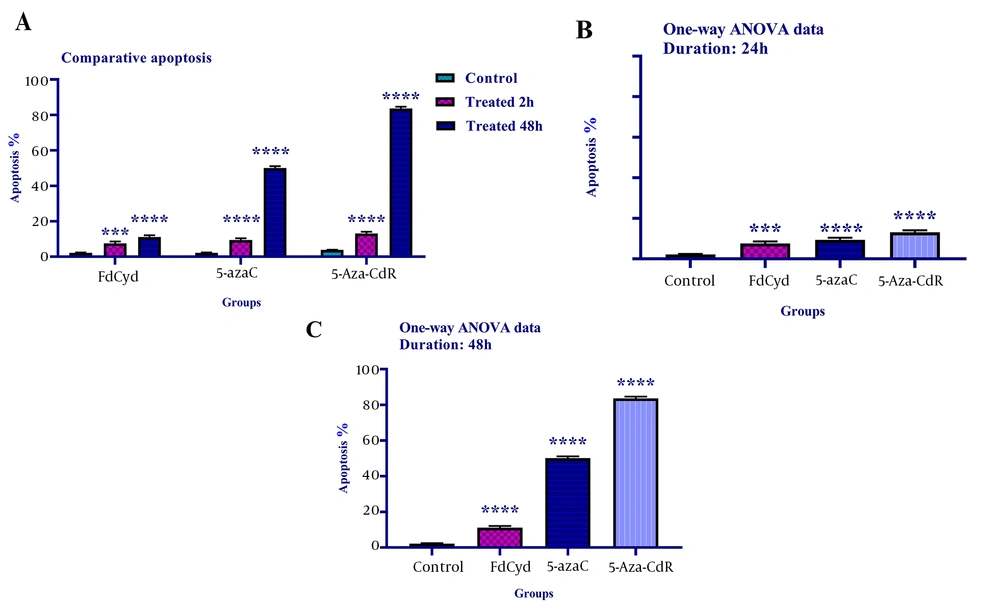
To determine cell apoptosis, the HCT-116 cells were treated with FdCyd (1.72 ± 0.23 and 1.63 ± 0.21μM), 5-AzaC (2.18 ± 0.33 and 1.98 ± 0.29 μM), and 5-Aza-CdR (4.08 ± 0.61 and 3.18 ± 0.50 μM) for 24 and 48 h and stained using annexin-V-(FITC) and PI as mentioned in the method section. As depicted in Figure 2, all of the compounds significantly induced apoptosis (Figure 3). Besides, minimal and maximal apoptosis were seen in the groups treated with FdCyd and 5-Aza-CdR, respectively. The percentage of HCT-116 apoptotic cells is shown in Table 1.
The apoptotic effect of 5-azac, 5-Aza-CdR, and FdCyd on HCT-116 cell line versus control groups at different periods (24 and 48h). The cells were treated with FdCyd (1.72 and 1.63 μM), 5-AzaC (2.18 and 1.98 μM), and 5-Aza-CdR (4.08 and 3.18 μM) for 24 and 48h, respectively. Quadrant (Q) 2 and 3, late and primary apoptosis, respectively, were calculated in this graph. A: FdCyd treated groups (A1: Control; A2: 24h; A3: 48h); B: 5-azac treated groups (B1: Control; B2: 24h; B3: 48h); C: 5-Aza-CdR treated groups (C1: Control; C2: 24h; C3: 48h).
The comparative apoptotic effects of 5-azac, 5-Aza-CdR, and FdCyd on HCT-116 cell line. The cells were treated with FdCyd (1.72 and 1.63 μM), 5-AzaC (2.18 and 1.98 μM), and 5-Aza-CdR (4.08 and 3.18 μM) for 24 and 48h, respectively. Asterisks indicate significant differences between the HCT-116 treated and untreated control groups. All compounds induced significant apoptosis in HCT-116 cell line (part A). Minimal and maximal apoptosis were seen in the groups treated with FdCyd and 5-Aza-CdR, respectively (parts B, and C). It should be noted that *** and **** indicate P < 0.0003 and P < 0.0001, respectively.
4.3. Gene Expression
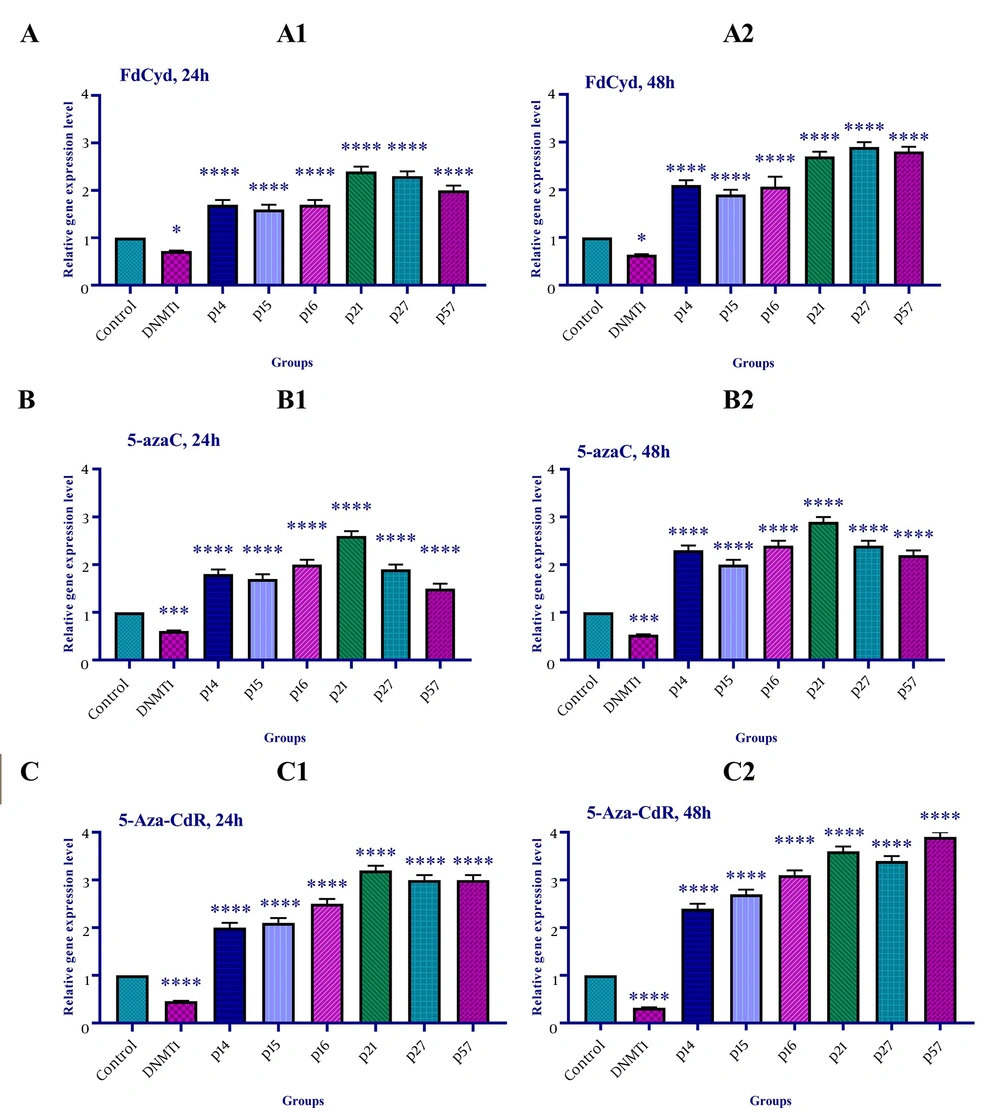
The effect of 5-azac, 5-Aza-CdR, and FdCyd on INK4a/ARF family (p15INK4a, p14, and p15), CIP/KIP family (p21, p27, and p57), and DNA methyltransferase 1 gene expression was assessed by qRT-PCR. To determine the relative gene expression, the HCT-116 cells were treated with FdCyd (1.72 ± 0.23 and 1.63 ± 0.21 μM), 5-AzaC (2.18 ± 0.33 and 1.98 ± 0.29 μM), and 5-Aza-CdR (4.08 ± 0.61 and 3.18 ± 0.50 μM) for 24 and 48h, respectively. The result indicated that treatment with 5-azac, 5-Aza-CdR, and FdCyd (24 and 48h) upregulated INK4a/ARF (p15INK4a, p14, and p15) and CIP/KIP (p21, p27, and p57) families, and down-regulated DNMT1 gene expression significantly (Figure 4).
The relative expression level of the INK4a/ARF family (p15INK4a, p14, and p15), CIP/KIP family (p21, p27, and p57), and DNA methyltransferase 1 gene in the colon cancer HCT-116 cell line. The cells were treated with FdCyd (1.72 and 1.63 μM), 5-AzaC (2.18 and 1.98 μM), and 5-Aza-CdR (4.08 and 3.18 μM) for 24 and 48h, respectively. A significant difference was seen between treated and untreated control groups. Asterisks indicate significant differences between the treated and untreated control groups. A: FdCyd treated groups; B: 5-azac treated groups; C: 5-Aza-CdR treated groups. It should be noted that *, ***, and **** indicate P < 0.0195, P < 0.0011, and P < 0.0001, respectively.
5. Discussion
Cellular gene transcription is directly under the influence of the genomic structure and organization. DNA methylation is an important epigenetic modification that has widespread influences on gene transcription and expression (34). It is profoundly altered in human cancers. The silencing of TSGs by this epigenetic change is known as a key mechanism in tumorigenesis (35). The potential anticancer activity of DNMT inhibitors has been extensively evaluated in recent years. These compounds are widely studied because DNA demethylation induces the re-activation of TSGs that are silenced by promoter hypermethylation (36).
In the present study, we demonstrated that DNA demethylating agents 5-azac, 5-Aza-CdR, and FdCyd inhibited HCT-116 cell growth and induced apoptosis in colon cancer HCT-116 cell lines. Furthermore, we did a further evaluation to find the molecular mechanism of the compounds. Thus, we found that these agents could re-activate INK4a/ARF family (p15INK4a, p14, and p15) and the CIP/KIP family (p21, p27, and p57) by inhibition of DNA methyltransferase 1 gene expression.
Similar apoptotic pathways have been shown by other researchers. It has been indicated that 5-Aza-CdR increases the expression of both p15INK4a and p19INK4d in the human lung cancer cell line (37). In vitro studies have shown such molecular mechanisms for the member of INK4 in colorectal cancer (38), leukemia (39), ovarian cancer (40), gastric cancer (41), and HCC (42). As mentioned above DNA methyltransferase inhibitors play their role through the re-activation of the CIP/KIP family. A similar pathway has been indicated in HCC (43), gastric cancer (44), breast, and lung cancer (45). We reported that DNA demethylating agents 5-azac, 5-Aza-CdR, and FdCyd play their role through inhibition of DNMT1 activity.
In addition to this function, several in vitro studies have been demonstrated that these agents can inhibit DNMT3a and DNMT3b in the colon cancer HCT-116 (46), DNMT3B in human endometrial cancer (47), DNMT1, and/or DNAT 3b mediates in lung cancer, esophageal cancer, and malignant pleural mesothelioma cells (48), and DNMT3b in testicular germ cell tumors (TGCT) (49).
Additionally, other members of DNA methyltransferase inhibitors can induce apoptosis with similar molecular mechanisms. Our previous work indicated that zebularine (a membership of HDACIs) can induce apoptosis through down-regulation of DNMT1, DNMT3a, and DNMT3b and up-regulation of p21Cip1/Waf1/Sdi1, p27Kip1, and p57Kip2 in colon cancer LS 174T cell line (50). Besides, we reported that zebularine induces apoptosis by down-regulation of DNMT1, 3a, and 3b and up-regulation of p21Cip1/Waf1/Sdi1, p27Kip1, p57Kip2 in colon cancer LS 180 cell line (51). Meanwhile, DNMT1 inhibition is not the only apoptotic pathway of DNMTIs. It has been reported that 5 aza 2' deoxycytidine treatment resulted in significant FAS gene up-regulation in the HT 29 cell line and it plays its role through the extrinsic apoptotic pathway (52). Inconsistent with our report, it has been reported that 5 AZA treatments cannot induce a significant change in cell proliferation, cell cycle arrest, cell apoptosis, and mtDNA copy number in HCT116, SW480, LS 174T, and HT 29 cell lines (53). Finally, DNMTIs can play their apoptotic roles through various molecular mechanisms.
We indicated that inhibition of DNMT1 activity by 5-azac, 5-Aza-CdR, and FdCyd induces re-activation of INK4a/ARF family (p15INK4a, p14, and p15) and CIP/KIP family (p21, p27, and p57), resulting in apoptosis induction in colon cancer HCT-116 cell line.
We did not assess the other DNMTs gene expression such as DNMT3a and DNMT3b in this work. Thus, this evaluation is recommended.
5.1. Conclusions
In summary, our findings indicated that 5-azac, 5-Aza-CdR, and FdCyd inhibited colon cancer HCT-116 cell line and induced apoptosis in this cell line. The most likely molecular mechanism underlying these compounds inhibited HCT-116 cell growth and induced apoptosis involves down-regulation of DNMT1 and up-regulation of CIP/KIP (p21, p27, and p57) and INK4 (p14, p15, and p15INK4a) genes expression. This result suggests that 5-azac, 5-Aza-CdR, and FdCyd may have wide therapeutic applications in colon cancer.


