


1. Background
Breast cancer is a highly heterogeneous disease. Triple-negative breast cancer (TNBC) is a breast cancer subtype that does not express estrogen (ER) and progesterone (PR) receptors and lacks human epidermal growth factor receptor 2 (HER2) expression. Clinical studies have shown that TNBC is the most invasive type of breast cancer, with low disease-free survival (DFS) and overall survival (OS) rates. In addition, TNBC patients are more have a higher incidence of brain, lung, and liver metastasis (1-3).
In Iran, the prevalence of TNBC is 14%. Most clinical features of TNBC in Iran, such as larger tumors, diagnosis in more advanced stages, and lower overall survival (OS) and DFS rates, are similar to those found in other parts of the world (4).
Meta stasis is a multi-stage process and is one of the most feared aspects of cancer mortality. In the first two stages, tumor cells detach from the basement membrane and extracellular matrix (5, 6). Recent studies have shown that metastasis is closely related to the process of epithelia-mesenchymal transition (EMT) (7). E-cadherin plays an important role in epithelial cell adhesion (8). The most common transcription factors that alter epithelial marker levels and interfere with the EMT process are ZEB1, ZEB2, Snail1, Snail2, TWIST1, and TWIST2.
One of the prominent features of TNBC is the elevated expression of vimentin, caveolins and cadherin, along with p53 abnormalities, which are correlated with increased metastasis (9).
MicroRNAs (miRNAs) can regulate gene expression at the transcriptional or post-transcriptional level. During cancer progression, miRNAs can act as oncogenes or tumor suppressors (10). One particular tumor suppressor miRNAs involved in cancer is miR-101 (11). In vivo and in vitro studies have shown that miR-101 can play a vital role in the pathogenesis of breast cancer (12).
Epigenetic changes are processes that regulate gene expression through post-translational changes. Acetylation is one of the key epigenetic changes. Histone deacetylase inhibitors (HDACi) are pharmaceutical agents designed to target HDAC, which is capable of targeting the epigenome of cancer cells. Increased HDACi activity has been reported during the progression of tumor cells (13, 14).
Histone deacetylase inhibitors are divided into five categories: Hydroxamates, circular peptides, aliphatic acids, benzamides, and sirtuin inhibitors (15). Sodium butyrate (NaB) is a type of natural short-chain fatty acid that can inhibit cell growth, induce apoptosis, and DNA fragmentation in cancer cells. Sodium butyrate lacks cytotoxic effects on normal cells, and for these reasons, it can be used as a potential anti-cancer drug (16, 17).
2. Objectives
This study aimed to investigate the anticancer effects of NaB on MDA-MB-468 cells, and a TNBC cell line by assessing cell viability, cell metastasis and the changes in miR-101, ZEB1, ZEB2, and E-cadherin expression as EMT markers.
3. Methods
3.1. Cell Culture
In this experimental study, the TNBC cell line (MDA-MB-468) was purchased from the National Center for Genetic and National Reserves of Iran. The cells were cultivated in the DMEM/F12 culture medium supplemented with 10% fetal bovine serum (FBS), and 1% penicillin/streptomycin in a 5% CO2 incubator at 37°C.
3.2. MTT Assay
To perform the MTT assay, the MDA-MB-468 cells were first cultivated at a density 104 cells per well in a 96-well plate. They were then treated with different doses of NaB (1, 2.5, 3.5, 5, and 10 mM) for 24, 48, and 72 hours. The dose selection was performed according to a related previous study (18). The untreated cells were considered as the control group. After the desired time, 5 μL of MTT solution (5 mg/mL) was added and incubated for 4 hours. Then, 50 μL of DMSO was added, and the absorbance was read at 570 nm wavelengths. Cell survival was calculated by comparing the mean absorbance of the treated and untreated cells.
3.3. Scratch Assay
In this method, cells (2 × 10⁵) were grown in 6 well plates. After the cells reached 80% cell density, a line was drawn using a scratcher in a specified line on the bottom of the plate. The cells were treated with NaB (IC50 value) and placed in a 37°C incubator for 72 hours. Cell migration was evaluated under an inverted microscope.
3.4. Transwell Assay
At first, 2.5 × 10⁴ cells were added to the upper chamber of a transwell plate along with 2% FBS and 1 mL of complete media added to the NaB in the upper chamber. Meanwhile, media with 20% FBS was added to the lower chamber. After 24 hours, the treatment group received 200 μL of 3.1 mM NaB in the upper chamber. The cells were then placed in an incubator, and the upper and lower surfaces of the membrane were washed with PBS. Both surfaces of the membrane were then exposed to 5% glutaraldehyde for 10 minutes. Finally, the membranes were stained with 1% violet crystal, and only the cells that had migrated to the lower part of the membrane were observed under an inverted microscope.
3.5. Real-time Polymerase Chain Reaction
The cells were first treated with 3.1 mM of NaB for 72 hours. Then, RNA was manually isolated by TRIrisol Kit according to the protocol with DNAase I treatment. To quantitatively investigate of the extracted RNA, the absorption rate of the extracted RNAs was measured at wavelengths of 260 to 280 nm. For qualitative evaluation, 1% agarose gel should be used. Real-time polymerase chain reaction (qRT-PCR) was used to quantitatively evaluate the expression of genes (ZEB1, ZEB2, E-cadherin) and miR-101. The BIOFACT kit was used to synthesize cDNA. Random Hexamer primers were used to synthesize the cDNA of genes (ZEB1, ZEB2, and E-cadherin) and specific primers for miR-101, that span exon junctions for a gene (Table 1). Real-time PCR reactions were performed using the Cyber Green method on a QIAGEN device. To evaluate the expression of EMT markers, GAPDH was used as a housekeeping gene and SNORD47 was used as a control for miR-101. The ∆∆Ct equation was used to calculate the value of 2-∆∆Ct.
∆Ct control = [Ctintended gene (control) - Ctcontrol gene (control)].
∆Ct test = [Ctintended gene (test) - Ctcontrol gene (test)].
∆∆Ct = ∆Ct (control) - ∆Ct (test).
The expression ratio = 2-∆∆Ct.
| Genes | Primers | Sequence (5′-3′) | %GC | Annealing TM (°C) |
|---|---|---|---|---|
| miR-101 | Forward | CGCCGATCGATCGATCGATTCTG | 56 | 65 |
| Reverse | CGATCATTTTTTTTTTTTTTTGAC | 20 | ||
| ZEB1 | Forward | GTTTCTGGAGAGGTCAGAGTTG | 50 | 64 |
| Reverse | AGAAGTGCAGGAGCTGAGAG | 55 | ||
| ZEB2 | Forward | GAAATAAGGGAGGGTGGAGTGG | 54 | 64 |
| Reverse | TCTGGATCGTGGCTTCTGG | 57 | ||
| E- cadherin | Forward | GGGGTCTGTCATGGAAGGTG | 60 | 65 |
| Reverse | GGATCTTGGCTGAGGATGGTG | 57 | ||
| GAPDH | Forward | GTGGTCTCCTCTGACTTCAAC | 52 | 64 |
| Reverse | GGAAATGAGCTTGACAAAGTGG | 45 | ||
| SNORD47 | Forward | ATCACTGTAAAACCGTTCCA | 40 | 55 |
| Reverse | GAGCAGGGTCCGAGGT | 68 |
Primers Used in Real-time Polymerase Chain Reaction
3.6. Statistical Analysis
Statistical analysis was performed using GraphPad Prism 8.1 software. P value of less than 0.05 (P < 0.05) was considered statistically significant. One-way ANOVA and t-test were used to perform a one-way analysis of variance and compare differences between the control and treatment groups.
4. Results
4.1. Evaluation Cell Survival by MTT Method
The MTT assay showed a negative correlation between cell survival and NaB concentration after 72 hours of treatment NaB concentration of 3.1 mM induced 50% cell death in MDA-MB-468 cells after 72 hours, indicating an IC50 value of 3.1 mM (P < 0.05). In addition, NaB induced more cell death at concentrations of 5 to 10 mM (P < 0.001) (Figure 1).
 on the viability of MDA-MB-468 cells in different doses of 1-10 mM under 24, 48, and 72 hours treatment using two-way ANOVA analysis. The data showed as mean ± standard deviation. ns, not significant. *: P < 0.05; ***: P < 0.001.")
Cell survival was evaluated by MTT assay. The effect of sodium butyrate (NaB) on the viability of MDA-MB-468 cells in different doses of 1-10 mM under 24, 48, and 72 hours treatment using two-way ANOVA analysis. The data showed as mean ± standard deviation. ns, not significant. *: P < 0.05; ***: P < 0.001.
4.2. Scratch Test
As shown in Figure 2, the control group had a significant level of cell migration after 72 hours, while the IC50 treatment group had a significant decrease in cell migration.
 (× 100): A, scratch creation time (time = zero)")
Scratch assay after 72 hours treatment with IC50 concentration of sodium butyrate (NaB) (× 100): A, scratch creation time (time = zero)
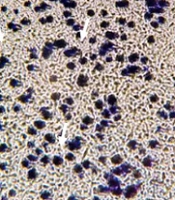
4.3. Transwell Assay
As exhibited in Figure 3, after 72 hours, cell migration decreased in the treated cells with a concentration of 3.1 mM of NaB, compared to the control group. This verifies the suppressor effect of NaB on the migration of MDA-MB 468 cells.
 (× 200): A, the untreated cells; B, cells treated with 3.1 mM of NaB. In part of A, several cells that have lost their ability to migrate have been marked by an arrow.")
Transwell assay after 72 hours of cell treatment with IC50 concentration of sodium butyrate (NaB) (× 200): A, the untreated cells; B, cells treated with 3.1 mM of NaB. In part of A, several cells that have lost their ability to migrate have been marked by an arrow.
4.4. Quantitative and Qualitative Assessment of RNA Extraction
The optical absorption rates of the extracted RNAs are shown in Table 2. For qualitative evaluation of the extracted RNAs, the samples were loaded on 1% agarose electrophoresis gel, as shown in Figure 4A.
| Samples | Concentration (ng/µL) | Light Absorption 260 to 280 nm |
|---|---|---|
| Control group (without treatment) | 1184 | 1.984 |
| Treatment with 3.1 mM NaB | 2228 | 1.918 |
Quantitative Analysis of RNA Extracted by Nano-Drop
 after 72 hours compared to the control group. Fold-change values in mRNA levels evaluated from 2<sup>-ΔΔCT</sup> method. *: P < 0.05 was considered significant.")
A, electrophoresis gel related to qualitative evaluation of the extracted RNAs. Clear bands of 18S and 28S indicate the appropriate quality of the extracted RNAs; B and C, the expression of ZEB1, ZEB2, E-cadherin, and miR-101 in MDA-MB-468 cells treated with 3.5 mM sodium butyrate (NaB) after 72 hours compared to the control group. Fold-change values in mRNA levels evaluated from 2-ΔΔCT method. *: P < 0.05 was considered significant.
4.5. Gene Expression Analysis by qRT-PCR
According to Figure 4B and C, the expression of ZEB1 and ZEB2 in the NaB- treated group (3.1 mM) significantly decreased (P < 0.05). In contrast, the expression of E-cadherin and miR-101 in the IC50-treated group was significantly upregulated compared to the untreated cells. Figure 5 shows melting curves of RT-PCR reaction products of examined genes, which indicate the absence of a non-specific product and a primer dimer, confirming the specificity of the reaction.
; ZEB1 (B); ZEB2 (C); E- cadherin (D); SNORD47 (E); and miR-101 (F) show the specificity of the reaction and the presence of only one product in the reaction due to the presence of only one peak in the graph.")
The melting curves of GAPDH (A); ZEB1 (B); ZEB2 (C); E- cadherin (D); SNORD47 (E); and miR-101 (F) show the specificity of the reaction and the presence of only one product in the reaction due to the presence of only one peak in the graph.
5. Discussion
In recent literature, TNBC has been proposed as the most aggressive group of breast cancer. Cell invasion is involved in the progression of breast cancer cell metastasis, and EMT-associated factors are a prominent feature of TNBC (5, 6, 19).
Based on the findings, the appropriate concentration for IC50, was determined to be 3.1 mM after 72 hours of treatment in MDA-MB-468 cells (P < 0.05). This concentration was used to evaluate the anti-metastatic effect of NaB on TNBC cells.
To evaluate the anti-metastasis effect of NaB, the scratch assay was used to evaluate cell migration of MDA-MB-468 cells. The results showed a decrease in cell migration in cells treated with 3.1 mM concentration of NaB compared to the control group. To confirm this assay, the transwell assay was used which further supported the anti-metastatic effect of NaB on MDA-MB-468 cells.
In addition, the effect of NaB on the expression of miR-101 a tumor suppressor, E-cadherin, and the transcription factors of ZEB1 and ZEB2 in the MDA-MB-468 cell line was investigated. Transcription factors such as ZEB1 and ZEB2 are involved in the EMT process by increasing cell migration (8). Based on real-time PCR, the expression of miR-101, E-cadherin, ZEB1, and ZEB2 was significantly altered in the group treated with the IC50 concentration of NaB (P < 0.05). According to various studies, miR-101 is down-regulated in various cancers such as gastric cancer (20), bladder cancer (21), cervical cancer (22) and ER-positive breast cancer (23). It plays an essential role in many cancer-related processes such as cell proliferation, invasion, and metastasis (24-26). The down-regulation of in miR-101 has been reported in a variety of breast cancer subtypes, and the low expression of miR-101 is not limited to a specific breast cancer group. Under exposure to the IC50 concentration of NaB, the expression of E-cadherin and miR-101 increased, while ZEB1 and ZEB2 decreased significantly compared to the control (P < 0.05).
In 2015, Jang et al., evaluated the level of ZEB1 factor and CD146 as an EMT inducer in TNBC cells. They pointed out that an increase in the ZEB1 level could enhance the EMT process in TNBC breast cancer metaplastic carcinoma. Therefore, ZEB1 could have clinical significance and be considered as a prognostic TNBC biomarker in the future. Also, related to the expression of miR-655 in TNBC, it has been found that the up-regulation of miR-655 in cancer is associated with an attenuation in the expression of vimentin and Prrx1 which are EMT inducerer. These changes inhibited cell invasion, the conversion of the mesenchymal to epithelial phenotype, and reduced the EMT process in TNBC breast cancer (27).
Based on previous studies, NaB is able to induce anticancer effect by attenuating cell proliferation and inducing apoptosis in various cancers. It has also been emphasized that NaB has anticancer activities by increasing the expression of different miRNAs such as miR125-a (28) and miR-31(29) in breast cancer and miR203 (30) and miR-200c (31) in colorectal cancer.
In line with the present findings, it has been reported that NaB has a suppressive effect on different cancer cell lines (32). According to Elnozahi et al.'s study, NaB has an anti-invasive effect in the MDA-MB-231 cells, which is related to reducing NF-kB expression and increasing the Rb protein. NF-kB can increase cell migration by activating the direct transcription activator of metalloprotease-9 (MMP-9), which has the ability to destroy cell matrix. Also, Rb, as a direct activator of E-cadherin, plays an essential role in reducing invasion and cell migration (33, 34).
5.1. Conclusions
Sodium butyrate is an efficient drug against MDA-MB-468 metastatic cells. It exerts its anti-metastatic effect mainly through up-regulation of miR-101, increment of ZEB1 and ZEB2 and attenuation of E-cadherin. However, due to limited studies, the effect of NaB on metastasis-related cellular pathways should be further investigated in preclinical and clinical trials.
