


1. Background
Injuries are a significant yet neglected cause of mortality, with millions of injury-related deaths each year reflecting significant disparities by gender, race, and socio-economic status (1). Globally, injuries also cause substantial disability. In 2019, for all ages, road injuries (ranked 7th) were the leading causes of disability-adjusted life years (DALYs) (2). Road accidents are the most critical cause of injury-related deaths. It takes the lives of 1.2 million people worldwide annually, and 20 to 50 million people are injured or disabled. Low- and middle-income countries represent 84% of the world’s population and 53% of vehicles (3). These countries account for 90% of deaths due to traffic accidents, which is twice the number in high-income countries (4).
According to the World Health Organization (WHO), the average death rate from traffic accidents worldwide is 19 per 100,000 population, of which 17.4 are in Europe and 26.4 in the Eastern Mediterranean (5, 6). In Iran, traffic accidents are the third leading cause of death after cardiovascular diseases and cancers. The number of victims of traffic accidents in Iran is reported to be 30 to 39 per 100,000 population (7). Numerous factors are involved in traffic accidents, generally classified into three groups: Vehicle-related, environmental-related, and human factors (8). The human element is the most complex component in the etiology of traffic accidents, as it is the most common and important cause of traffic accidents (9).
Various studies have been conducted to identify risk factors for fatalities in traffic accidents (10-12). According to a study in the US, the role of human factors was estimated at 57%. Also, the part of environment and road factors equaled 34%, whereas 30% was shared between the environment and humans, and 4% depended only on environmental conditions (13). Other studies have reported gender, not wearing a seat belt, age, driving over the speed limit, smoking and alcoholism, driver inattention, and the driver's inability to control the vehicle as human risk factors in the accident (7, 9, 14). Identifying the most likely human risk factors affecting/aggravating the severity of accidents can be considered a basis for effectively preventing traffic accidents. Deciding on the type of interventions and applying population-based prevention strategies requires access to information based on scientific evidence (15).
2. Objectives
This study aimed to determine the role of human factors in causing traffic accidents in both urban and suburban areas of Jahrom, Fars province, and compare them to provide the basic information required for policymakers and decision-makers to help create the necessary interventions in traffic accidents.
3. Materials and Methods
3.1. Study Design
This descriptive study uses secondary data analysis. It is based on census data on 598 traffic accidents and incidents on urban and suburban roads in Jahrom in 2020, recorded in the accident registration forms (KAM) of the Police Information and Communication Technology (ICT-FAVA) system. Inclusion criteria were the traffic accidents that occurred in Jahrom, after which the traffic police were contacted, and their information was recorded in the FAVA system related to traffic. Also, the recorded accidents whose information was incomplete and not at hand were excluded.
In general, the traffic police, after being informed of the car accident, come to the scene to investigate and, according to their legal duty, complete KAM forms. In these forms, the outcome of the traffic accident is recorded in three categories: Fatal, injury, and damage.
The gathered data included general characteristics of the population, such as age, sex, education, driver's license status, seat belt use status, and violations recorded in the traffic police database, including failure to yield to the right of way, driver inattention to the front, inability to control the vehicle, bypassing a forbidden place, opening the car door suddenly, moving in the opposite direction, crossing the banned area, turning incorrectly, not observing the longitudinal distance, not observing the lateral space, moving in reverse gear, and sudden diversion. All the data were extracted from the system and sorted by different geographical areas of Jahrom.
3.2. Statistical Analysis
The obtained data were analyzed by SPSS 20 software using descriptive statistics, chi-square test, and multivariable logistic regression using the backward technique. The dependent variable was the type of accident in two categories: Damage and death or injury. A P-value less than 0.05 was considered statistically significant.
The population-attributable risk was calculated via the following formula (16):
Where OR is the odds ratio of the risk factor calculated using multivariable logistic regression analysis, and Pe is the ratio of the population exposed to the risk factor. The 95% confidence intervals for AR were computed (17) via SAS Version 9.1 (SAS Institute, Cary, NC).
3.3. Ethical Consideration
The study protocol was approved by the Research Ethics Committee of Jahrom University of Medical Sciences (IR.JUMS.REC.1399.135).
4. Results
A total of 598 traffic accidents on urban and suburban roads, based on data extracted from police records, resulted in 20 deaths and 356 injuries, and the rest was unharmed. In examining the characteristics of people involved in accidents on urban and suburban roads, men had the highest frequency (Figure 1). For example, 114 (87%) drivers involved in accidents on urban roads that resulted in death or injury were men. The rest were related to female drivers. The age group of 30 - 59 years had the highest frequency of accidents resulting in death or injury (n = 75, 57.3%) and unharmed accidents (n = 102, 65.4%). The highest frequency of deaths or injuries was related to drivers with diploma education. The use of seat belts on urban roads of Jahrom was 58.18% (167 people) (Table 1).

Age-sex pyramid distribution of traffic accidents on urban and suburban roads in Jahrom in 2020
| Variables | Urban | P-Value a | Suburban | P-Value a | ||
|---|---|---|---|---|---|---|
| Death and Injury, No. (%) | Damage, No. (%) | Death and Injury, No. (%) | Damage, No. (%) | |||
| Age (y) | 0.004 | 0.005 | ||||
| 1 - 17 | 5 (3.8) | 0 (0) | 5 (2) | 0 (0) | ||
| 18 - 29 | 41 (31.3) | 37 (23.7) | 50 (20.3) | 7 (10.8) | ||
| 30 - 59 | 75 (57.3) | 102 (65.4) | 174(70.7) | 52 (80) | ||
| > 60 | 10 (7.6) | 17 (10.9) | 17 (6.9) | 6 (9.2) | ||
| Gender | 0.88 | 0.73 | ||||
| Male | 114 (87) | 135 (86.5) | 230 (93.5) | 60 (92.3) | ||
| Female | 17 (13) | 21 (13.5) | 16 (6.5) | 5 (7.7) | ||
| Education | 0.002 | 0.056 | ||||
| High school | 22 (16.8) | 24 (15.4) | 10 (40.1) | 0 (0) | ||
| Diploma | 49 (37.4) | 69 (44.2) | 30 (12.2) | 3 (4.6) | ||
| University | 36 (27.5) | 63 (40.4) | 4 (1.6) | 0 (0) | ||
| Unknown | 24 (18.3) | 0 (0) | 202 (82.1) | 62 (95.4) | ||
| Driving license | < 0.0001 | < 0.0001 | ||||
| Yes | 97 (74) | 150 (96.2) | 184 (74.8) | 60 (92.3) | ||
| No | 34 (26) | 6 (3.8) | 39 (15.9) | 1 (1.50) | ||
| Unknown | 0 (0) | 0 (0) | 23 (9.3) | 4 (6.2) | ||
| Using a seat belt | < 0.001 | < 0.0001 | ||||
| Yes | 53 (40.5) | 114 (73.1) | 68 (27.6) | 2 (3.1) | ||
| No | 57 (43.5) | 42 (26.9) | 98 (39.8) | 17 (26.2) | ||
| Unknown | 21 (16) | 0 (0) | 80 (32.5) | 46 (70.8) | ||
Demographic Characteristics of Drivers Involved in Accidents on Urban and Suburban Roads in Jahrom, 2020
Examining the characteristics of people involved in accidents on suburban roads showed that the high frequencies of deaths or injuries were 230 (93.5%) in men and 174 (70.7%) in 30 to 59 years. The use of seat belts on suburban roads in Jahrom was 22.50% (70 people). In 40.51% (126 people), the status of the use of seat belts was unknown, and 36.97% (115 people) of drivers did not use seat belts (Table 1).
On urban roads, inattention to the front (n = 86, 65.6%), non-observance of the right of way (n = 42, 32.1%), inability to control the vehicle (n = 36, 27.5%), and sudden change of direction (n = 22, 16.8%) was in the first to fourth ranks, respectively, in the proportion of violations leading to death or injury (Table 2). On suburban roads, non-attention to the front (n = 157, 63.8%), non-observance of the right of way (n = 94, 38.2%), non-observance of the longitudinal distance (n = 63, 25.6%), and turning in the forbidden place (n = 45, 18.3%) were ranked first to fourth, respectively, in the proportion of violations leading to death or injury (Table 3).
| Variables | Death and Injury, No. (%) | Damage, No. (%) | Crude OR (95% CI) | P-Value a | P-Value [Age * Group (Interaction)] b | Adjusted OR (95% CI) | P-Value c | P-Value [Age * Group (Interaction)] d |
|---|---|---|---|---|---|---|---|---|
| Non-observance of the right of priority | ||||||||
| Yes | 42 (32.1) | 36 (23.9) | 1.57 (1.001 - 2.65) | 0.04 | 0.020 | 6.25 (2.80 - 13.98) | < 0.0001 | < 0.0001 |
| No | 89 (67.9) | 120 (76.9) | Ref | NA | NA | Ref | NA | NA |
| Inability to control the vehicle | ||||||||
| Yes | 36 (27.5) | 27 (17.3) | 1.81 (1.02 - 3.18) | 0.03 | 0.044 | 4.05 (1.81 - 8.90) | < 0.0001 | 0.001 |
| No | 95 (72.5) | 129 (82.7) | Ref | NA | NA | Ref | NA | NA |
| Inattention to the front | ||||||||
| Yes | 86 (65.6) | 68 (43.6) | 2.47 (1.53 - 3.99) | < 0.0001 | < 0.0001 | 6.68 (3.27 - 13.61) | < 0.0001 | < 0.0001 |
| No | 45 (34.4) | 88 (56.4) | Ref | NA | NA | Ref | NA | NA |
| Turning in the forbidden place | ||||||||
| Yes | 4 (3.1) | 3 (1.9) | 1.60 (0.35 - 7.03) | 0.54 | 0.113 | NA | NA | NA |
| No | 127 (96.9) | 153 (98.1) | Ref | NA | NA | NA | NA | NA |
| Sudden diversion | ||||||||
| Yes | 22 (16.8) | 9 (5.8) | 3.27 (1.46 - 7.44) | 0.004 | 0.010 | 11.02 (3.79 - 32.00) | < 0.0001 | NA |
| No | 109 (83.2) | 147 (94.2) | Ref | NA | NA | Ref | NA | NA |
| Rear gear | ||||||||
| Yes | 12 (9.2) | 7 (4.5) | 2.14 (0.82 - 5.62) | 0.12 | 0.081 | NA | NA | NA |
| No | 119 (90.8) | 149 (95.5) | Ref | NA | NA | NA | NA | NA |
| The sudden opening of the door | ||||||||
| Yes | 4 (3.1) | 2 (1.3) | 2.42 (0.43 - 13.45) | 0.31 | 0.135 | NA | NA | NA |
| No | 127 (96.9) | 154 (98.7) | Ref | NA | NA | NA | NA | NA |
| Failure to observe the transverse distance | ||||||||
| Yes | 22 (16.8) | 6 (3.8) | 5.04 (1.97 - 12.83) | 0.001 | 0.008 | NA | NA | 0.082 |
| No | 109 (83.2) | 150 (96.2) | Ref | NA | NA | NA | NA | NA |
| Failure to observe the longitudinal distance | ||||||||
| Yes | 6 (4.6) | 3 (1.9) | 2.44 (0.6 - 9.98) | 0.31 | 0.228 | NA | NA | NA |
| No | 125 (95.4) | 153 (98.1) | Ref | NA | NA | NA | NA | NA |
| Move in the opposite direction | ||||||||
| Yes | 3 (2.3) | 2 (1.3) | 1.80 (1.90 - 10.96) | 0.52 | 0.135 | NA | NA | NA |
| No | 128 (97.7) | 154 (98.7) | Ref | NA | NA | NA | NA | NA |
| Forbidden to cross the place | ||||||||
| Yes | 3 (2.3) | 3 (1.9) | 1.19 (0.23 - 6.02) | 0.82 | 0.147 | NA | NA | NA |
| No | 128 (97.7) | 153 (98.1) | Ref | NA | NA | NA | NA | NA |
| Circulation incorrectly | ||||||||
| Yes | 6 (4.6) | 2 (1.3) | 3.69 (0.83 - 1 - 8.32) | 0.11 | 0.085 | NA | NA | NA |
| No | 125 (95.4) | 154 (98.7) | Ref | NA | NA | NA | NA | NA |
Univariate and Multivariable Logistic Regression Model for Injury or Death Due to Traffic Accidents on Urban Roads in Jahrom, 2020
| Variables | Death and Injury, No. (%) | Damage, No. (%) | Crude OR (95% CI) | P-Value a | P-Value [Age * Group (Interaction)] b | Adjusted OR (95% CI) | P-Value c | P-Value [Age * Group (Interaction)] d |
|---|---|---|---|---|---|---|---|---|
| Non-observance of the right of priority | ||||||||
| Yes | 94 (38.2) | 15 (23.1) | 2.06 (1.09 - 3.87) | 0.049 | 0.001 | 2.25 (1.08 - 4.67) | 0.029 | 0.368 |
| No | 152 (61.8) | 50 (76.9) | Ref | NA | NA | Ref | NA | NA |
| Inability to control the vehicle | ||||||||
| Yes | 33 (13.4) | 7 (10.8) | 1.28 (0.98 - 3.05) | 0.075 | 0.008 | 1.86 (1.001 - 4.63) | 0.04 | 0.016 |
| No | 213 (86.6) | 58 (89.2) | Ref | NA | NA | Ref | NA | NA |
| Inattention to the front | ||||||||
| Yes | 157 (63.8) | 31 (47.7) | 1.93 (1.11 - 3.36) | 0.019 | 0.001 | 1.95 (1.08 - 3.51) | 0.025 | 0.974 |
| No | 89 (36.2) | 34 (52.3) | Ref | NA | NA | Ref | NA | NA |
| Turning in the forbidden place | ||||||||
| Yes | 45 (18.3) | 11 (16.9) | 1.09 (0.53 - 2.26) | 0.79 | 0.044 | NA | NA | NA |
| No | 201 (81.7) | 54 (83.1) | Ref | NA | NA | NA | NA | NA |
| Sudden diversion | ||||||||
| Yes | 41 (16.7) | 9 (13.8) | 1.24 (0.57 - 2.71) | 0.58 | 0.030 | NA | NA | NA |
| No | 205 (83.3) | 56 (86.2) | Ref | NA | NA | NA | NA | NA |
| Rear gear | ||||||||
| Yes | 6 (2.4) | 1 (1.5) | 1.60 (0.18 - 13.53) | 0.66 | 0.012 | NA | NA | NA |
| No | 240 (97.6) | 64 (98.5) | Ref | NA | NA | NA | NA | NA |
| The sudden opening of the door | ||||||||
| Yes | 2 (1.3) | 0 (0) | NA | NA | NA | NA | NA | NA |
| No | 154 (98.7) | 65 (100) | NA | NA | NA | NA | NA | NA |
| Failure to observe the transverse distance | ||||||||
| Yes | 21 (8.5) | 225 (91.5) | 5.97 (0.78 - 45.26) | 0.084 | 0.014 | NA | NA | NA |
| No | 1(1.5) | 64(95.8) | Ref | NA | NA | NA | NA | NA |
| Failure to observe the longitudinal distance | ||||||||
| Yes | 63 (25.6) | 11 (16.9) | 1.69 (0.83 - 3.43) | 0.14 | 0.065 | NA | NA | NA |
| No | 183 (74.4) | 54 (83.1) | Ref | NA | NA | NA | NA | NA |
| Move in the opposite direction | ||||||||
| Yes | 2 (0.8) | 0 (0) | NA | NA | 0.044 | NA | NA | NA |
| No | 244 (99.2) | 65 (100) | NA | NA | NA | NA | NA | NA |
| Forbidden to cross the place | ||||||||
| Yes | 3 (1.9) | 0 (0) | 1.02 (0.57 - 3.49) | 0.91 | 0.010 | NA | NA | NA |
| No | 153 (98.1) | 65 (100) | Ref | NA | NA | NA | NA | NA |
| Circulation incorrectly | ||||||||
| Yes | 3 (1.3) | 0 (0) | 1.001 (0.23 - 7.48) | 0.99 | 0.013 | NA | NA | NA |
| No | 154 (98.7) | 65 (100) | Ref | NA | NA | NA | NA | NA |
Univariate and Multivariable Logistic Regression Model for Injury or Death Due to Traffic Accidents on Suburban Roads in Jahrom, 2020
The result of the univariate analysis showed that the non-observance of the right of priority, inability to control the vehicle, inattention to the front, sudden diversion, and failure to observe the transverse distance were associated with death or injury on urban roads (P < 0.05) (Table 2). Meanwhile, failure to yield to the right of way and inattention to the front were associated with death or injury on suburban roads (P < 0.05) (Table 3).
According to the results of multivariate logistic regression analysis, death or injury on urban roads was 11.02 times more likely to be associated with sudden diversion (OR = 11.02, 95% CI: 3.79 - 32.00), 6.68 times with inattention to the front (OR = 6.68, 95% CI: 3.27 - 13.61), 6.25 times with non-observance of the right of priority (OR = 6.25, 95% CI: 2.80 - 13.98), and 4.05 times with inability to control the vehicle (OR = 4.05, 95% CI: 1.81 - 8.90) (Table 2). Meanwhile, death or injury on suburban roads was 2.25 times more likely to be associated with non-observance of the right of priority (OR = 2.25, 95% CI: 1.08 - 4.67), 1.95 times with inattention to the front (OR = 1.95, 95% CI: 1.08 - 3.51), and 1.86 times with inability to control the vehicle (OR = 41.86, 95% CI: 1.001 - 4.63) (Table 3).
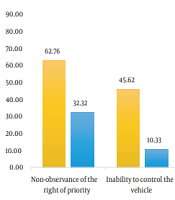
The population attributable risk for human risk factors of death or injury on urban roads were inattention to the front (PAF: 78.84%, 95% CI: 59.82 - 89.21), failure to yield to the right of way (PAF: 62.75%, 95% CI: 36.62 - 80.64), sudden diversion (PAF: 62.73%, 95% CI: 31.91 - 92.21), and inability to control the vehicle (PAF: 45.61%, 95% CI: 18.21 - 68.47) (Figure 2).

Population attributable fraction for injury or death due to traffic accidents on urban and suburban roads due to human risk factors.
The population attributable risk for human risk factors of death or injury on suburban roads was inattention to the front (PAF: 37.73%, 95% CI: 4.85 - 61.55), failure to yield to the right of way (PAF: 32.31%, 95% CI: 2.96 - 55.53), and inability to control the vehicle (PAF: 10.33%, 95% CI: 0.01 - 32.72) (Figure 2).
5. Discussion
This study showed that most at-fault drivers of traffic accidents were men aged 30 - 39. Also, most of the accidents on suburban roads resulted in injuries and deaths in men, which was consistent with the study of Santamariña-Rubio et al. (18). In a study, Cullen et al. (19) found that young men were more at risk of accidents, and the risk persists (remains) with aging. Men also had higher rates for all types of traffic accidents than women, except for those that resulted in hospitalization. In a study, Regev et al. (20) showed that the risk of a traffic accident was highest among 21- to 29-years-old and gradually decreased with age. Young men are more likely to engage in risky/unsafe driving behaviors than women due to consuming alcohol or drugs. These behaviors may be related to the ideals of hegemonic masculinity that encourage the adoption of such unhealthy behaviors (21). On the other hand, the average annual distance traveled by women drivers was too short compared to men. It can be one of the other reasons that can sometimes lead to poor driving skills and the inability of women to prevent traffic accidents. Despite these reasons, female drivers may be more careful when driving with children.
In this study, the seat belt use on urban and suburban roads was 58.18% and 22.50%, respectively. However, in some traffic incidents, when the police arrived at the scene to investigate the cause of the accident, the driver was taken out of the car by emergency medical services (EMS) or people present at the scene, and the seat belt use status of those drivers was unknown. The highest rate of accidents resulting in injury and death was reported by drivers who did not wear (fasten) their seat belts. Hemayatkhah et al. showed that seat belts in drivers and front passengers of light vehicles on Jahrom's urban roads were 60.9% and 37.3%, respectively (22). Several other studies conducted in Iranian cities also showed the driver seat belt use, including 53% in Kerman (23), 84.6% in Golestan province (24), 58.2% in Sistan and Baluchestan province (25), and 68.1% in Kashan (26).
The seat belt use among drivers in the US was reported at 71% in 2000 (27), 75% in 2002, and 80% in 2004 (28). In Australia, 85% of vehicle drivers wore seat belts in 1994 (29). One of the reasons for the high frequency of traffic accidents leading to injuries and deaths in developing countries is the cultural lag in the use of safety equipment, including seat belts, and the lack of adequate restraining laws.
This study showed that inattention to the front and failure to yield to the right of way were the first and second ranks of human factors leading to injury and death in traffic accidents on urban and suburban roads. Also, the PAF for risk factors of death or injury on urban roads was estimated as follows: 78.84% inattention to the front, 62.75% failure to yield to the right of way, 62.73% sudden diversion, and 45.61% inability to control the vehicle. For risk factors of death or injury on suburban roads, PAF was 37.73% for inattention to the front, 32.31% for failure to yield to the right of way, and 10.33% for inability to control the vehicle.
In other studies, the rankings for the causes of injury or death were somewhat different. Bakhtiyari et al. showed that inattention to the front was the leading cause of death in urban areas of Iran (30). Shiri et al. reported that illegal overtaking and the inability to control the vehicle on both the streets and highway axes of Tehran were the highest violations leading to injury or death, in sequence (31).
In the study by Shadmani et al., illegal overtaking was an essential factor in injury or death outcomes (32). Bakhtiyari et al. showed that alcohol consumption significantly increases the chances of injury and fatal accidents in urban areas (33); furthermore, the predominant factor in accidents is driver negligence, which can be due to various reasons such as distraction, monotonous driving, and excessive attention.
The difference between the distribution of causes or factors influencing the occurrence of an accident depends on age, gender, familiarity with the road, the tendency to dangerous behaviors, and driving habits (34). In addition, personality traits can determine driving behavior. Different drivers have different driving styles (35). It can be said that a set of causes with varying impact intensities at other times and places are involved in traffic accidents. The division of traffic accidents according to the age and gender of drivers, cultural level and literacy of people, different seasons of the year, and the quality of roads and cars are the reasons for these differences.
One of the strengths of this study is the use of a large sample size, considering several important risk factors for traffic accidents, and using data recorded by the traffic police collected with reliable tools. Given that there are few similar studies in this field, the findings of this study are essential for policymakers and the traffic police in deciding on traffic accidents.
One of the limitations of this study is that the data in the country's mechanized information and guidance system (FAVA) was limited to accidents at the scene of the accident and did not include deaths that occurred among the injured after 30 days of the accident. Also, the data of the incidents without injuries or the drivers reluctant to report to the police were omitted. Therefore, this study may not include all cases of accidents that occurred during the study period. There is also the possibility of errors in registering information by traffic police staff. It is necessary to consider these details in generalizing the study results.
5.1. Conclusions
The findings of this study showed that, in general, the number of traffic accidents was higher in younger and middle-aged men than in other age and sex groups. Also, not wearing a seat belt in accidents led to more injuries or deaths. The causes of traffic accidents on urban and suburban roads were very similar; inattention to the front and failure to yield to the right of way took the first and second ranks of the events leading to injury and death, respectively. It is suggested to plan effective interventions for cultural reforms according to drivers' individual and social characteristics and to improve deterrence laws to reduce traffic accidents.
