1. Background
Over the past three years, zinc deficiency in adolescents has varied depending on the region and access to healthcare. Globally, zinc deficiency affects approximately 2 billion people, leading to serious issues such as immune dysfunction and growth delays, particularly in developing countries. In the U.S., around 10% of adolescents experienced zinc deficiency in 2021, with a higher prevalence among teenage girls. In Europe, deficiency rates are generally low but can be significant in Eastern Europe and Central Asia. In Asia, particularly in rural and low-income areas, deficiency rates range from 20 - 30%. In Turkey, the prevalence of zinc deficiency is high due to poor nutrition.
The proposed SVM-based system has the potential to transform healthcare by automating the detection of high-risk patients, providing early intervention alerts, and continuously updating with new data to enhance accuracy. Emphasizing these features increases the research's appeal by demonstrating how it can improve efficiency and patient care. This system offers valuable insights for healthcare professionals and researchers interested in AI tools for adolescent health. The ability of machine learning to analyze laboratory results quickly and accurately provides additional benefits such as personalized predictions, early detection, and reduced human error, all contributing to better patient outcomes.
The human body needs micronutrients for healthy functioning (1). Minerals and vitamins are among the most important of these nutrients, and they are essential for growing children. Vitamins are necessary for growth, regulation, and the development of bodily functions, while minerals play a vital role in energy metabolism, growth, and body maintenance. Therefore, maintaining and regularly monitoring the levels of vitamins and minerals in the body is crucial (2).
Zinc is known to be the second most important trace element after iron, playing a key role in ensuring the proper functioning of tissues and organs (2, 3). Zinc is particularly important to monitor in children aged 10 to 18. It is a mineral found in small amounts in plant and animal tissues (4), involved in many biological processes, and plays a crucial role in regulating various body functions.
The World Health Organization (WHO) estimates that approximately 800,000 deaths each year are attributed to zinc deficiency, with over 50% of these deaths occurring in infants and children under the age of 5. It is suggested that the global prevalence of zinc deficiency is around 20% (5, 6). Global rates of inadequate zinc intake, based on data from national food balance sheets, are consistent with this estimate (7). Zinc deficiency tends to be more pronounced in countries with lower energy intake, lower proportions of energy from animal-based foods, and diets with higher molar ratios of phytate to zinc. Notably, there is a positive association between the prevalence of stunting and inadequate zinc intake, although stunting generally exceeds the prevalence of inadequate zinc intake (8).
The healthy development of children and adolescents today is directly linked to their need for zinc, which is an essential part of their diet. Zinc plays a critical role in numerous biological processes and contributes to several important functions, from regulating cellular activity to supporting the immune system (9, 10). However, the rapid growth and development during childhood and adolescence increases the demand for zinc, raising the risk of deficiency.
Studies on zinc have shown that it is essential for children to perform many basic functions, such as growth, pica prevention, managing hypoglycemia, combating diarrhea, fighting infections, wound healing, cell division, and DNA synthesis. It also supports the healthy production of hair and nails and plays a role in sensory and cognitive functions (11-14). Moreover, the need for zinc increases during periods of rapid growth and development, making it crucial to ensure sufficient intake in adolescents. When zinc levels are insufficient, all biological processes that rely on the mineral are disrupted, leading to a range of health problems. Therefore, individuals who do not receive adequate zinc through a balanced diet should undergo appropriate tests to determine their zinc status (15).
In recent years, there has been growing research interest in using artificial intelligence and expert systems to detect vitamin and mineral deficiencies. Among these, machine learning methods have gained popularity due to their capability to analyze large and complex datasets. However, to date, no research has specifically focused on using artificial intelligence to detect zinc deficiency, making this study particularly valuable.
Machine learning is renowned for its ability to process complex data and uncover hidden patterns (16). Since numerous factors influence zinc levels, machine learning is predicted to be highly effective in understanding these complexities and identifying correlations, which is why it was chosen as the methodology for this study. Well-trained machine learning models (17) can achieve high accuracy and predictive power in identifying zinc deficiency by learning from data patterns. Furthermore, by continuously updating the proposed model with new data, its ability to detect zinc deficiency can be improved over time.
The primary objective of this study is to develop a machine learning-based decision support system that can identify zinc deficiency in adolescents earlier and more accurately. This research will focus on the need for zinc using 10 features (age, gender, hydro vit D, LDL cholesterol, iron, ferritin, CRP, calcium, sodium, and phosphorus) as part of an artificial intelligence feature set for children. By identifying individuals with zinc deficiency at an early stage, this study aims to contribute to more effective interventions. The results may help advance child health interventions and provide new insights into detecting zinc deficiency at a young age.
2. Objectives
This study aims to fill a significant gap in the field of children's health by showcasing the potential of artificial intelligence in identifying zinc deficiency. By offering a rapid, sensitive, and scalable solution, this AI-based approach can equip healthcare professionals with valuable tools for early intervention and personalized treatment strategies.
3. Methods
This section provides background information on the key components of the dataset used, an overview of various machine learning algorithms, the performance evaluation metrics applied, and the proposed approach.
3.1. Data Description
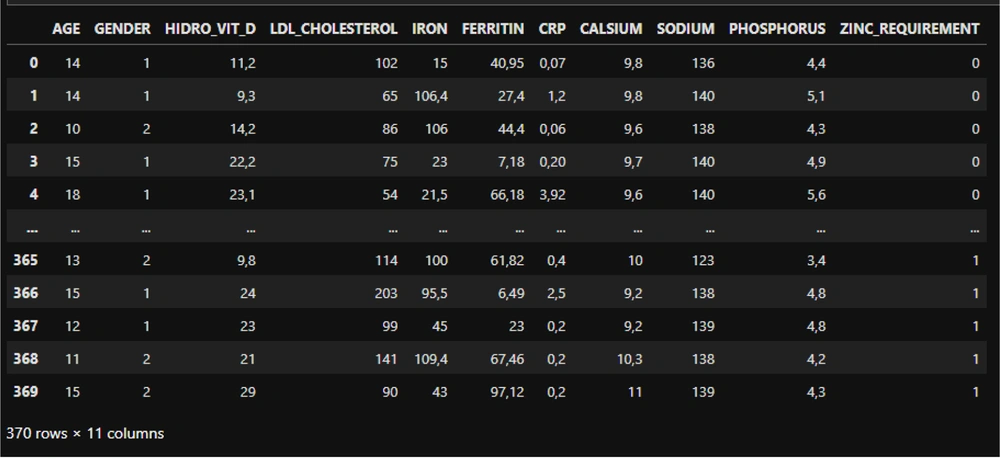
This study is a retrospective, descriptive, cross-sectional, and machine learning-based research aimed at determining zinc levels in children and adolescents aged 10 - 18 years. The data was collected at Dr. Behçet Uz Children's Hospital between 2019 and 2021. The required sample size to ensure a performance accuracy metric of over 90% was determined and included in the study. A total of 370 patients who presented to outpatient clinics with acute problems and had their zinc levels tested were included, as shown in Figure 1. Patients were randomly identified by searching the electronic records system for the years 2019, 2020, and 2021. The search identified 120 patients who had their zinc levels tested in 2019, 112 in 2020, and 138 in 2021, all of whom were included in the study.
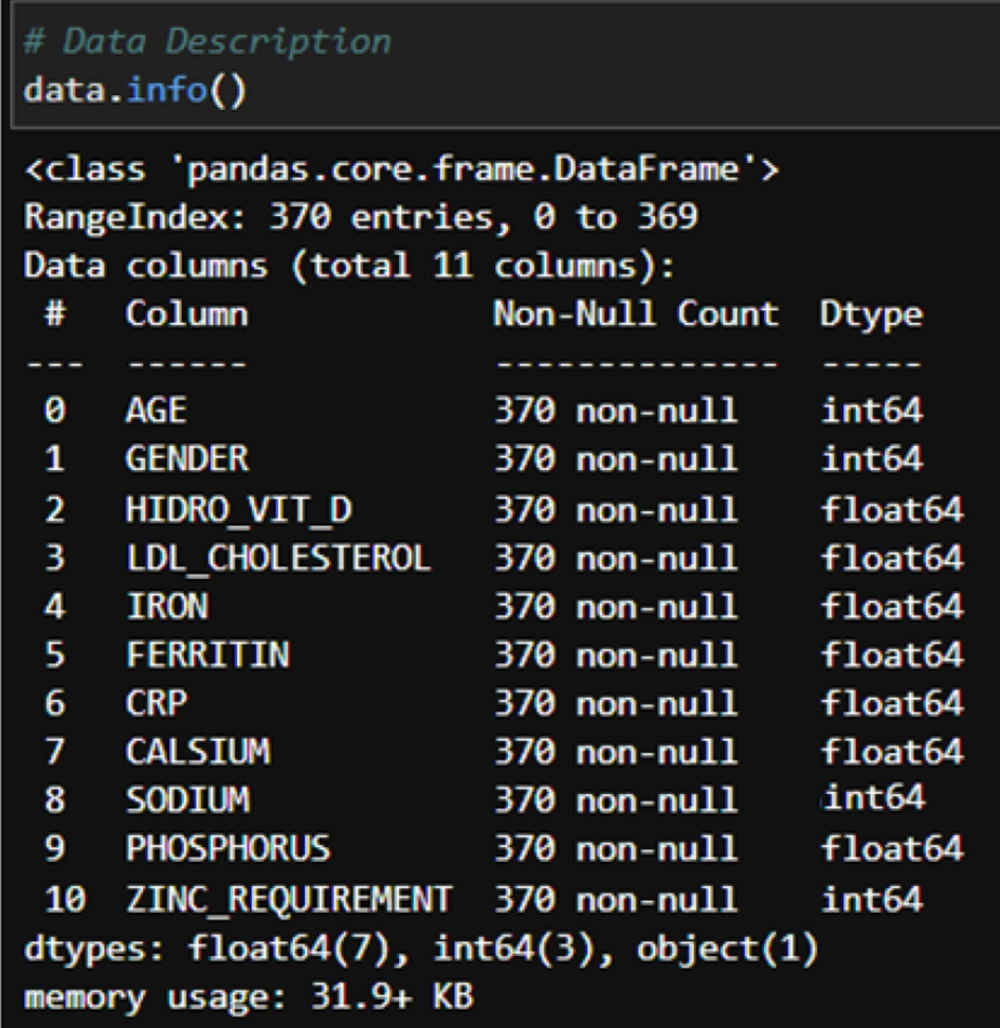
Data were collected using a socio-demographic form and a zinc information form prepared for this purpose, as shown in Figure 2. The socio-demographic form included the children's age and gender. The zinc information form recorded the children's zinc levels, vitamin D levels, LDL cholesterol levels, iron, ferritin, CRP, calcium, and sodium levels. The researchers developed this form based on expert opinions and relevant literature.
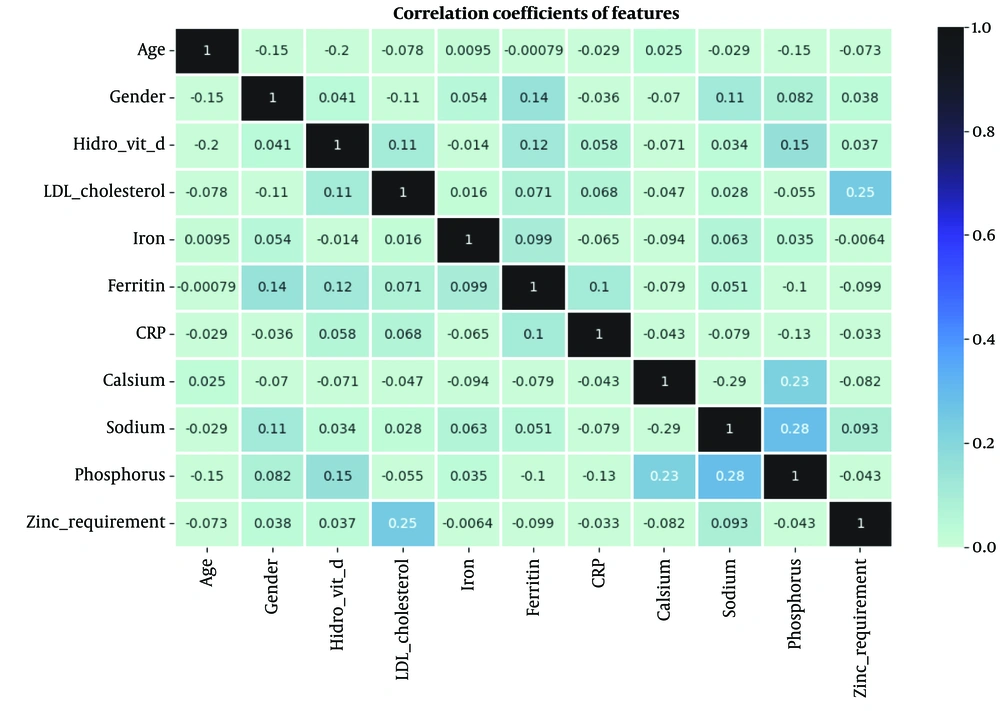
The correlation coefficient graphs of the features help visualize which features are highly correlated, which are independent, and any potential multicollinearity within the dataset. A high correlation between two features indicates that one feature may be used interchangeably with the other, which should be considered during model training. Highly correlated features are undesirable as they may cause the model to overfit. The correlation graph for the data used in this study is shown in Figure 3.
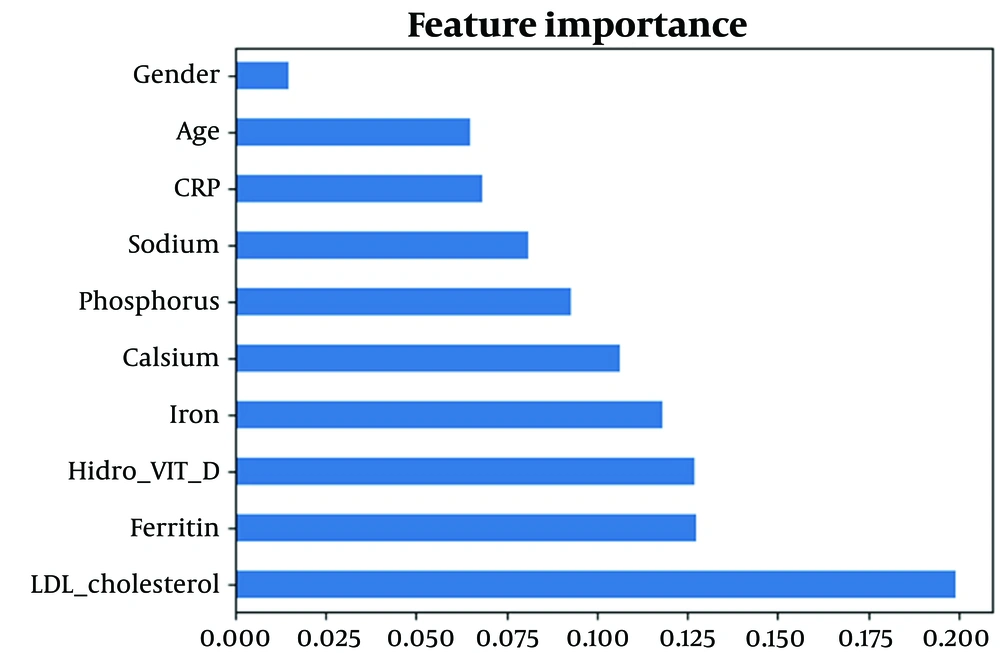
In machine learning, feature importance refers to determining how effectively each feature contributes to a model's predictions. The feature importance graph helps visualize each feature's contribution to the model's performance. In this study, the feature importance values of the model using the random forest classifier are shown in Figure 4.
As shown in Figure 4, based on the random forest classifier, the most important features for detecting zinc deficiency are LDL cholesterol, ferritin, and hydro-vitamin D, while the least important features are demographic factors such as gender and age.
To avoid bias, the researchers systematically reviewed the archives for each year over a two-month period. They then collaborated to jointly decide which patients should be included in the study. The inter-rater agreement between the researchers was found to be 99.9%.
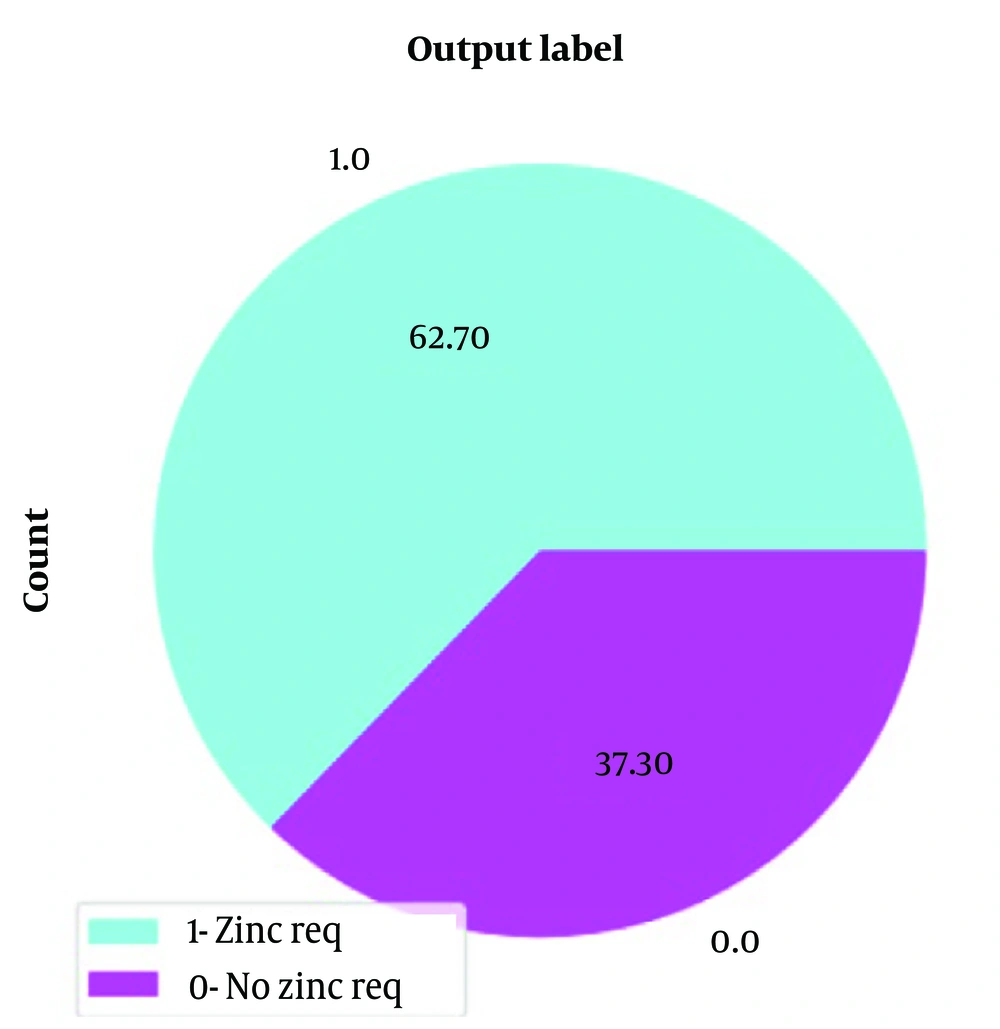
Additionally, in a machine learning application, a balanced distribution of the output variable is essential. For this reason, the distribution of the two classes, those with and without zinc deficiency, as shown in Figure 5, was selected.
Approval to conduct the study was obtained from the relevant university ethics committee. Following this, written permission was obtained from the hospital management to proceed with the research. The study data were provided in compliance with the law on the protection of personal data, with all identifying information such as patient identification numbers, names, file numbers, and protocol numbers removed. All stages of the study adhered to the principles outlined in the Declaration of Helsinki (18).
3.2. Machine Learning Methods
In this study, machine learning models were developed to detect zinc deficiency in children aged 10 - 18 using eight key features: Age, gender, hydro vitamin D, LDL cholesterol, iron, ferritin, C-reactive protein (CRP), calcium, sodium, and phosphorus. These features were selected for their biological significance, either through direct interactions with zinc metabolism or as indicators of broader nutritional and health statuses. Various machine learning models were tested, with support vector machine (SVM) achieving the highest accuracy at 94.6%. Feature importance analysis, conducted via Random Forest, highlighted LDL cholesterol, ferritin, and hydro-vitamin D as the most influential markers. Although age and gender were included, their impact on predicting zinc deficiency was minimal. Overall, the model presents an effective approach to early zinc deficiency detection by leveraging both direct and indirect health indicators.
Cross-validation was used to ensure the robustness of the machine learning models. This technique involved dividing the dataset into subsets, training the model on some and testing it on others, which helped avoid overfitting and improve generalizability. The likely use of k-fold cross-validation provided more reliable performance estimates by averaging results across multiple iterations. This approach minimized bias, ensuring that the SVM model's 94.6% accuracy is robust and applicable to new data.
Table 1 presents the machine learning methods used in this study, along with their descriptions, parameters, advantages, and disadvantages.
| ID | Methods Name | Description | Parameters | Advantages | Disadvantages |
|---|---|---|---|---|---|
| 1. | K-NN | K-NN is used to classify or predict an instance by using the class labels of its nearest neighbors. | The number of neighbors (K) is an important parameter. | Simple and effective. | Computationally expensive for large datasets. |
| 2. | LR | Logistic regression is a linear model used for classification problems. | It can be controlled by parameters like regularization term. | Simple, interpretable, and fast. | Limited in handling complexity. |
| 3. | FOREST | Random Forest classifies by combining many decision trees. | Important parameters include the number of trees, feature selection, etc. | Strong, high generalization, and resistant to overfitting. | Complex internal structure. |
| 4. | SVM | SVM tries to find the best separating hyperplane between two classes. | Important parameters include kernel type, C (error tolerance), etc. | Effective in high-dimensional data, especially successful with limited datasets. | Long training time for large datasets. |
| 5. | TREE | Decision tree is used for classification or regression tasks using a tree structure. | Important parameters include tree depth, minimum sample split, etc. | Easy to understand structures, low data preprocessing requirement. | Prone to overfitting. |
| 6. | LDA | LDA finds axes that best express the difference between classes. | Few default parameters. | Emphasizes differences between classes, provides dimensionality reduction. | Assumes equal covariances between classes by default. |
| 7. | GNB | Probability-based classification algorithm based on Bayes' theorem, assuming independence between features | Few default parameters. | Simple, fast, often successful in tasks like text classification. | Independence assumption may not hold in the real world. |
| 8. | EXTRA | Similar to Random Forest, but selects split points in trees more randomly. | Important parameters include the number of trees, feature selection, etc. | Resistant to overfitting, low variance due to random feature selection. | Complex internal structure. |
| 9. | GRADIENT | A community learning algorithm that combines weak learners (often decision trees) to create a strong model. | Important parameters include learning rate, number of trees, etc. | High generalization ability, successful in many datasets. | May require more training time and tuning. |
| 10. | ADA | Combines weak classifiers to create a strong classifier by focusing on misclassified examples. | Important parameters include the type of weak learner, learning rate, etc. | Resistant to overfitting, high generalization ability. | Sensitive to tuning. |
| 11. | XGB | Tree-based learning algorithm using gradient boosting technique, known for its speed and performance. | Important parameters include learning rate, number of trees, etc. | Fast, high-performance, successful in many data science competitions. | May require more tuning and hyperparameter selection. |
| 12. | BGC | Bagging is a method of improving a model's performance by training on different subsamples. | Important parameters include the type of base learner, sampling strategy, etc. | Resistant to overfitting, low variance | Often depends on the type of base learner. |
| 13. | MLP | A type of artificial neural network with multiple layers that updates weights during the learning process. | Important parameters include the number of layers, number of hidden neurons, etc. | Ability to learn complex relationships, suitable for large datasets. | Long training time for large datasets, tendency for overfitting. |
A decision support system was programmed using commonly applied algorithms in the literature and widely utilized algorithms in the Sklearn library, within a Python environment (20). The parameters for these models were determined experimentally in the working environment. Development was carried out using Python 3 on a Windows 11 operating system with hardware consisting of an Intel i7 processor and 16 GB of RAM.
3.3. Performance Metrics
In this study, the key metrics used to evaluate the effectiveness and performance of the machine learning algorithms include the confusion matrix, accuracy, precision, recall, F1 score, and confidence interval. These metrics are essential for assessing and enhancing the success of the algorithms (17, 21).
3.3.1. Confusion Matrix
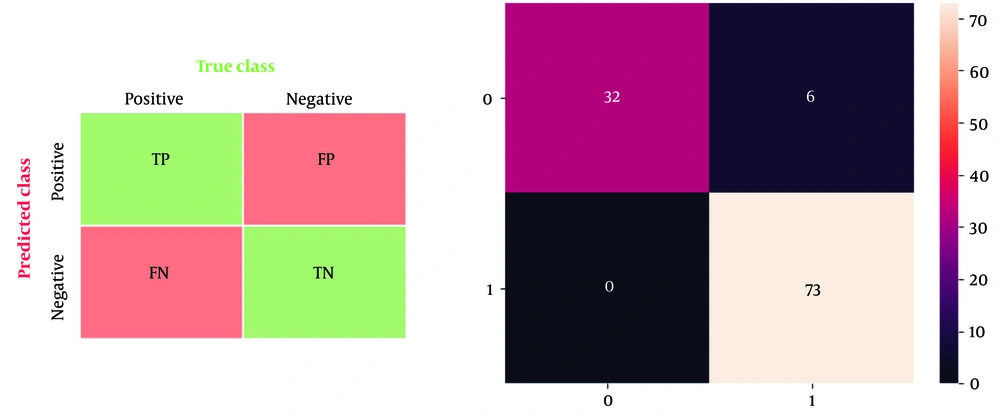
The confusion matrix is a tool that details the accuracy and inaccuracy of the model in predicting true and predicted classes in classification problems. It includes four key terms: True positive, false positive, true negative, and false negative. In our study, the confusion matrix for the SVM method, which demonstrated the highest performance, is presented in Figure 6.
3.3.2. Accuracy
Accuracy is a metric that represents the ratio of correct predictions made by a classification model to the total number of predictions. Simply put, it is the percentage of accurate predictions. The accuracy of a model's performance is calculated using the following equation.
3.3.3. Precision
Precision is a metric that indicates the proportion of positive predictions made by a classification model that are actually correct. It helps assess how frequently false positive predictions are made. For instance, in a machine learning model that predicts a disease, precision answers the question: "Of those predicted to have the disease, how many truly have it?" The precision of a model is calculated using the following equation.
3.3.4. Recall (Sensitivity)
Sensitivity is a key metric for assessing the performance of classification models, particularly in measuring the impact of false negative predictions. In other words, sensitivity evaluates how accurately a model identifies true positives, indicating how many actual positives are correctly detected. It reflects the model’s ability to avoid missing true positives. Sensitivity is also known as "recall" or the "true positive rate (TPR)." The sensitivity of a model is calculated using the following equation.
3.3.5. F1 Score
The F1 score is a crucial metric for evaluating the performance of a classification model, as it measures the balance between precision and recall. It is calculated as the harmonic mean of the precision and recall metrics, providing a single measure that balances the trade-off between false positives and false negatives. By incorporating both precision and recall, as illustrated in the following equation, the F1 score offers a comprehensive assessment of the model's overall performance.
3.3.6. Confidence Interval
A confidence interval represents the range of possible values for a measurement, typically accuracy, and is used to determine that the model's performance lies within a specific range. This interval contains the values at which the measurement is found, given a certain confidence level (e.g., in this study, the confidence level for SVM was measured at 1.000 - 0.882). The confidence interval offers flexibility in estimating the exact value of a measurement and helps assess whether the model's performance falls within a defined range. Mathematically, a confidence interval for a measurement can be expressed as shown in the following equation.
4. Results
The dataset was randomly split into training and testing sets for machine learning using the train_test_split function in the Python environment. The conventional split ratio involved using 70% of the data for training and 30% for testing.
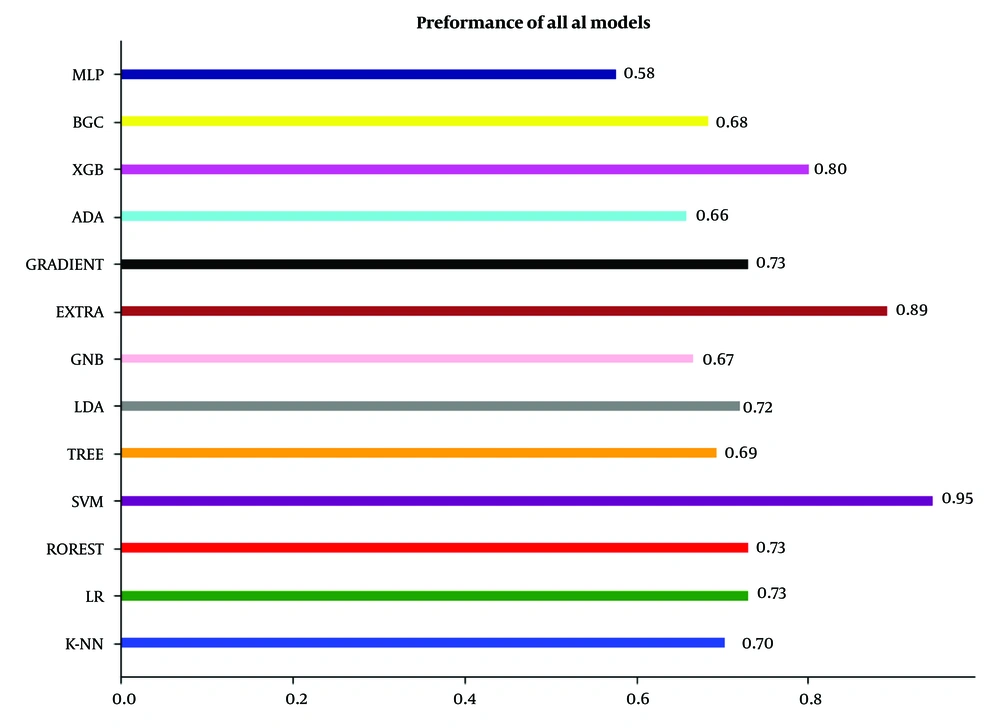
After numerous experimental studies, 13 different methods were tested for the proposed model, with accuracy metrics ranging from 58% to 95%, as illustrated in Figure 7. Some models, such as MLP and ADA boosting, demonstrated low and insufficient performance, while others, such as SVM and Extra Tree, exhibited significantly high performance. During the study, the focus was on fine-tuning high-performance models rather than optimizing parameters for low-performance models. The primary motivation was to identify the best-performing model and make it feasible for integration into a decision support system. As a result, the experimental studies heavily emphasized improving the SVM model.
While the lowest performance was 58% for MLP, the highest accuracy achieved was 95% using the SVM method. Examining these performances demonstrates that machine learning algorithms can be effectively utilized as decision support systems for detecting zinc deficiency, with certain models exhibiting high predictive accuracy. Given its superior performance, the SVM method is recommended as the most effective model for predicting zinc deficiency status.
The results with other performance metrics are presented in Table 2. This table includes accuracy, confusion matrices, precision, recall, F1 score, and confidence interval data for all models.
| Metrics (%) | K-NN | LR | RF | SVM | DTREE | LDA | GNB | EXTRA | GRA | ADA | XGB | BGC | MLP |
|---|---|---|---|---|---|---|---|---|---|---|---|---|---|
| Accuracy | 0.703 | 0.730 | 0.730 | 0.946 | 0.694 | 0.721 | 0.667 | 0.892 | 0.730 | 0.658 | 0.802 | 0.685 | 0.577 |
| Confusionmetrics | [27 - 11] | [18 - 20] | [13 - 25] | [32 - 6] | [33 - 5] | [17 - 21] | [7 - 31] | [34 - 4] | [20 - 18] | [5 - 33] | [34 - 4] | [10 - 28] | [32 - 6] |
| [22 - 51] | [10 - 63] | [5 - 68] | [0 - 73] | [29 - 44] | [10 - 63] | [6 - 67] | [8 - 65] | [12 - 61] | [5 - 68] | [18 - 55] | [7 - 66] | [41 - 32] | |
| Precision | 0.730 | 0.719 | 0.728 | 0.950 | 0.773 | 0.709 | 0.634 | 0.897 | 0.722 | 0.614 | 0.837 | 0.663 | 0.704 |
| Recall | 0.703 | 0.730 | 0.730 | 0.946 | 0.694 | 0.721 | 0.667 | 0.892 | 0.730 | 0.658 | 0.802 | 0.685 | 0.577 |
| F1 score | 0.709 | 0.718 | 0.698 | 0.945 | 0.700 | 0.707 | 0.609 | 0.893 | 0.723 | 0.585 | 0.807 | 0.644 | 0.577 |
| Confidence-up | 0.753 | 0.797 | 0.805 | 1.000 | 0.733 | 0.789 | 0.746 | 0.948 | 0.794 | 0.740 | 0.850 | 0.761 | 0.607 |
| Confidence-down | 0.652 | 0.662 | 0.654 | 0.882 | 0.654 | 0.652 | 0.587 | 0.836 | 0.666 | 0.576 | 0.754 | 0.608 | 0.546 |
Performance Metrics for All AI Models
All performance metrics clearly indicate that the SVM algorithm is the best-performing method, while the lowest values are observed with the MLP method. This suggests that certain algorithms may struggle to adequately learn and select decision boundaries, depending on the nature of the problem and their classification capabilities. One recommended approach to address this is increasing the size of the training data.
To enhance model performance and establish a robust decision support system, several critical steps can be implemented. First, it is essential to investigate why certain models performed poorly, focusing on the characteristics of the dataset and the suitability of the algorithms. Statistical tests, such as paired t-tests or ANOVA, can be employed to determine whether performance differences are statistically significant. Additionally, analyzing feature importance using techniques like SHAP values can help identify the key predictors. Assessing models for overfitting or underfitting by examining learning curves and validation metrics is also necessary. Furthermore, incorporating cross-validation, fine-tuning hyperparameters, and exploring ensemble methods can further enhance model accuracy and reliability.
These steps will provide a more effective and insightful evaluation, leading to broader and more impactful results in future research with larger datasets.
5. Discussion
The aim of this study was to evaluate machine learning algorithms developed using data from 370 children aged 10-18 years, originally collected to detect zinc deficiency. The dataset was randomly divided into training and test sets, and the performance of different artificial intelligence models was compared. The results were as follows:
- Thirteen different methods were tested through various experimental studies, and success rates ranging from 58% to 95% were observed.
- While some models, such as MLP and ADA boosting, exhibited low and insufficient performance, others, like SVM and Extra Tree, demonstrated significantly high performance.
- Throughout the study, the focus was on fine-tuning high-performing models rather than optimizing parameters for low-performing models, an approach that helped avoid unnecessary time expenditure.
- The highest accuracy rate of 95% was achieved by the SVM method, whereas the lowest performance was observed with the MLP model at 58%. This result suggests the potential for integrating the SVM model into a decision support system.
The results demonstrate that machine learning algorithms can be effectively used for zinc deficiency detection, although some models may exhibit low performance. The poor performance of these models can be attributed to their insufficient learning of relationships between selected features or model parameters.
This study serves as a starting point for zinc deficiency detection, but there are several potential areas for improvement that can be addressed in future research. The following aspects should be considered:
- Data set expansion and publication: Using larger and more diverse datasets can enhance model performance. The original data can be converted into an open data format and made available to other researchers for further analysis and exploration.
- Feature engineering: Implementing various feature engineering techniques, including the introduction of new features, may help the model learn more informative patterns, leading to improved overall performance.
- Comparison of different algorithms: Future studies could explore additional machine learning algorithms, such as deep learning, to compare their performance against the models used in this study.
- Application integration: The best-performing model can be integrated into a decision support system and tested in real-world clinical applications.
The discussion can be further strengthened by detailing the clinical implications, such as how the high accuracy of the SVM model could enhance diagnostic precision and patient outcomes. Additionally, the benefits of integrating this model into clinical workflows should be considered. The study's limitations, including dataset biases, issues with generalizability, and performance differences across subgroups, should also be addressed in more depth. Recommendations for future research could include exploring different machine learning models, expanding datasets, and applying advanced feature engineering techniques.
Furthermore, the practical challenges of implementing the SVM model in real-world settings, such as integration with health systems, user training, data privacy, and costs, should be examined. Addressing these aspects will provide a more comprehensive evaluation of the study's impact and guide future research and practical applications.
These suggestions can form the foundation for future research in zinc deficiency detection. Machine learning methods are increasingly being recognized by clinicians as a preferred statistical approach for evaluating laboratory tests and obtaining more meaningful results (22, 23).

