


1. Background
Human cytomegalovirus (CMV), a large double-stranded DNA virus and a prototype member of the betaherpesvirinae subfamily (1), is transmitted in humans via close contact with bodily secretions (e.g., urine, saliva, genital secretions) from infected individuals, transplacental transmission, blood transfusions, and organ transplantation (2). Like other herpesviruses, acute CMV infection is characterized by high levels of viral lytic replication and spread, followed by the establishment of viral latency in long-lived cell types, leading to lifelong persistence (3). In healthy children, primary infection often remains asymptomatic or presents with mild illness such as fever, lymphadenopathy, and hepatosplenomegaly (4). Conversely, in immunocompromised or immunologically immature individuals, it can generate a robust immune response and pose life-threatening risks (5, 6). Additionally, congenital CMV (cCMV) is the most common nongenetic cause of birth defects and developmental disabilities worldwide (7). Emerging evidence suggests that CMV may negatively impact health through its indirect effects on the immune system (8). Specifically, latent CMV infection potentially contributes to age-related diseases (9, 10) and may even be associated with all-cause mortality at the population level (11).
Given the significant global disease burden imposed by CMV, there is a critical need for a comprehensive understanding of CMV infection in children across diverse countries or regions and the implementation of effective preventive strategies. Numerous studies have characterized CMV epidemiology in pediatric populations. However, existing research has mainly focused on cCMV infection or seroprevalence in specific age groups, with limited data on longitudinal trends of CMV shedding and seropositivity across a comprehensive pediatric population at varying risk levels. The COVID-19 pandemic has altered social behaviors and healthcare access, potentially affecting CMV transmission dynamics. To address these gaps, we analyzed CMV infection in 110,477 children in East China, spanning pre-pandemic and pandemic periods.
2. Objectives
The primary objective of this study was to evaluate the prevalence of CMV infection among children by analyzing electronic medical record data.
3. Methods
3.1. Study Population
Between January 2018 and December 2022, children were enrolled based on the following criteria: Individuals under 18 years of age, regardless of symptoms, who underwent testing for CMV DNA or antibodies, including both outpatient and inpatient participants at the Children's Hospital of Zhejiang University School of Medicine. Cases lacking complete demographic or laboratory data were excluded. Participants' ages were stratified into five groups: Under 3 weeks (≤ 3 weeks), 4 weeks to 3 months (4 weeks - 3 months), 3 months to 1 year (3 months - 1 year), 1 to 6 years (1 - 6 years), and over 6 years old (> 6 years). Sample collection aligned with four seasonal periods: Spring (March to May), summer (June to August), autumn (September to November), and winter (December to February), to explore seasonal influences on CMV infection rates.
3.2. Data Collection and Cytomegalovirus DNA Tests
DNA was extracted from fresh urine samples using commercial kits (Sansure Biotech Inc., China) according to the manufacturer's instructions. DNA samples were added to a PCR mixture containing PCR buffer, MgCl2, dNTPs, and Taq polymerase. Real-time fluorescent quantitative PCR was conducted on the ABI7500 instrument (ABI, USA) under the following conditions: 50°C for 2 minutes, 94°C for 10 minutes, followed by 45 cycles of 15 seconds at 94°C and 30 seconds at 57°C. Samples with ≥ 400 copies/mL of CMV DNA were considered positive. Patients with multiple tests and at least one positive result were designated as CMV-positive from the date of their first positive test.
3.3. Antibodies to Cytomegalovirus Detection
Serum anti-CMV antibodies were quantified using a two-step indirect chemiluminescence immunoassay on the iFlash 3000 platform (YHLO, China). According to the manufacturer's criteria, a sample was considered positive for CMV antibodies if it contained CMV-IgM at a concentration of 22 U/mL or greater, or CMV-IgG at a concentration of 14 U/mL or greater.
3.4. Statistical Analyses
A descriptive analysis was conducted to present the numbers and percentages for categorical variables. Pearson’s chi-squared test was used to assess differences in prevalence rates. Ninety-five percent confidence intervals (CIs) were estimated using a binomial exact test. The Cochran-Armitage test was used for prevalence trend analysis. Logistic regression was performed to analyze the independent effect of COVID-19 on CMV infection. Statistical analyses were conducted using R version 4.1.2. Graphs were generated with GraphPad Prism version 9.0. Statistical significance was set at P < 0.05. The cCMV infection was identified by detecting CMV DNA in urine samples within the first three weeks of life via PCR.
4. Results
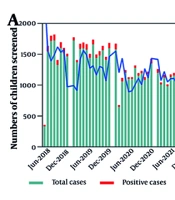
The baseline clinical characteristics of children who underwent urinary CMV (uCMV) DNA testing are outlined in Appendix 1 in Supplementary File. A total of 39,903 children were tested, with 6,643 (16.6%) returning positive results. The median age was 19.0 days. The majority of children enrolled in the study were hospitalized (84.41%), male (56.83%), and ≤ 3 weeks old (52.96%). Table 1 presents the positive rates and 95% CIs for uCMV DNA across various age groups. The age group with the highest prevalence was 3 months to 1 year (67.02%), followed by those 1 to 6 years (37.70%), and 4 weeks to 3 months (23.87%). The overall and age-specific positive rates were significantly lower in 2022 compared to 2018, with the exception of the age group ≤ 3 weeks. Outpatients were significantly more likely to test positive than inpatients. No clear seasonal variation in the CMV DNA positive detection rate was observed (Figure 1A). Seasonal fluctuations in positivity rates were not consistent across age groups. The overall and age-specific positive rates were significantly lower in 2022 than in 2018, except for the age group of ≤ 3 weeks. Furthermore, a clear downward trend over time was evident (Figure 1B). Urine DNA positive rates were significantly lower (P < 0.001) during the pandemic period for the age groups 3 months to 1 year and 1 to 6 years compared to the pre-pandemic period (Figure 1C).
| Variables | ≤ 3 Weeks | 4 Weeks - 3 Months | 3 Months - 1 Year | 1 - 6 Years | > 6 Years |
|---|---|---|---|---|---|
| Overall | 1.13 (0.99, 1.28) | 23.87 (23.04, 24.70) | 67.02 (65.53, 68.48) | 37.70 (35.95, 39.49) | 11.41 (9.91, 13.05) |
| Gender | |||||
| Male | 1.10 (0.92, 1.30) | 23.99 (22.89, 25.12) | 68.54 (66.63, 70.41) | 36.79 (34.46, 39.17) | 10.84 (8.95, 12.96) |
| Female | 1.17 (0.96, 1.41) | 23.71 (22.47, 24.98) | 64.80 (62.43, 67.13) | 38.88 (36.21, 41.61) | 12.24 (9.85, 14.96) |
| P-value | 0.67 | 0.76 | 0.03 | 0.26 | 0.42 |
| Year | |||||
| 2018 | 1.24 (0.96, 1.56) | 24.90 (23.17, 26.70) | 72.61 (69.47, 75.59) | 52.96 (48.72, 57.17) | 18.07 (14.08, 22.64) |
| 2019 | 0.99 (0.75, 1.28) | 24.63 (22.94, 26.37) | 68.10 (64.87, 71.21) | 41.47 (37.91, 45.09) | 8.56 (6.10, 11.61) |
| 2020 | 0.97 (0.67, 1.37) | 25.18 (23.00, 27.47) | 69.41 (65.58, 73.05) | 33.19 (28.97, 37.62) | 11.63 (7.98, 16.18) |
| 2021 | 1.17 (0.83, 1.59) | 24.79 (22.90, 26.75) | 66.79 (63.45, 70.00) | 29.61 (26.04, 33.38) | 10.16 (7.05, 14.04) |
| 2022 | 1.30 (0.93, 1.77) | 19.58 (17.81, 21.44) | 58.93 (55.55, 62.24) | 29.91 (26.05, 33.98) | 9.271 (6.25, 13.12) |
| P-value | 0.53 | < 0.001 | < 0.001 | < 0.001 | 0.0005 |
| Patient type | |||||
| Outpatient | 18.84 (13.75, 24.84) | 37.50 (35.64, 39.38) | 68.18 (66.38, 69.94) | 64.00 (60.18, 67.70) | 14.29 (63.75, 26.22) |
| Inpatient | 0.95 (0.82, 1.09) | 19.16 (18.28, 20.07) | 64.62 (61.95, 67.22) | 30.23 (28.35, 32.16) | 11.31 (9.79, 12.97) |
| P-value | < 0.001 | < 0.001 | 0.03 | < 0.001 | 0.63 |
| Season | |||||
| Winter | 1.14 (0.87, 1.47) | 21.34 (19.81, 22.94) | 65.31 (61.82, 68.69) | 32.21 (28.78, 35.78) | 8.74 (6.29, 11.76) |
| Spring | 0.97 (0.71, 1.29) | 24.10 (22.43, 25.84) | 64.58 (61.54, 67.54) | 40.50 (36.89, 44.18) | 11.06 (8.27, 14.40) |
| Summer | 1.35 (1.06, 1.69) | 24.59 (22.89, 26.35) | 68.96 (66.21, 71.61) | 38.36 (35.00, 41.79) | 11.66 (8.83, 15.01) |
| Autumn | 1.02 (0.77, 1.32) | 25.60 (23.92, 27.33) | 68.43 (65.53, 71.22) | 39.68 (36.00, 43.45) | 15.34 (11.53, 19.81) |
| P-value | 0.24 | 0.002 | 0.08 | 0.005 | 0.05 |
Prevalence and 95% CI of Urine Cytomegalovirus DNA Across Age Groups a
 DNA monthly distributions; and B, temporal trend of positive rates; C, positive rates before and during the COVID-19 pandemic")
A, Cytomegalovirus (CMV) DNA monthly distributions; and B, temporal trend of positive rates; C, positive rates before and during the COVID-19 pandemic
A total of 70,574 children underwent testing for CMV antibodies. Among them, 2,794 (3.96%) tested positive for CMV IgM, and 60,031 (85.06%) tested positive for CMV IgG. The median age of the children was 141.0 days (range: 18.0 to 1,140.0). Notably, hospitalized children (83.20%), males (57.48%), and those ≤ 3 weeks old (27.68%) were more frequently represented in the study (Appendices 2 and 3 in Supplementary File). The CMV-IgM positive cases were predominantly found in children aged 4 weeks to 3 months, hospitalized patients, and boys, representing 51.29%, 76.99%, and 55.19% of the cases, respectively. For CMV-IgG positive cases, children under 3 weeks, inpatients, and boys had the highest proportions at 30.47%, 84.14%, and 57.50%, respectively (Appendix 3 in Supplementary File). Significant differences were observed in age group, patient type, and year between CMV antibody-positive and -negative cases (P < 0.001).
Table 2 presents the positive rates and 95% CIs of CMV IgM across age groups. IgM positivity was highest among children aged 4 weeks to 3 months [11.96% (11.39, 12.56)], followed by those aged 3 months to 1 year [5.95% (5.53, 6.38)], with low positivity in the other three groups. Girls over 1 year were more likely to be CMV-infected than boys of the same age. Children over 3 months had higher CMV detection rates before the pandemic than during it. Monthly incidence rates of CMV IgM from May 2018 to December 2022 are shown in Figure 2A. A significant downward trend in CMV IgM positivity was observed for children older than 3 months (Figure 2B). The positive rates of CMV-IgM were significantly lower in the 1 to 6 years and > 6 years age groups (0.88% vs. 6.19%) during the pandemic than in the pre-pandemic period (0.57% vs. 2.39%) (Figure 2C).
| Variables | ≤ 3 Weeks | 4 Weeks - 3 Months | 3 Months - 1 Year | 1 - 6 Years | > 6 Years |
|---|---|---|---|---|---|
| Overall | 0.20 (0.14, 0.27) | 11.96 (11.39, 12.56) | 5.95 (5.53, 6.38) | 2.79 (2.55, 3.05) | 1.22 (1.01, 1.46) |
| Gender | |||||
| Male | 0.16 (0.10, 0.26) | 12.04 (11.28, 12.84) | 5.93 (5.39, 6.50) | 2.26 (1.98, 2.57) | 0.99 (0.74, 1.29) |
| Female | 0.25 (0.15, 0.38) | 11.86 (11.00, 12.77) | 5.97 (5.33, 6.67) | 3.55 (3.13, 4.00) | 1.51 (1.16, 1.93) |
| P-value | 0.26 | 0.78 | 0.95 | < 0.001 | 0.026 |
| Year b | |||||
| 2019 | 0.23 (0.13, 0.39) | 12.40 (11.31, 13.55) | 6.42 (5.58, 7.35) | 3.61 (3.05, 4.25) | 1.49 (1.01, 2.11) |
| 2020 | 0.16 (0.06, 0.34) | 14.20 (12.83, 15.65) | 6.29 (5.39, 7.29) | 0.80 (0.52, 1.16) | 0.39 (0.16, 0.80) |
| 2021 | 0.18 (0.06, 0.38) | 12.79 (11.42, 14.25) | 6.15 (5.21, 7,21) | 0.66 (0.43, 0.97) | 0.41 (0.18, 0.80) |
| 2022 | 0.18 (0.06, 0.41) | 10.39 (9.06, 11.84) | 5.25 (4.32, 6.31) | 1.15 (0.85, 1.53) | 0.84 (0.51, 1.29) |
| P-value | 0.83 | 0.002 | 0.34 | < 0.001 | < 0.001 |
| Patient type | |||||
| Outpatient | 1.36 (0.28, 3.92) | 16.00 (14.45, 17.65) | 5.12 (4.47, 5.83) | 1.84 (1.46, 2.29) | 1.37 (0.77, 2.25) |
| Inpatient | 0.19 (0.13, 0.26) | 11.12 (10.51, 11.75) | 6.38 (5.85, 6.94) | 3.10 (2.81, 3.41) | 1.19 (0.97, 1.45) |
| P-value | 0.01 | < 0.001 | 0.006 | < 0.001 | 0.72 |
Prevalence and 95% CI of Cytomegalovirus IgM Across Age Groups a
-specific antibodies IgM monthly distributions; B, temporal trend of positive rates; and C, positive rates before and during the COVID-19 pandemic")
A, Cytomegalovirus (CMV)-specific antibodies IgM monthly distributions; B, temporal trend of positive rates; and C, positive rates before and during the COVID-19 pandemic
Figure 3A shows the monthly distribution of CMV IgG antibodies over the five years. The 3 weeks to 1 year age group displayed an annual upward trend (Figure 3B). However, pandemic results indicate no significant difference in positivity rates among the five groups before and during the pandemic periods (Figure 3C). To further examine the independent effects of the COVID-19 pandemic on CMV infection, multivariable logistic regression analysis models were developed. The results are detailed in Table 3. The findings indicate that the COVID-19 pandemic independently contributes to an increase in the prevalence of urine CMV DNA and CMV IgM, while it exerts a negative effect on CMV IgG.
 specific antibodies IgG monthly distributions; B, temporal trend of positive rates; and C, positive rates before and during the COVID-19 pandemic")
A, Cytomegalovirus (CMV) specific antibodies IgG monthly distributions; B, temporal trend of positive rates; and C, positive rates before and during the COVID-19 pandemic
| Variables | OR | 95% CI | P-Value |
|---|---|---|---|
| Multivariate analysis for urine CMV DNA prevalence | |||
| Prepandemic | 1.00 (Reference) | - | - |
| Pandemic | 0.71 | 0.67 ~ 0.76 | < 0.001 |
| Multivariate analysis for CMV IgM prevalence | |||
| Prepandemic | 1.00 (Reference) | - | - |
| Pandemic | 0.71 | 0.65 ~ 0.76 | < 0.001 |
| Multivariate analysis for CMV IgG prevalence | |||
| Prepandemic | 1.00 (Reference) | - | - |
| Pandemic | 1.19 | 1.14 ~ 1.25 | < 0.001 |
Logistic Regression Models for Positive Rates of Urine DNA, IgM, and IgG a
5. Discussion
The study examining the epidemiological characteristics of human CMV, including uCMV shedding and seroprevalence among children, revealed several significant findings. Notably, the prevalence of CMV shedding and antibodies is age-specific, with children aged 3 months to 1 year and 4 weeks to 3 months exhibiting peak prevalence rates. Furthermore, the COVID-19 pandemic significantly affected the positive rates of CMV shedding and CMV IgM, although it did not impact CMV IgG. Studies in China report varying prevalence of cCMV infection, ranging from 0.23% to 6.13% (12, 13). These discrepancies may be attributed to differences in laboratory techniques, the types of samples examined, and the criteria used to confirm cCMV. Urine or saliva samples are suggested for cCMV screening by the international congenital cytomegalovirus recommendations group (14). In this study, a strict methodology was employed to identify cCMV-positive newborns by analyzing urine samples collected within 21 days of birth for screening purposes. The prevalence reported in this study aligns with that observed in a well-conducted multicenter prospective cohort study (1.32%, 84/6350) (13). Moreover, this finding is consistent with a systematic review indicating that average levels of cCMV in low- and middle-income countries (LMICs) are three times higher than those in high-income countries (15). The high prevalence of cCMV cases remains a significant and unresolved public health challenge in LMICs.
To our knowledge, this study represents the largest cohort of data characterizing uCMV shedding among children in China. Overall, we detected CMV DNA shedding in 16.6% of children aged 0 - 18 years and found that the prevalence of uCMV shedding was significantly associated with age. While frequent contact with children under 3 years old is well recognized as an important risk factor for acquiring CMV infection (16), our findings suggest that preschool children may also be an important source of CMV transmission. Both primary and non-primary CMV infections can lead to CMV shedding (17), with primary infection more likely to result in longer duration of shedding and higher viral loads (18). This study identified peak uCMV shedding between 3 months and 1 year of age, declining sharply thereafter, likely reflecting higher primary infection rates and prolonged shedding durations in younger children. Notably, previous research has identified sex-associated differences in uCMV shedding prevalence among children over 6 years of age (17). However, no sex differences were observed in the present analysis across all age groups.
The prevalence of CMV IgG among children varies across populations and demonstrates an age-related increase. A study conducted in Germany indicated that the age-adjusted CMV seroprevalence among children and adolescents aged 1 - 17 years was 27.4%, with rates rising from 21.5% at ages 1 - 2 to 32.0% at ages 14 - 17 (19). Similarly, the seroprevalence was estimated at 29.0% among US children aged 1 - 5 years (20). In contrast, significantly higher seroprevalence rates have been reported in developing European countries, ranging from 50.8% (1 - 5 years) to 70.3% (13 - 19 years) (21). The data, including those from the present study, were obtained from selected diverse populations, encompassing participants at low and high risk of CMV disease in hospital-based settings. Although our findings may not fully represent the CMV status of the general population, they offer valuable insights into the burden of CMV infection in both low- and high-risk populations.
Generally, the transient presence of CMV IgM antibodies indicates a recent infection and is no longer used to distinguish primary infection from viral reinfection (22). Individuals with prior primary CMV infection typically retain lifelong CMV IgG antibodies (22). This persistence may account for the lack of a significant decrease in the IgG prevalence observed during the COVID-19 pandemic. Nevertheless, the observed decline in IgM seropositivity during the pandemic has remained epidemiologically significant. This trend is likely attributable to behavioral modifications (23), including reduced social interactions, enhanced hygiene practices, and decreased exposure to high-risk environments such as daycare centers, which disrupt CMV transmission pathways. Infants aged 4 weeks to 3 months were at the highest risk of recent CMV infection, with IgM seropositivity remaining elevated throughout the first year of life. Notably, the infection rates during the pandemic in this age group were slightly higher than the pre-pandemic levels. This paradoxical trend may reflect increased maternal-infant proximity during lockdowns, potentially amplifying opportunities for transmission. Prolonged breastfeeding may have further contributed to viral exposure (20) and may have lasted longer. These findings underscore the complex interplay between pandemic-related behavioral shifts and CMV transmission dynamics in vulnerable populations.
5.1. Conclusions
In conclusion, our findings provide valuable insights into the epidemiology of CMV infection and offer evidence-based guidance for preventive and management strategies. Universal newborn screening programs can enable early identification of asymptomatic cases. This study highlights the importance of comprehensive longitudinal surveillance data in guiding public health policies and targeted interventions.
