

1. Background
Type 1 diabetes mellitus (T1DM) is the life threatening chronic disease if left without appropriate clinical care and self-management. T1DM usually develops during infancy and adolescence and results from the progressive destruction of pancreatic beta cells and reduced insulin production (1-3). It is estimated that there are almost 500,000 children aged less than 15 years with type 1 diabetes worldwide (4). Based on data from pediatric endocrinology department registries in Armenia in 2017 there were 455 children aged less than 18 years with type 1 diabetes. The prevalence of diabetes has been steadily increasing for the past 3 decades and is growing most rapidly in low- and middle-income countries. Diabetes is an important cause of blindness, kidney failure, lower limb amputation and other long-term consequences that impact significantly on quality of life. In 2012 there were 1.5 million deaths worldwide directly caused by diabetes. It was the eighth leading cause of death among both sexes and the fifth leading cause of death in women in 2012 (5). Diabetes places a burden on family life and daily routine that can be reduced by the proper disease management program. The outcomes of diabetes may be largely determined by the patient and caregiver behavior. People with T1D cope with many factors that often require disruption from child’s usual activities, and with disease-focused behavior which affects quality of life. Extensive research studies are conducted for estimation of pediatric quality of life (PedsQL) in the medical and psychosocial care of children with diabetes. As additional information, PedsQL is also measured based on parents’ perception of child’s state. Alltogether, these PedsQL measurements provide additional information for the physicians and health care experts. Some authors showed that PedsQL is similar in diabetic and non-diabetic children and adolescents; however, optimal glycemic control is associated with better quality of life in diabetic youths. Both diabetic and healthy boys have better PedsQL than girls (6, 7).
2. Objectives
This study aimed (1) to assess the PedsQL of children with type 1 diabetes in Armenia, (2) to examine the agreement between child and parent reports of PedsQL, and (3) to examine the influence of gender on the PedsQL and diabetes management. This is the first study in Armenia aiming to assess the quality of life in pediatric population with T1DM. The results of this study can contribute to a more detailed understanding of how to improve diabetes care and contribute to the policy development related to diabetes care in Armenia. In particular, by understanding the perception of health-related quality of life in a given population of children and their parents, we can improve service delivery and support quality to reduce the burden of children with T1DM.
3. Methods
We conducted a prospective non-randomized cross-sectional study. Children with T1DM were identified from pediatric endocrinology department registries. The onset of diabetes had to be more than 6 months. The age of child at the moment of questionnaire filling had to be 8 - 12 years. All consecutive patients from Armenia aged 8 - 12 years as of 2017 with type 1 diabetes were included in the study. Sample size was determined on convenience basis and did not assume any randomization or stratification. For the study we used the validated adapted PedsQL pediatric quality of life inventory 3.0 diabetes module of child (ages 8 - 12) and parent reports in Russian. Due to Armenia being a member of USSR in the past, most of the population can speak and understand Russian quite well. In case of questions, interviewer translated and explained the question as clearly as possible. Each patient and accompanying parent completed the questionnaire during their consecutive check-up visit in accordance to PedsQL™ Administration Guidelines.
Socio-demographic variables were collected from parents, clinical variables came from medical records, and PedsQL from the questionnaire. Socio-demographic variables were: age, gender, and the family level of education (primary, secondary or university).
Clinical variables analyzed were: time since diagnosis (in years), body mass index (BMI), HbA1c, diet, exercising habits, frequency of hypoglycemia, comorbidity, and insulin injected by child or parent. The hemoglobin HbA1c values were extracted from the medical records. HbA1c levels were recorded as a percentage of the total hemoglobin.
pediatric quality of life inventory 3.0 generic core scale was designed to measure the core patient populations. The GCS included 28 items. The participants rated how much of a problem there has been in the previous month on a five-point Likert-type response scale. (0 = never a problem; 1 = almost never a problem; 2 = sometimes a problem; 3 = of-ten a problem; 4 = almost always a problem). Items were reverse-scored and linearly transformed to a scale ranging from 0 to 100 (0 = 100, 1 = 75, 2 = 50, 3 = 25, 4 = 0).
Children and their primary caregivers were informed about the purpose and methods of the study verbally and through the written informed consent form. Before completing the questionnaires the primary caregivers gave written consent and children their assent.
Data was provided using percentages for categorical variables, means and standard deviations for continuous variables. For categorical variables Pearson’s chi-square test was used. For continuous variables t-test was used. Paired t-test was utilized for assessing QOL between child and parent. Data analyses were done using Excel 2013 and R software.
4. Results
A total of 132 children aged 8 - 12 years with T1DM and their primary caregivers (n = 132, 100% mothers) participated in this study including 60 (45.45%) girls (6.6 ± 2.75 year) and 72 (54.55%) boys (7 ± 1.54 year) (P = 0.318). In the whole cohort of children, 36 (27.27%) presented with comorbidities, 60 (45.45%) exercised regularly, and 48 (36.36%) were on diet. Parents were either uneducated (84 = 63.64%) or had secondary school education (48 = 36.36%). Reported frequency of hypoglycemia had often occurred in 72 (54.55%) children. In most cases insulin was injected by child (84 = 63.64%). The mean age at which T1DM was diagnosed was 6.82 ± 2.17 years, mean height was 135.55 ± 13.97 cm, weight was 33.72 ± 9.32 kg and BMI 17.43 ± 1.83. HbA1C mean level was 8.42 ± 1.5. In comparative analysis by gender we found different rates of comorbidities in boys and girls (36 = 60% in girls and 0 = 0% in boys, P < 0.001); more boys (36 = 50%) were on diet than girls (12 = 20%) (P < 0.001); insulin self-injections were practiced more by boys (60 = 83.33%) than girls (24 = 40%) (P < 0.001). Girls had higher (17.82 ± 1.59) BMI than boys (17.1 ± 1.95) (OR = 0.72; P = 0.021). There was statistically significant difference in mean HbA1C levels by gender: (9 ± 1.78 for girls and 7.93 ± 1.0 for boys P < 0.001). Children who were on diet had higher weight (39.62 ± 7.94 versus 30.34 ± 8.35) (P < 0.001) and BMI (P < 0.001) than children who were not. Children with uneducated primary caregivers hadn’t been on diet compared to children whose mothers had secondary school education (P = 0.0138). Frequency of hypoglycemia was more often reported in children who were not on diet (P ≤ 0.001). Children who had longer years of T1DM (7.5 years) diagnosis did not exercise regularly as children with shorter history of T1DM (6 years) (P < 0.001). Based on our results, we can state that regular exercising has positive effect on HbA1C (7.8 ± 0.82 versus 8.93 ± 1.73) (P = 0.003). However, children who regularly exercised had higher BMI (8.93 ± 1.73 versus 7.8 ± 0.82) (P < 0.001), which can be explained by the fact that they were more instructed to do exercises regularly.
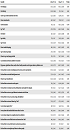
Comparison of QOL mean scores between girls and boys are presented in the Table 1. Girls reported lower QOL mean scores for having stomachache (P < 0.001) and headache (P = 0.009), they more than boys felt hungry (0.019), tired (0.018) and get cranky or grumpy (P < 0.001). They also more than boys complained about difficulties associated with finger pricking (P = 0.033), exercising and doing sport (P = 0.002), and to snack when going “low” (P = 0.002). Girls are more embarrassed by their diabetes treatment than boys (P < 0.001).
| Variable | Girls, N = 60 | Boys, N = 72 | P Value |
|---|---|---|---|
| I feel hungry | 37.5 ± 25.83 | 47.92 ± 24.01 | 0.019 |
| I feel thirsty | 32.5 ± 19.69 | 37.5 ± 24.1 | 0.192 |
| I have to go to the bathroom too often | 52.5 ± 38.15 | 52.08 ± 37.7 | 0.950 |
| I have stomachache | 60 ± 28.07 | 77.08 ± 21.7 | < 0.001 |
| I have headache | 65 ± 34.2 | 79.17 ± 24.82 | 0.009 |
| I go “low” | 47.5 ± 17.65 | 45.83 ± 24.82 | 0.654 |
| I feel tired | 40 ± 28.07 | 52.08 ± 29.89 | 0.018 |
| I get shaky | 70 ± 24.7 | 58.33 ± 34.6 | 0.026 |
| I get sweaty | 72.5 ± 23.78 | 60.42 ± 33.24 | 0.017 |
| I have trouble sleeping | 60 ± 32.29 | 66.67 ± 29.67 | 0.223 |
| I get cranky or grumpy | 27.5 ± 17.65 | 56.25 ± 27.43 | < 0.001 |
| It hurts to get my finger pricked | 70 ± 27.15 | 79.17 ± 20.12 | 0.033 |
| I am embarrassed by my diabetes treatment | 72.5 ± 28.63 | 87.5 ± 16.25 | < 0.001 |
| My spouse, significant other, and/or other family members and I argue about my diabetes care | 82.5 ± 27.73 | 66.67 ± 29.67 | 0.002 |
| It is hard for me to do everything I need to do to care for my diabetes | 67.5 ± 22.69 | 62.5 ± 28.15 | 0.261 |
| It is hard for me to take blood glucose tests | 77.5 ± 23.78 | 54.17 ± 28.77 | < 0.001 |
| It hurts to get insulin shots | 82.5 ± 22.69 | 81.25 ± 29.3 | 0.783 |
| It is hard for me to exercise or do sports | 70 ± 33.45 | 85.42 ± 19.11 | 0.002 |
| It is hard for me to keep track of carbohydrates and make diet changes | 70 ± 31.49 | 54.17 ± 32.23 | 0.006 |
| It is hard for me to carry my diabetes treatment card with me | 72.5 ± 38.15 | 68.75 ± 37.23 | 0.571 |
| It is hard for me to carry a fast-acting carbohydrate | 87.5 ± 20.33 | 68.75 ± 35.79 | < 0.001 |
| It is hard for me to snack when I go “low” | 72.5 ± 32.77 | 87.5 ± 16.25 | 0.002 |
| I worry about going “low” | 60 ± 16.72 | 58.33 ± 31.4 | 0.698 |
| I worry about the insulin effectiveness that I receive | 70 ± 31.49 | 72.92 ± 28.07 | 0.579 |
| I worry about long-term complications from diabetes | 57.5 ± 27.73 | 58.33 ± 33.04 | 0.875 |
| It is hard for me to tell the doctors and nurses how I feel | 80 ± 21.98 | 70.83 ± 28.77 | 0.040 |
| It is hard for me to ask the doctors and nurses questions | 85 ± 20.17 | 75 ± 29.07 | 0.022 |
| It is hard for me to explain my illness to other people | 70 ± 33.45 | 75 ± 29.07 | 0.366 |
QOL Mean Score Comparison Between Gendersa
Boys had lower scores for questions related to getting shaky (P = 0.026) and sweaty (P = 0.017); were hard to take glucose tests (P < 0.001), to keep track of carbohydrates and make diet changes (P = 0.006) and to carry fast-acting carbohydrates (P < 0.001), to tell the doctors and nurses how they feel (P = 0.040) and ask questions (P = 0.022). Boys got more in conflict about diabetes care with family members (P = 0.002).
In Table 2 we provided the results of paired t-test of QOL scores received from children and their mothers for the same question. Interestingly, we found statistically significant differences between the score means for 15 items, where primary caregivers mostly underestimated HRQOL related to their child’s disease. They only overestimated problems associated with finger pricking and insulin shots, whereas children didn’t find it to be hard.
| HRQOL Questions | Children(N = 133) | Parents (N = 133) | P Valueb |
|---|---|---|---|
| 1- Feel hungry | 43.18 ± 25.3 | 49.05 ± 25.92 | 0.068 |
| 2- Feel thirsty | 35.23 ± 22.27 | 51.89 ± 24.44 | 0.000 |
| 3- Have to go to the bathroom too often | 52.27 ± 37.76 | 64.39 ± 27.82 | 0.006 |
| 4- Stomachaches | 69.32 ± 26.14 | 66.1 ± 22.09 | 0.277 |
| 5- Headaches | 72.73 ± 30.18 | 97.92 ± 9.79 | 0.000 |
| 6- Go “low” | 46.59 ± 21.79 | 48.11 ± 15.33 | 0.513 |
| 7- Feel tired | 46.59 ± 29.59 | 53.41 ± 24.47 | 0.045 |
| 8- Getting shaky | 63.64 ± 30.95 | 67.23 ± 21.65 | 0.286 |
| 9- Getting sweaty | 65.91 ± 29.83 | 69.13 ± 26.73 | 0.359 |
| 10- Sleeping trouble | 63.64 ± 30.95 | 70.08 ± 24.01 | 0.051 |
| 11- Getting cranky or grumpy | 43.18 ± 27.47 | 48.3 ± 27.66 | 0.134 |
| 12- It hurts to get finger pricked | 75 ± 23.93 | 67.61 ± 27.76 | 0.006 |
| 13- Embarrassed by diabetes treatment | 80.68 ± 23.85 | 78.6 ± 26.42 | 0.488 |
| 14- Argue about diabetes care with family members | 73.86 ± 29.77 | 86.36 ± 20.57 | 0.000 |
| 15- Hard to do everything for diabetes care | 64.77 ± 25.84 | 73.67 ± 21.91 | 0.003 |
| 16- Hard to take blood glucose tests | 64.77 ± 28.97 | 77.08 ± 23.94 | 0.000 |
| 17- It hurts to get insulin shots | 81.82 ± 26.41 | 73.67 ± 24.58 | 0.021 |
| 18- It is hard to exercise or do sports | 78.41 ± 27.59 | 79.36 ± 23.42 | 0.760 |
| 19- Hard to keep track of carbohydrates and make diet changes | 61.36 ± 32.74 | 67.05 ± 26.27 | 0.142 |
| 20- Hard to carry diabetes treatment card | 70.45 ± 37.56 | 78.22 ± 26.28 | 0.044 |
| 21- Hard to carry a fast-acting carbohydrate | 77.27 ± 31.11 | 83.52 ± 21.36 | 0.050 |
| 22- It is hard to snack when I go “low” | 80.68 ± 26.14 | 78.79 ± 16.49 | 0.458 |
| 23- Worrying about going “low” | 59.09 ± 25.71 | 68.94 ± 24.15 | 0.001 |
| 24- Worrying about the insulin effectiveness | 71.59 ± 29.59 | 79.36 ± 23.63 | 0.013 |
| 25- Worrying about long-term complications from diabetes | 57.95 ± 30.63 | 76.7 ± 24.36 | 0.000 |
| 26- Hard to tell the doctors and nurses how I feel | 75 ± 26.21 | 77.27 ± 20.83 | 0.423 |
| 27- Hard to ask the doctors and nurses questions | 79.55 ± 25.81 | 77.08 ± 27.29 | 0.453 |
| 28- Hard to explain my illness to other people | 72.73 ± 31.11 | 68.18 ± 28.83 | 0.202 |
QOL Scores Comparison Between Children And Parentsa
5. Discussion
Several research studies are conducted to investigate the QOL in children with T1DM. Some of them aimed to identify the difference of QOL between T1DM sufferers and healthy children, some others investigated the influence of different factors on it. A recent cohort study of 2602 diabetic patients with a mean age of 13 years has demonstrated that poor metabolic control defined by HbA1c measurement is associated with worse QOL (5). However, other studies neither found an association between HbA1c and QOL nor detected a negative association (7, 8). We found that HbA1c control can be influenced by parent/guardian and child through appropriate disease management which in turn can increase QOL.
5.1. Conclusions
In our study we identified lower scores of QOL reported by child versus primary caregivers. This interesting finding raises questions related to the reasons that parents underestimate the QOL of their children. Interestingly, other studies found that scores of quality of life by parents are estimated lower on all scales of the questionnaire for children with chronic diseases, except for social functioning. This can be explained by the discrepancy between the parents’ thoughts about the well-being of their children and their subjective self-esteem, as well as the increased demands on the child by the parents. Parents’ had their own perception of the disease and its influence on a child. Usually children are more optimistic: because of their age, they do not take the disease seriously, the likelihood of bad outcomes, which makes it easier to tolerate the disease and adapt to the environment (9). When comparing the QOL of children and their parents with a chronic disease, it was revealed that the scores of QOL by parents are estimated lower on all scales of the questionnaire, except for social functioning (10). Adolescents are more resistant to accepting the disease than younger children because they no longer depend on their parents or guardians for care and are responsible for their own health (11, 12).
In 8 - 12 y/o group of T1DM children girls seem to be more sensitive towards pain and difficulties associated with the disease, boys experience more difficulties related to treatment compliance and parents’ involvement. Based on the assessment of primary caregiver and child attitudes for the same question, we found that primary caregivers mostly underestimate the child’s QOL and disease management problems.
Parents’ education plays significant role in the management of child’s disease and QOL. Psychosocial peculiarities of the given pediatric population also should be considered during interpretation of QOL scores and specifically for understanding the difference in answers reported by parents versus children.
