

Introduction
Benzo[a]pyrene (BaP) is a member of Polycyclic Aromatic Hydrocarbons (PAHs) that their molecular structures include two or more combined aromatic rings with adjacent rings sharing two or more carbon atoms (1). PAHs are produced during the incomplete burning of coal, oil, gas, wood, waste, or other organic materials, such as tobacco and food components and spread in the environment (2, 3).More than 100 PAHs have been recognized in nature, 16 of them were classified as “priority pollutants” according to the U.S. Environmental Protection Agency (EPA). It has been reported that BaP is a proper marker of the occurrence of the carcinogenic PAHs in food and their health outcomes (4-6).
BaP is the only compound in PAHs group with sufficient toxicological evidence to authorize the setting of a guideline (7). Toxicological studies on individual PAHs in animals, principally on BaP, have revealed a variety of toxicological impacts, such as reproductive and developmental toxicity, hematological effects and immunotoxicity (8). International Agency for Research on Cancer (IARC) reported that BaP is carcinogenic to humans (Group 1) (9). Food can be polluted by PAHs that are present in the soil, air or water, as well as those that are formed during thermal food processing or certain home cooking practices such as baking (10, 11).
Based on the studies reported about PAHs exposure, in the non tobacco-smoking and non-occupationally exposed population, food is the major source of human exposure to PAHs, and cereals constitute one of the main causal sources (10-13).
According to the food basket survey in Iran, bread is the most consumed food and the average per capita consumption of bread in a day is 450 g (17). Bread’s contamination by PAHs can be dependent on both the contamination of bakery raw resources, mostly flour, and the baking process. An important subject is also the temperature of this thermal process and its influence on bread’s contamination level (11).
According to the existing regulations set by European Commission, the content of BaP in some foodstuffs and baby foods should not go beyond 1 ng/g (5).
In Iran, a few research have been conducted on determination of BaP in different matrices such as water (drinking water, sea water, surface water and urban runoff) (18-21), soil (22, 23), type of sediments (24-26), atmosphere (27) and plants (28).However there is no information regarding contamination of bread with BaP in Iran. Therefore the aim of this study was to develop a QuEChERS method for the analysis of BaP in bread samples and application of the developed method for analysis of BaP in bread samples.
There is no national procedure for regular monitoring of BaP in foods and there are no regulations laid down for BaP in bread in Iran.
The quantification of trace analytes in complex solid matrices is a critical challenge for analytical chemists (29). Analytical methods have been developed for determination of PAH loads in numerous matrices with the characteristic factor being the mode of sample preparation. Common preparation methods comprise soxhlet extraction, solid-liquid extraction, sonication assisted extraction or accelerated solvent extraction followed by a sample cleanup step using solid-phase extraction or gel permeation chromatography. Nevertheless, these methods are often toil, solvent and time demanding, need advanced analytical expertise and lab apparatus and depend on the utilization of chlorinated extraction solvents. To overcome these challenges, QuEChERS (quick, easy, cheap, effective, rugged and safe) based sample preparation procedures have been used for analysis of PAHs in tea (30, 31), rice (32), meat of animal origin (33),sea urchin (34) and seafood such as mussel, finfish, shrimp, oysters and scallops (35-39).To the best of our knowledge there is no report about the analysis of BaP in bread and cereal products by using QuEChERS method.
The QuEChERS method is based on work done and published by Anastassiades et al (40). QuEChERS was developed using an extraction procedure for pesticide residues in fruits and vegetables. This method uses a single-step buffered acetonitrile (MeCN) extraction and salting out liquid-liquid partitioning from water in the sample with MgSO4. Dispersive-solid-phase extraction (dispersive-SPE) cleanup is used to remove polar matrix elements, organic acids, excess water, and other components with a mixture of primary secondary amine (PSA) sorbent and MgSO4; afterward the extracts are analyzed by means of mass spectrometry (MS) techniques following a chromatographic analytical separation (35, 40, 41). The stream-lined nature of the QuEChERS procedure has resulted in its application in the analysis of veterinary pharmaceuticals, mycotoxins, phthalates and oil dispersion surfactants (35). To the best of our knowledge analysis of BaP by QuEChERS method has not been reported in bread in the scientific literature presented till the date.
The main objective of this study was to develop a method using QuEChERS method for determination of BaP in bread samples by GC-MS.
Experimental
Sample collection
Industrial bread samples (Senan) and Sangak breads (a traditional bread in Iran) were collected from 26 supermarkets and 3 bakeries in Tehran, respectively. All of the samples were prepared from wheat flour. All samples were covered with aluminum foil in order to prevent photo degradation and then transported to the lab. Each sample was separately cut into small pieces and then blended. After mixing, the samples were stored in amber glass bottles with Teflon-lined caps at -20˚C until extraction process.
Chemicals
Standard concentrations of Ba Pand Anthracene-d10 (ISTD) were prepared from Sigma Aldrich (St. Louis, Mo., U.S.A.). All solvents including, acetone, acetonitrile, ethyl acetate, toluene, methanol and isooctane were purchased in HPLC grade from Merck (Darmstadt, Germany). Anhydrous MgSO4 and sodium chloride were obtained from Chem Lab NV, Belgium and Primary Secondary Amine (PSA) SPE Bulk Sorbent was purchased from Varian, Italy. Ultrapure water was obtained using a water purification system (Econolab, Oklahoma, U.S.A.).
Preparation of standards
BaP and Anthracene-d10 stock solutions were prepared by weighing exactly 5 mg of each standard, dissolved separately in 5 mL of toluene. Stock solutions of the BaP and Anthracene-d10 were made at 1000 μg/mL in toluene. Intermediate standard solutions of BaP (in acetone) included concentrations of 10000, 1000 and 100 ng/mL and intermediate standard solutions for Anthracene-d10 (in acetone) included concentrations of 10000 and 1000 ng/mL. Bread samples were spiked with calibration standards in acetone at the following concentrations: 500, 250, 125, 50, 25, 12.5, and 5 ng/mL. For this purpose, 200 µL of each standard stock solution was added to 5 g of blank bread samples. An aliquot of 50 μL of Anthracene-d10 solution in acetone (1000 ng/mL) was added to the spiked bread sample as internal standard.
All standard solutions were prepared in amber color volumetric flask (to avoid light exposure) and stored at 4˚C whenever not in use. The samples so obtained were treated as described in sample preparation section.
QuEChERS Sample preparation
The QuEChERS method developed for analysis of pesticide by Anastassiades et al [40], was used with some modifications for the analysis of BaP in bread. The extraction procedure was as follows: (1) To 5 g sample weighed into a 50 mL “PAH free” centrifuge tube was added (2), 50 μL of the ISTD solution (1000 ng/ml), followed by (3), addition of 5 mL deionized water, and then (4), 10 mL acetone and the mixture was shaken with a vortex for 60 s (mini vortexer, Heidolph Germany). Also (5) 6 g MgSO4 and 1.5 gNaCl were added and immediately hand-shaken and vortex-shaken for 30 s. (6) The tube was centrifuged at 4000 RPM for 5 min (Hettich, Universal 320 R Centrifuge); (7) the whole acetone extract was transferred to a dSPE cleanup tube containing 400 mg PSA and 1200 mg MgSO4 and vortex-shaken for 30 sec. (8) The dSPE tube was centrifuged at 4000 RPM for 5 min, then (9), 6 mL of the extract was transferred into a 10 mL amber vial and dried under gentle nitrogen flow at ambient temperature. (10) The dried extract was re-dissolved in 100 µL acetone and vortex-shaken for 30 sec and sonicated for 60 sec (Euronda S.P.A, Itly) and finally, (11) the extract was transferred to an amber GC vial.
Gas Chromatography-Mass Spectrometry Conditions
BaP analysis was conducted using an Agilent 7000-Triple-Quad mass spectrometer coupled with 7890 A gas chromatography. Separation of PAHs was performed using a 5% phenyl-methyl siloxane (HB-5MS) bonded-phase fused-silica capillary column (Hewlett-Packard, 30 m × 0.25 mm i.d., film thickness 0.25 μm). The carrier gas was helium (purity 99.9995 %) which was further purified by passage through a helium gas purifier Agilent model RMSH-2. The injection port was run in splitless mode and the injection volume was 2 μL. The oven temperature program was 80˚C for 1.5 min, raised to 290˚C at a rate of 50˚C/min and maintained at this temperature for 10 min and the total run time was 15.2 min. The MS transfer line and ion source temperatures were adjusted at 290˚C and 230˚C, respectively. GC-MS was performed in EI mode. The mass spectra were collected by electronic impact at 70 eV. Detection of BaP and ISTD was carried out using SIM mode. The following ions were monitored: m/z 252 (for BaP) and m/z 188 (for ISTD). Determination was done based on the ratio between the peak areas of BaP to that of the ISTD. The Quantifier ions and qualifier ions masses (m/z) are shown in Table 1.
Table 1Quantifier ions and qualifier ions used in the selected ion-monitoring of BaP and Anthracene-d10 by gas chromatography-mass spectrometry
| Compound | Quantifier ion | Qualifier ion |
|---|---|---|
| BaP | 252 | 253, 250, 126 |
| Anthracene-d10 | 188 | 189, 187, 160 |
Method validation
For method validation, the parameters assessed were linearity, limit of detection (LOD), limit of quantification (LOQ), recovery and precision.
For construction of spiked calibration curve, spiked bread samples at concentration levels of 0.5, 2, 5, 8, 10 and 20 ng/g were prepared in triplicates and then treated according to the procedure described previously. The recoveries were calculated for spiked samples at three levels (1, 3 and 16 ng/g) using the spiked calibration curves.
Results
The development of QuEChERS extraction procedure required the evaluation of the influence of different parameters on BaP extraction efficiency such as extraction solvent, shaking time and influence of the elapsed time after addition of the salts.
Method optimization
Extraction Solvent
Several experiments were performed in order to select the best extraction solvent. Acetonitrile, ethyl acetate and acetone were tried. The results obtained are shown in Table 2. Acetone was found to be the most suitable extraction solvent for BaP.
Table 2Effect of different extraction solvents on the average recoveries percentage (n = 3) and repeatibility (RSD %) of BaP analyzed in bread samples using QuEChERS method and GC-MS
| Extraction solvent | Acetonitrile | Ethylacetate | Acetone |
|---|---|---|---|
| Recovery ± RSD (%) | 54.96 ± 27.92 | 49.15 ± 3.18 | 111.18 ± 24.08 |
Extraction time
The effect of shaking time on the BaP extraction efficiency was studied. Initial vortex shaking for 1 min followed by 25 min of vibration shaking was used to achieve the maximum extraction yield. The results revealed that no significant improvement could be achieved after 25 min of agitation with vibrating motion. Therefore one min of manual shaking was selected as optimum extraction time.
Influence of the elapsed time after adding the salts
Increasing the elapsed time after the addition of 6 g MgSO4 and 1.5 g NaCl, up to one hour did not change the efficiency of BaP extraction. Therefore, the samples were treated immediately after adding the salts.
Method validation
Linearity. Spiked calibration standards at levels of 0.5, 2, 5, 8, 10 and 20 ng/g were prepared by the addition of 200 μL of 12.5, 50, 125, 200, 250 and 500 ng/mL standard stock solutions to 5 g of blank bread samples in each case.
Quantification of the BaP in bread samples was performed by using an internal standard method. Calibration curves showed a linear relationship between the concentration and peak area ratios, with a correlation coefficient of 0.997. Table 3 shows the values of the Validation parameters for BaP quantification.
LOD and LOQ. The value of estimated LOD was 0.3 ng/g. Recovery and precision in spiked samples at levels of 0.5 and 1 ng/g were 119.9 ± 0.90 and 119.2 ± 3.68, respectively. Therefore, the value of LOQ was determined as 0. 5 ng/g.
Recovery. The extraction recoveries were determined by applying the full procedure to triplicate samples in three days at three spiking levels including 1, 3 and 16 ng/g. The extraction recovery was expressed as recovery percentage. Proper recoveries (110.5-119.85%) of BaP from spiked samples were obtained, which were in the acceptable range of European Commission's regulation (42). The values of recovery percentage are presented in Table 4.
Precision. The values obtained for RSD% were less than 11.68 %. Table 4 shows the calculated RSD % for each spiking level which were below the RSDR (22 %) determined by European Commission.
The HorRAT value, i.e., HoR = RSDR (measured)/predicted RSDR (Horwitz), gives a comparison of the actual precision measured with the precision predicted by the Horwitz equation. A HorRAT value of 1 usually indicates satisfactory interlaboratory precision, whereas a value > 2 usually indicates unsatisfactory performance of the method (43).
In this study, the obtained HorRAT values, ranging from 0.4 to 0.5, confirmed satisfactory interlaboratory precision.
Table 4BaP recoveries ± RSD (%) for homogenized bread samples using the optimized QuEChERS method at three spiking levels (n = 3
| Spiking levels (ng/g) | 1 | 3 | 16 |
|---|---|---|---|
| Recovery ± RSD (%) | 119.22 ± 0.77 | 119.85 ± 9.3 | 110.5 ± 11.68 |
Application of the optimized method-analysis of unknown bread samples
To establish the capability and the suitability of the developed method, a variety of bread samples were analyzed for the presence of BaP. BaP was not detected in 26 industrial bread samples (Senan bread), but 2 out of 3 Sangak bread samples were contaminated at the levels of 2.73 and 3.19 (ng/g of wet weight) which is higher than the permissible limit of European Commission regulatory control value for BaP (1 μg/ kg of wet weight) in processed cereal-based foods and baby foods for infants and young children (44). The results are presented in Table 5. Figures 1 and 2 show the chromatograms obtained for industrial and traditional bread samples, respectively.
Three Sangak samples were analyzed to evaluate the practicality of the method. Considering the few Sangak samples analyzed in this study, a comprehensive survey for monitoring of BaP in Sangak bread samples seems to be needed.
Table 5Incidence, mean, median and maximum levels of BaP in bread samples
| Bread type | Incidence (%) | Mean | Median | Maximum |
|---|---|---|---|---|
| Traditional bread (Sangak) | 66.66 | 1.97 | 2.73 | 3.19 |
| Industrial bread (Senan) | ND* | - | - | - |
Not detected
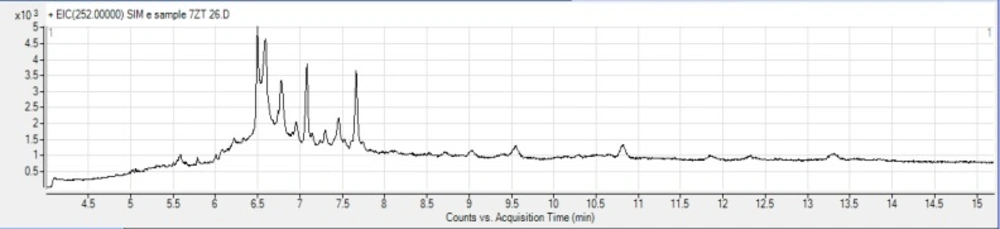
Figure 1.
GC-MS chromatogram of BaP in industrial bread sample
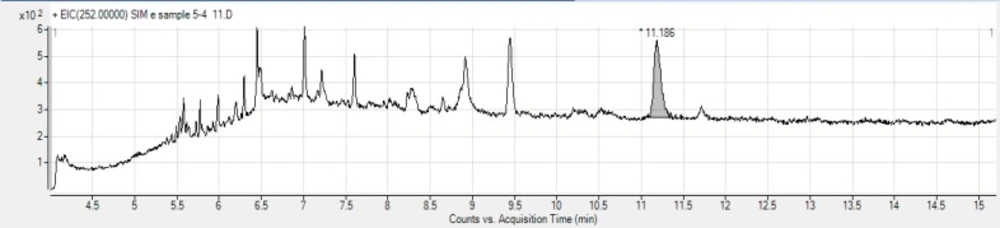
Figure 2
GC-MS chromatogram of BaP in Sangak bread sample
Discussion
QuEChERS method was first introduced by Anastassiades and coworkers for extraction and cleanup of pesticide residues in fruits and vegetables. This method uses a single-step buffered acetonitrile (MeCN) extraction and salting out liquid-liquid partitioning from the water in the sample with MgSO4. Dispersive-solid-phase extraction (dispersive-SPE) cleanup is used to remove polar matrix elements, organic acids, excess water, and other components with a mixture of primary secondary amine (PSA) sorbent and MgSO4; afterward the extracts are analyzed by means of mass spectrometry (MS) techniques following a chromatographic analytical separation (35, 40 and 41).
As per the scientific literature available till the date, analysis of BaP by QuEChERS has not been reported in bread.
Different extraction methods such as Soxhlet apparatus and solid-phase extraction have been used for analysis of BaP in bread (13-16).Comparison of the proposed QuEChERS method with other methods for extraction and determination of PAHs in bread is shown in Table 6.
Table 6Comparison of the proposed QuEChERS method with other methods for extraction and determination of BaP in bread
| Authors | Extraction method | Detection system | LOD (ng/ml) | LOQ (ng/ml) | DLRb (ng/ml) | ISTD | r2 | Recovery | R.S.D.% | VLa (mL) | Extraction solvent | Ref. |
|---|---|---|---|---|---|---|---|---|---|---|---|---|
| Ahmed et al | Soxhlet apparatus | GC-FID | - | - | - | - | - | 82 | 6.7 | > 400 | n-hexane | (16) |
| Rey-Salgueiro et al | solid–liquid extraction (SLE) | (LC-FD) | 0.02 | 0.07 | 0.02-40 | - | ≥0.999 | 103 | 5 | >40 | n-hexane | (14) |
| Al-Rashdan et al | Soxhlet apparatus | GC-MS | 0.1 | 0.3 | 100– | d-PAHs | >0.995 | 82.39 | 4.99 | >175 | hexane | (15) |
| Orecchio and Papuzza | Soxhlet | GC-MS | 0.015 | 0.05 | 100–2000 mg/l) | d-PAHs | 95 | 7-25 | >80 | pentane | (13) | |
| Ciecierska and Obiedziński | GPC | HPLC-FLD/DAD and Confirmation by GC/MS | 0.12 | 0.24 | 1-50 | - | 0.999 | 106 | 5.1 | >150 | hexane/acetone, | (11) |
| Eslamizad et al | The proposed method | GC-MS | 0.3 | 0.5 | 0.5-20 | d-PAHs | 0.997 | 114.7 | <14.5 | 10 | Acetone | This study |
Liquid-phase volume
Dynamic linear ranges
Compared to the other methods shown in Table 6, the extraction time of our method is shorter than most of the other methods. The extraction solvent which is used in the method presented in this study is less toxic compared to the solvents used in the other methods. The proposed method needed less extraction solvent. Some of the reported methods (Soxhlet, SPE and SLE) need special equipment for extraction and are more expensive compared to the QuEChERS method presented in this study. In the methods which Soxhlet, SPE and SLE are used the extraction time is longer than our method. Recovery of the proposed method is better than Soxhlet method (15, 16) and is comparable with that of the other methods.
In our proposed method, acetone is used as extraction solvent, which is more volatile than other extraction solvents used in the other methods (11, 13-16), therefore, less time is needed in this method for drying the samples.
Major advantages of the developed method are the simplicity of operation, the rapidity to achieve a very high sample throughput and low cost. Thus, the proposed method represents simple and low-cost alternative to the conventional methods and is suitable for screening and quality control programs in food studies.
To the best of our knowledge, there are only few reports for determination of PAH pollution in bread. Tawfic et al. (16) reported that BaP concentration in mazot, solar, solid waste and electricity operated bakeries had an average of 20.6, 14.7, 45.1 and 4.4 µg kg-1, respectively. Results show that the samples collected from mazot, solar and solid waste operated bakeries have had a wide spectrum of PAHs, in comparison to the bread samples collected from electricity operated bakeries. Estimated daily intakes of PAHs via bread consumption were 48.2, 28.5, 80.1, and 4.8 mg per person per day for bread produced in bakeries using mazot, solar, solid waste and electricity, respectively. Meanwhile, the estimated daily intakes of BaP were 3.69, 2.65, 8.1, and 0.81 mg per person per day for bread sample baked with mazot, solar, solid waste and electricity, respectively.
Rey-Salgueiro et al. (14) reported the BaP concentration in 3 of 24 selected samples (Commercial toasted bread samples) in a range of 0.13-0.23 µg/kg.
In Kuwait, Al-Rashdan et al. (15) reported no detectable amount of BaP in most of samples of bread baked from white wheat flour. The concentration of BaP in Five samples exceeded the legal permissible limits (1 μg/kg) proposed by the European Union for processed cereal-based foods (44). In their investigation, the original white wheat flour was analyzed in parallel to the toasted white bread and BaP was not detected in white flour, supplied by the Kuwait Flour Mills and Bakeries Company.
BaP in bread samples baked from brown wheat flour was detected in one sample and found to be equal to11.13 μg/kg. The level of BaP in Sandwich breads baked from white wheat flour was in the range of 2.83-9.04 μg/kg in 2 of the 3 samples (15).
Dennis et al. (45) reported less than 0.1 μg/kg of BaP in white flour, although they reported 2.2 μg/kg in cereal-derived products enriched with high levels of edible oils.
Orecchio and Papuzza (13) showed carcinogenic PAHs, expressed as BaP equivalent ranged from 1.1 to 26 µg/kg dry weight.
In samples of bread baked using wood as fuel, concentrations of BaP ranged from 0.13 to 9.4 µg/kg d.w (dry weight). Five out of 15 samples exceeded the legal limits (1 µg/kg) proposed by the European Commission for processed cereal-based foods (44).
Conclusions
To the best of our knowledge, this is the first time that a QuEChERS method is used for the analysis of BaP in bread samples. The developed QuEChERS method offers an efficient, cost effective, and easy sample preparation procedure for the determination of BaP in bread. Comparing with the other extraction methods used for analysis of BaP in bread, this extraction method is rather simple and cheap. The method is advantageous in terms of total solvent utilization and also the extraction solvent is less toxic. The use of spiked calibration curves for constructing the calibration curve substantially reduced adverse matrix-related effects. This method is cheaper than the conventional method practiced for extraction of BaP from food matrices.
Correlation coefficient, recovery percentage, and precision were within the standard EU No 836/2011 (42) in this study, which indicate the reproducibility and accuracy of the extraction method.
Moreover, the results of this study revealed that PAHs may often be contained in breads, representing the need to develop and introduce efficient procedures to prevent more severe PAHs contamination in bread in the future.
The preliminary results showed that the Sangak bread samples could be contaminated with BaP and therefore routine monitoring of BaP in traditional bread samples seems to be necessary.
