
Introduction
Apoptosis or programmed cell death is vital in eukaryotic organisms (1). However, dysregulation of this process can cause many diseases in human such as autoimmune disorders, stroke, neurodegenerative diseases and cancer (2).
Caspases (Cystein-dependent aspartyl proteases) have been identified as the key enzymes in initiation and execution of apoptosis (3). Two different groups of enzymes from caspase family are involved in apoptosis. The first group including caspase 2, 8, 9 and 10 are upstream regulators and activate caspases of second group (3, 6 and 7), which are the major effectors caspases in apoptosis (4).
Caspase-3, one of the dominant effectors caspases, is activated in almost every model of apoptosis with various signaling pathways. Hence, inhibition of caspase-3 has become an attractive target in the treatment of neurodegenerative diseases including Alzheimer’s, Huntington’s and Parkinson’s diseases in which excessive neuronal apoptosis occurs (5-6).
Our strategy is to identify potent caspase-3 enzyme inhibitors and study the quantitative relationship between their inhibitory activities and structures. The results of this study can provide useful chemical visions for designing new capase-3 inhibitors. Quantitative structure–activity relationship (QSAR) studies play a critical role in the rational drug design. The main aim of QSAR study is to develop quantitative models to predict biological activity of compounds (7-8). Through the years different methods were used to build QSAR models capable of accurate prediction of biological activity of compounds (9-10). In this study, we employed the stepwise (SW) selection method for the variable selection in the multiple linear regression (MLR) method. The aim of this study is to search for an efficient method to build an accurate quantitative relationship between the molecular structure and the caspase-3 inhibitory activity of some 1, 2-benzisothiazol-3-one derivatives.
Methods and data
Data set
A series of potent 1, 2-benzisothiazol-3-one derivatives (53 compounds) with experimental biological activities, which were reported by Liu et al. and Wu et al., was taken for the study (11-12). All the biological data expressed as IC50 were converted into pIC50 (-log IC50) values. The total set of molecules was randomly separated into a training set (43 compounds) for generating QSAR model and a test set (10 compounds) for validating the quality of the model. The general chemical structures and biological activity values of all of the compounds are shown in Table 1.
Table 1Chemical structures and the corresponding observed and predicted pIC50 values by SW-MLR method.
Molecular descriptors and geometry optimization
The chemical structures of the molecules were built using the Hyperchem 8.0 software (version 8.0; Hyperchem, Alberta, Canada) (13). The pre-optimization was conducted using the molecular mechanics force field (MM+) procedure included in Hyperchem, and then semi-empirical method AM1 using the Polak–Ribiere algorithm was applied to optimize the molecules geometry. DRAGON software was used to calculate the descriptors among a total of 1200 molecular descriptors, belonging to different types of theoretical descriptors such as constitutional descriptors, topological descriptors, molecular walk counts, BCUT descriptors, Galves topological charge indices, 2D autocorrelations, charge descriptors, aromaticity indices, Randic molecular profiles, geometrical descriptors, 3D-MoRSE descriptors, WHIM descriptors, GETAWAY descriptors, empirical descriptors (14). The calculated descriptors were first analyzed for the existence of constant or near constant variables. The detected ones were then removed. Secondly, the descriptors correlation with each other and with the activity (pIC50) was of the molecules was examined and the collinear descriptors (i.e. correlation coefficient between descriptors is greater than 0.9) were detected. Among the collinear descriptors, the one exhibiting the highest correlation with the activity was retained and others were removed from the data matrix. And finally 363 descriptors were remained.
Results
For the selection of the most important descriptors, stepwise method-based MLR was used. According to the rule of thumb, at least five compounds should be included in the equation for every descriptor. To investigate the optimum number of descriptors to be used in the equation, a graph between numbers of descriptors against statistical parameters (R2 and Standard Error of Estimate (SEE)) was plotted (Figure 1). Figure 1 shows that R2 increased with the increasing number of descriptors. However, the values of SEE decreased with the increasing number of descriptors. As can be seen, R2 and SEE remain almost parallel to the number of descriptors after nine parameters and higher order models. This shows that the most suitable models are nine parametric models.
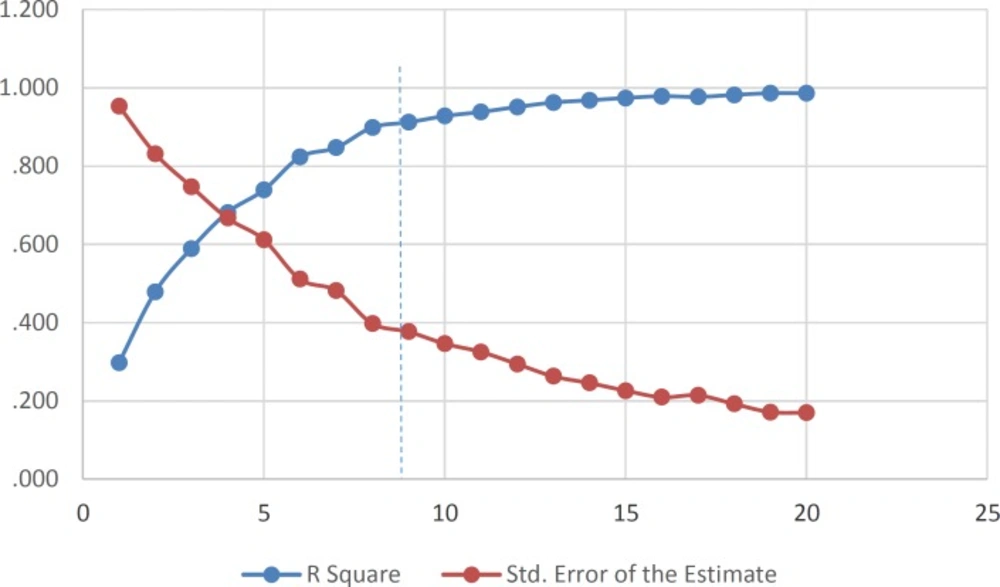
Figure 1
Influences of the number of descriptors on the R2 and SEE of the regression model.
The MLR analysis with a stepwise selection was carried out to relate the pIC50 to a nine set of descriptors. The SPSS software (version 13.0; SPSS Inc., Chicago, IL, USA) (15) was employed for the MLR analysis). It is described by the following equation:
pIC50 = 4.30 (± 1.54) –13.56 (± 1.46) P2v–19.68 (±8.10) R7e+ – 8.86 (± 1.33) R2m+
– 12.71 (± 1.54) MATS1e –0.59 (± 0.10) C-026 + 4.25 (± 0.59) Mor28m – 0.32 (± 0.06) RDF125m
+ 0.27 (± 0.05) RDF115m + 19.10 (± 8.62) G2e
Table 2Statistical parameters of SW-MLR model.
| Training set | Test set | F | Q2LOO | |
|---|---|---|---|---|
| SEE | R2 | R2 | ||
| 0.38 | 0.91 | 0.59 | 37.87 | 0.80 |
The obtained statistical parameter of the leave-one-out cross-validation test (Q2) on SW-MLR model was 0.80, which indicates reliability of the proposed model. The plots of the predicted pIC50versus the experimental pIC50, obtained by the SW-MLR modeling, are demonstrated in Figure 2.
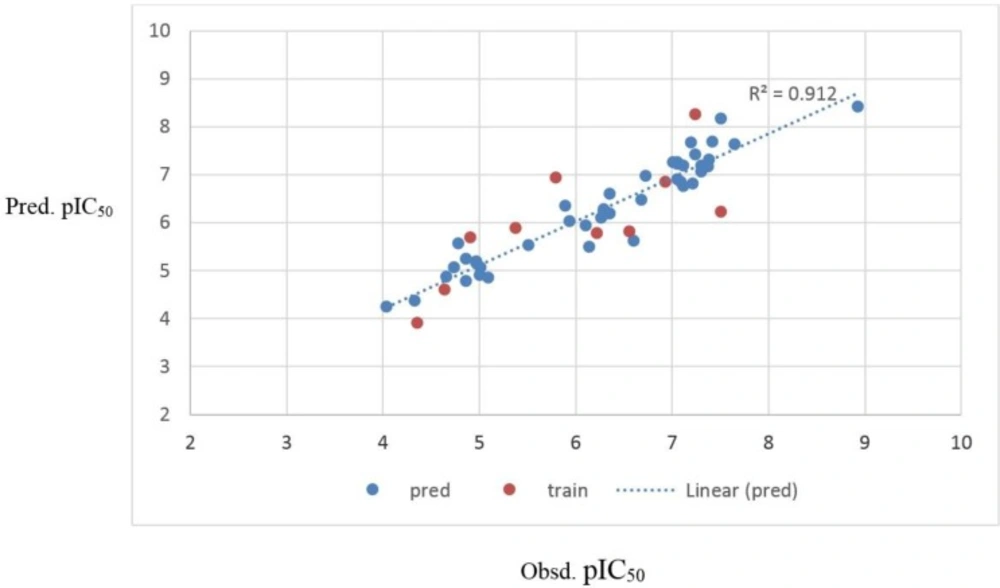
Figure 2
The predicted pIC50values by the SW-MLR modeling versus the observed pIC50values.
The selected variables of SW-MLR model are shown in Table 3, and the correlation matrix of these descriptors visualized is shown in Table 4. From Table 4, it could be seen that the correlation coefficient value of each pair descriptors was less than 0.65, which meant that the selected descriptors were independent.
Table 3The descriptor values were used in model construction.
| No. | P2v | R7e+ | R2m+ | MATS1e | C-026 | Mor28m | RDF125m | RDF115m | G2e |
|---|---|---|---|---|---|---|---|---|---|
| 1 | 0.327 | 0 | 0.117 | -0.025 | 0 | 0.314 | 0 | 0 | 0.204 |
| 2a | 0.221 | 0.039 | 0.097 | 0.051 | 0 | 0.282 | 0 | 0 | 0.193 |
| 3 | 0.165 | 0.041 | 0.093 | 0.063 | 0 | 0.253 | 0 | 0 | 0.185 |
| 4 a | 0.14 | 0.037 | 0.086 | 0.064 | 0 | 0.237 | 0 | 0 | 0.183 |
| 5 | 0.137 | 0.022 | 0.056 | 0.063 | 0 | 0.472 | 0 | 0 | 0.177 |
| 6 | 0.108 | 0.024 | 0.057 | 0.07 | 0 | 0.447 | 0 | 0.109 | 0.172 |
| 7 | 0.116 | 0.041 | 0.076 | 0.07 | 0 | 0.357 | 0 | 0 | 0.172 |
| 8 a | 0.088 | 0.032 | 0.078 | 0.028 | 1 | 0.373 | 0.002 | 0.218 | 0.167 |
| 9 | 0.115 | 0.04 | 0.099 | 0.016 | 1 | 0.391 | 0 | 0 | 0.172 |
| 10 | 0.085 | 0.029 | 0.077 | 0.076 | 0 | 0.207 | 0.005 | 0.214 | 0.168 |
| 11 | 0.093 | 0.025 | 0.043 | -0.027 | 1 | 0.356 | 0.019 | 0.219 | 0.171 |
| 12 a | 0.091 | 0.043 | 0.067 | -0.043 | 2 | 0.4 | 0.009 | 0.112 | 0.165 |
| 13 | 0.115 | 0.029 | 0.075 | -0.043 | 2 | 0.36 | 0.111 | 1.947 | 0.165 |
| 14 | 0.065 | 0.043 | 0.076 | -0.043 | 2 | 0.264 | 2.48 | 1.621 | 0.165 |
| 15 | 0.119 | 0.036 | 0.236 | -0.041 | 2 | 0.543 | 0.036 | 0.18 | 0.171 |
| 16 | 0.102 | 0.023 | 0.249 | -0.041 | 2 | 0.472 | 0.454 | 1.155 | 0.171 |
| 17 | 0.079 | 0.025 | 0.217 | -0.041 | 2 | 0.486 | 0.029 | 0.216 | 0.171 |
| 18 | 0.096 | 0.042 | 0.055 | -0.039 | 2 | 0.304 | 0.041 | 0.108 | 0.171 |
| 19 | 0.094 | 0.025 | 0.064 | -0.039 | 2 | 0.378 | 0.144 | 1.781 | 0.171 |
| 20 a | 0.092 | 0.025 | 0.058 | -0.039 | 2 | 0.328 | 2.045 | 1.53 | 0.171 |
| 21 | 0.123 | 0.023 | 0.099 | 0.131 | 2 | 0.755 | 0.012 | 0.155 | 0.168 |
| 22 | 0.089 | 0.04 | 0.292 | -0.043 | 2 | 0.512 | 1.066 | 2.776 | 0.167 |
| 23 | 0.085 | 0.036 | 0.059 | -0.016 | 0 | 0.353 | 0.005 | 0.294 | 0.167 |
| 24 | 0.097 | 0.026 | 0.047 | -0.007 | 0 | 0.461 | 0 | 0.12 | 0.163 |
| 25 | 0.106 | 0.026 | 0.044 | -0.032 | 1 | 0.484 | 0.042 | 1.156 | 0.162 |
| 26 | 0.088 | 0.025 | 0.048 | -0.032 | 1 | 0.46 | 0.062 | 0.529 | 0.162 |
| 27 | 0.082 | 0.027 | 0.06 | -0.032 | 1 | 0.373 | 1.486 | 4.305 | 0.162 |
| 28 | 0.1 | 0.029 | 0.071 | -0.03 | 1 | 0.393 | 0.007 | 0.227 | 0.167 |
| 29 | 0.09 | 0.048 | 0.101 | -0.03 | 1 | 0.319 | 0.001 | 0.177 | 0.167 |
| 30 a | 0.102 | 0.032 | 0.103 | -0.03 | 1 | 0.51 | 0.093 | 1.285 | 0.167 |
| 31 a | 0.15 | 0.028 | 0.054 | -0.007 | 0 | 0.418 | 0 | 0 | 0.163 |
| 32 | 0.071 | 0.016 | 0.07 | -0.039 | 0 | 0.417 | 0.733 | 0.149 | 0.168 |
| 33 | 0.091 | 0.027 | 0.087 | -0.039 | 0 | 0.384 | 0.01 | 0.185 | 0.168 |
| 34 | 0.055 | 0.039 | 0.088 | -0.026 | 0 | 0.35 | 1.315 | 1.262 | 0.18 |
| 35 | 0.1 | 0.035 | 0.083 | -0.06 | 0 | 0.301 | 0 | 0.036 | 0.171 |
| 36 | 0.056 | 0.027 | 0.118 | -0.024 | 0 | 0.479 | 0.933 | 3.508 | 0.167 |
| 37 | 0.069 | 0.019 | 0.074 | 0.001 | 0 | 0.408 | 2.171 | 1.298 | 0.174 |
| 38 a | 0.201 | 0.029 | 0.066 | -0.032 | 1 | 0.603 | 0.012 | 0.166 | 0.156 |
| 39 a | 0.096 | 0.022 | 0.054 | -0.032 | 1 | 0.605 | 1.923 | 5.238 | 0.156 |
| 40 | 0.055 | 0.02 | 0.062 | -0.032 | 1 | 0.614 | 1.961 | 2.784 | 0.169 |
| 41 | 0.281 | 0.02 | 0.06 | -0.011 | 1 | 0.629 | 0.022 | 0.2 | 0.153 |
| 42 | 0.121 | 0.02 | 0.054 | -0.011 | 1 | 0.633 | 1.357 | 1.623 | 0.153 |
| 43 | 0.046 | 0.017 | 0.062 | -0.011 | 1 | 0.595 | 2.807 | 2.718 | 0.153 |
| 44 | 0.051 | 0.019 | 0.062 | -0.001 | 1 | 0.457 | 1.918 | 3.153 | 0.155 |
| 45 | 0.054 | 0.018 | 0.061 | -0.021 | 1 | 0.479 | 2.746 | 3.903 | 0.16 |
| 46 | 0.108 | 0.017 | 0.055 | -0.023 | 0 | 0.496 | 1.879 | 2.358 | 0.154 |
| 47 | 0.083 | 0.015 | 0.046 | -0.015 | 1 | 0.546 | 5.444 | 1.837 | 0.157 |
| 48 | 0.054 | 0.021 | 0.099 | 0.03 | 2 | 0.62 | 3.1 | 2.297 | 0.154 |
| 49 | 0.067 | 0.024 | 0.08 | 0.055 | 2 | 0.69 | 3.857 | 6.299 | 0.161 |
| 50 | 0.108 | 0.021 | 0.075 | -0.023 | 1 | 0.556 | 3.959 | 2.302 | 0.165 |
| 51 a | 0.08 | 0.021 | 0.073 | 0.006 | 1 | 0.328 | 1.961 | 6.449 | 0.153 |
| 52 | 0.09 | 0.021 | 0.071 | -0.013 | 1 | 0.175 | 1.141 | 4.81 | 0.157 |
| 53 | 0.102 | 0.023 | 0.079 | -0.017 | 1 | 0.16 | 0.675 | 2.242 | 0.158 |
test set
Table 4Correlation coefficient matrix of the selected descriptors by SW-MLR.
| P2v | R7e+ | R2m+ | MATS1e | C-026 | Mor28m | RDF125m | RDF115m | G2e | |
|---|---|---|---|---|---|---|---|---|---|
| P2v | 1 | -0.13 | 0.03 | 0.15 | -0.22 | -0.05 | -0.40 | -0.40 | 0.44 |
| R7e+ | 1 | 0.20 | 0.04 | 0.09 | -0.36 | -0.39 | -0.33 | 0.20 | |
| R2m+ | 1 | -0.14 | 0.35 | 0.09 | -0.15 | -0.05 | 0.24 | ||
| MATS1e | 1 | -0.26 | 0.06 | -0.08 | -0.12 | 0.21 | |||
| C-026 | 1 | 0.31 | 0.21 | 0.26 | -0.31 | ||||
| Mor28m | 1 | 0.35 | 0.20 | -0.41 | |||||
| RDF125m | 1 | 0.65 | -0.41 | ||||||
| RDF115m | 1 | -0.50 | |||||||
| G2e | 1 |
Discussion
QSAR results can provide useful chemical visions for designing new compounds. For this purpose, interpretation of the descriptors appeared in the resulting models was discussed below (16). The chemical meanings of selected descriptors are also displayed in Table 5.
P2v is one of the WHIM descriptors which has appeared in the SW-MLR model. WHIM descriptors are molecular descriptors based on the projections of the atoms along principal axes. WHIM descriptors are built in such a way as to capture relevant molecular 3D information regarding molecular size, shape, and symmetry and atom distribution with respect to invariant reference frames. The property in this case is van der Waals volume. This descriptor has a significant negative effect on the inhibitory activity of analogs. G2e is another WHIM descriptor in this model that has a negative influence on PIC50. The negative sign suggests that the PIC50 value is inversely related to this descriptor.
From the nine selected descriptors, three of them belong to the 2D autocorrelation descriptors (R7e +, R2m + and MATS1e). In 2D autocorrelation descriptors, the molecule atoms represent a set of discrete points in space, and the atomic property and function are evaluated at those points. The symbol for each of the autocorrelation descriptors is followed by two indices d and w; where d stands for the lag and w stands for the weight. The lag is defined as the topological distance d between pairs of atoms. The weight can be m (relative atomic mass), p (polarizability), e (Sanderson electronegativity) and v (Vander Waals volume). The physico-chemical properties (weights) for R2m+, R7e+ and MATS1e are atomic mass and Sandersonn electronegativity, respectively. Figure 4 displays that these three descriptors have negative effects on caspase-3 inhibitory activity, which indicates that pIC50 is inversely related to atomic Sanderson electronegativities and atomic mass.
The seventh and eighth descriptors are RDF115m and RDF125m, which belong to the RDF descriptors. The RDF in these forms meets all the requirements for the 3D structure descriptors. It is independent of the atom number (i.e., the size of a molecule), it is unique regarding the 3D arrangement of the atoms, and it is invariant against the translation and rotation of the entire molecule. The RDF descriptors are based on the distance distribution in the molecule. The RDF of an ensemble of n atoms can be interpreted as the probability distribution of finding an atom in a spherical volume of radius R. RDF115m and RDF125m descriptors play a main role in analogs activities. RDF115m and RDF125m have positive and negative influence on PIC50, respectively.
Mor28m is one of the 3D-MoRSE descriptors. 3D Molecule Representation of Structures based on Electron diffraction (3D MoRSE) descriptors is derived from infrared spectra simulation using a generalized scattering function. This descriptor was proposed as signal 22⁄weighted by atomic masses, which relates to masses of the molecules .
C-026 is one of the Molecular descriptors that are based on the counting of 120 atom-centered fragments. Atom-centered fragments are those defined by Ghose and Crippen (17-18). Each atom type is an atom in the molecule described by its neighboring atoms. Hydrogen and halogen atoms are classified by the hybridization and oxidation state of the carbon atom to which they are bonded. Carbon atoms are classified by their hybridization state and depending on whether their neighbors are carbon or heteroatoms. C-026 is defined as R--CX--R Atom-centered fragments which R represents any group linked through carbon; X represents any electronegative atom (O, N, S, P, Se, halogens) and -- represents an aromatic bond as in benzene. C-026 has negative effect on pIC50 .
In summary, it is concluded that atomic masses, atomic Sanderson electronegativities, atomic van der Waals volumes and atom-centered fragments play the main roles in the caspase-3 inhibitory activity of the compounds. Figure 3 shows that R7e +, MATS1e and G2e mean effects have negative and positive signs, respectively. The R7e +, MATS1e mean effects values are higher than that of G2e, which indicates that pIC50 is inversely related to atomic Sanderson electronegativities. It is also obvious that atomic masses mean effect on pIC50 is positive, because Mor28m, RDF115m mean effects values are higher than that of R2m + and RDF125m.
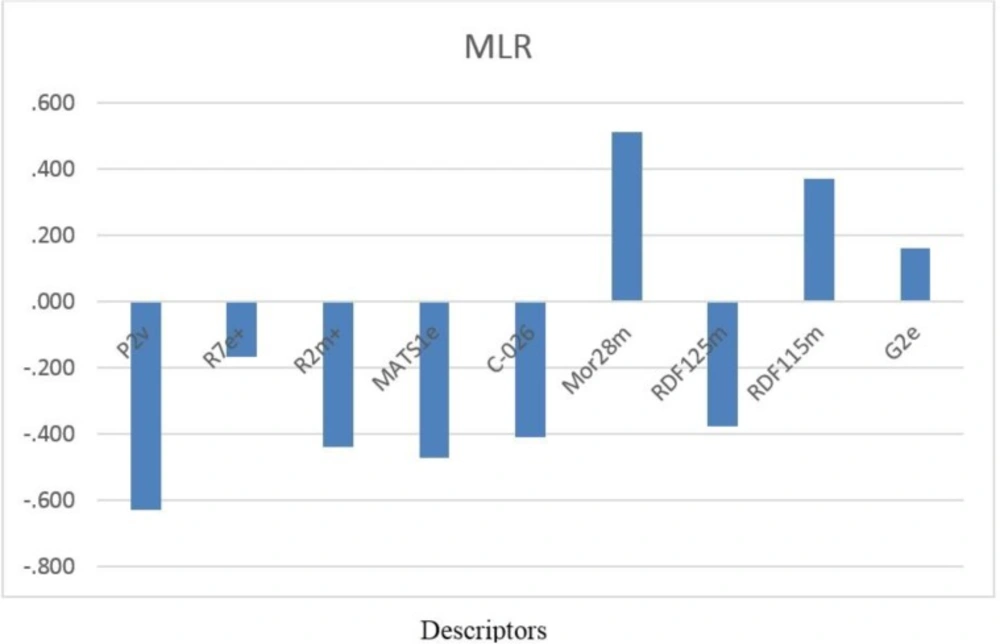
Figure 3
Standardized coefficients versus descriptor values in MLR.
Table 5Details of name of the descriptors were used in model construction.
| Descriptors | Chemical meanings |
|---|---|
| P2v | 2nd component shape directional weighted by atomic van der Waals volumes |
| R7e+ | R maximal autocorrelation of lag 7/weighted by atomic Sanderson electronegativities |
| R2m+ | R maximal autocorrelation of lag 2/weighted by atomic masses |
| MATS1e | Moran autocorrelation lag 1 / weighted by atomic Sanderson electronegativities |
| C-026 | R--CX--R Atom-centred fragments |
| Mor28m | 3D-MoRSE - signal 28/weighted by atomic masses |
| RDF125m | Radial Distribution Function - 12.5/weighted by atomic masses |
| RDF115m | Radial Distribution Function- 11.5/weighted by atomic masses |
| G2e | 2st component symmetry directional WHIM index/weighted by atomic Sanderson electronegativities |
Conclusion
In this study, SW-MLR was used to develop linear QSAR model for prediction of caspase-3 inhibitory activity of 1, 2-benzisothiazol-3-one derivatives. The built model displayed good correlations between the structure and activity of the studied compounds. The model was validated using LOO cross-validation and external test set. The built model has a good self-and external-predictive power. Based on QSAR model results, electronegativity, the atomic masses, the atomic van der Waals volumes and R--CX--R Atom-centered fragments were found to be important factors controlling the caspase-3 inhibitory activity.
