π
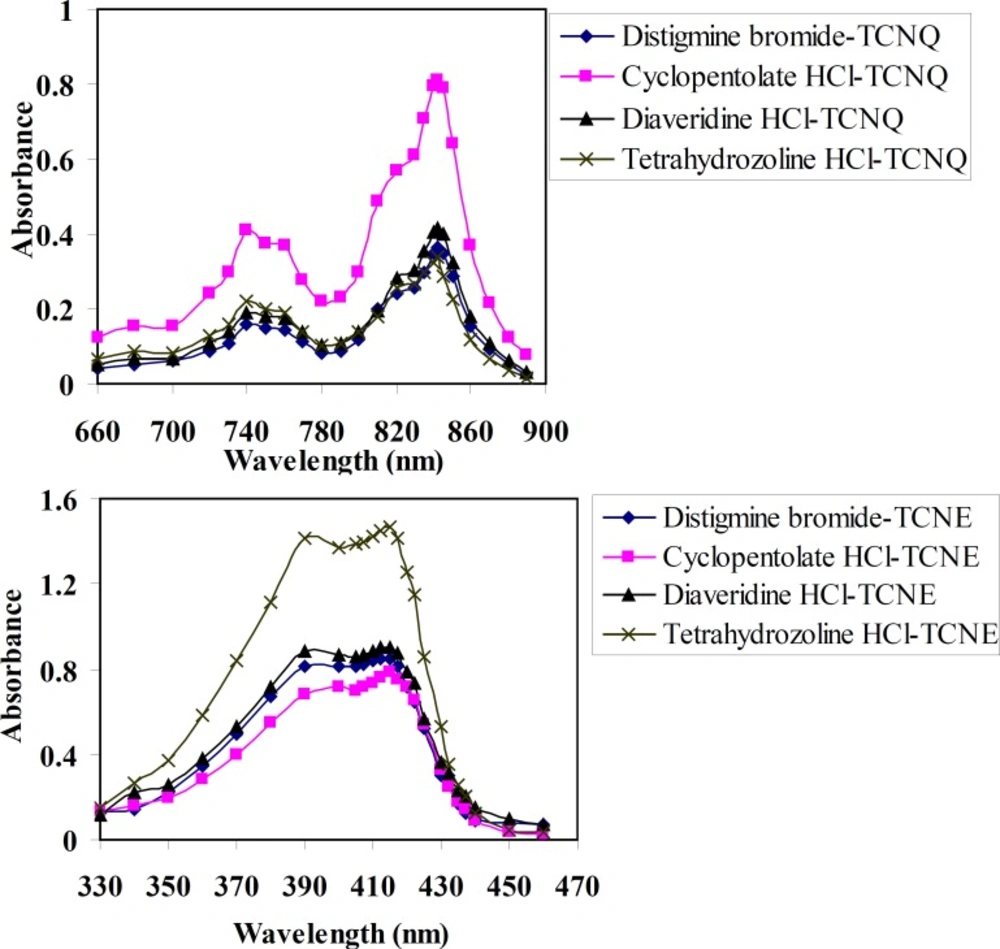
Figure (2a) shows the absorption spectra of TCNQ reagent with DTB, CPHC, DVHC and THHC CT complexes in acetonitrile solvent. A solution of drugs and TCNQ reagent in acetonitrile solvent yield an intense greenish colour which has a characteristic long-wavelength absorption bands, frequently with two maxima at λ = 745 and 842 nm in the electronic spectrum. The absorption spectra of TCNE reagent with DTB, CPHC, DVHC and THHC in acetonitrile result in the formation of an intense yellow product which exhibits an absorption maximum at λ = 415 nm as given in (
Figure 2b).
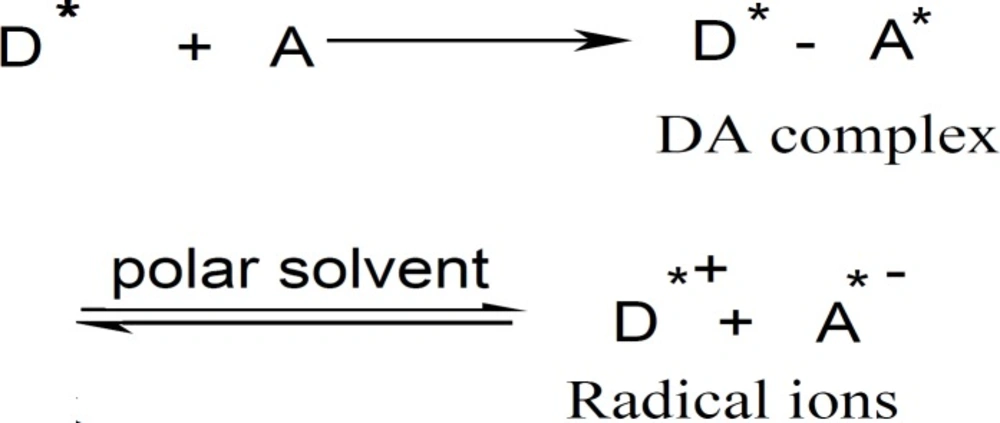
The predominate chromogen with TCNQ or TCNE reagents is the green or yellow radical anion A* which was probably formed by the dissociation of an original donor-acceptor (DA) complex with DTB, CPHC, DVHC and THHC drugs.
Where D = donor and A = acceptor and A* = TCNQ* or TCNE* in polar solvent. The dissociation of the DA complex is promoted by the high ionizing power of the acetonitrile solvent (
31-
33).
Effect of solvent
In order to select the suitable solvent for CT complex formation, the reaction of TCNQ and TCNE reagents with DTB, CPHC, DVHC and THHC drugs is made in different solvents. These solvents included acetonitrile, chloroform, n-propanol, methanol, 1,4–dioxane, 1,2-dichloroethane, petroleum ether, ethanol and dimethylformamide. It is found that acetonitrile is considered to be an ideal solvent for the colour reaction as it offers solvent capacity for TCNQ and TCNE and gives the highest yield of the radical anion as indicated by high ε values. This is because it possesses the high dielectric constant of all solvents examined; a property which is known to promote the dissociation of the original CT complex to radical ions i.e. the dissociation of donor–acceptor complex is promoted by the high ionizing power of the solvent.
Absorption spectra of charge-transfer complexes of distigmine bromide, cyclopentolate HCl, diaveridine HCl and tetrahydrozoline HCl with (a) TCNQ and (b) TCNE reagents in acetonitrile.
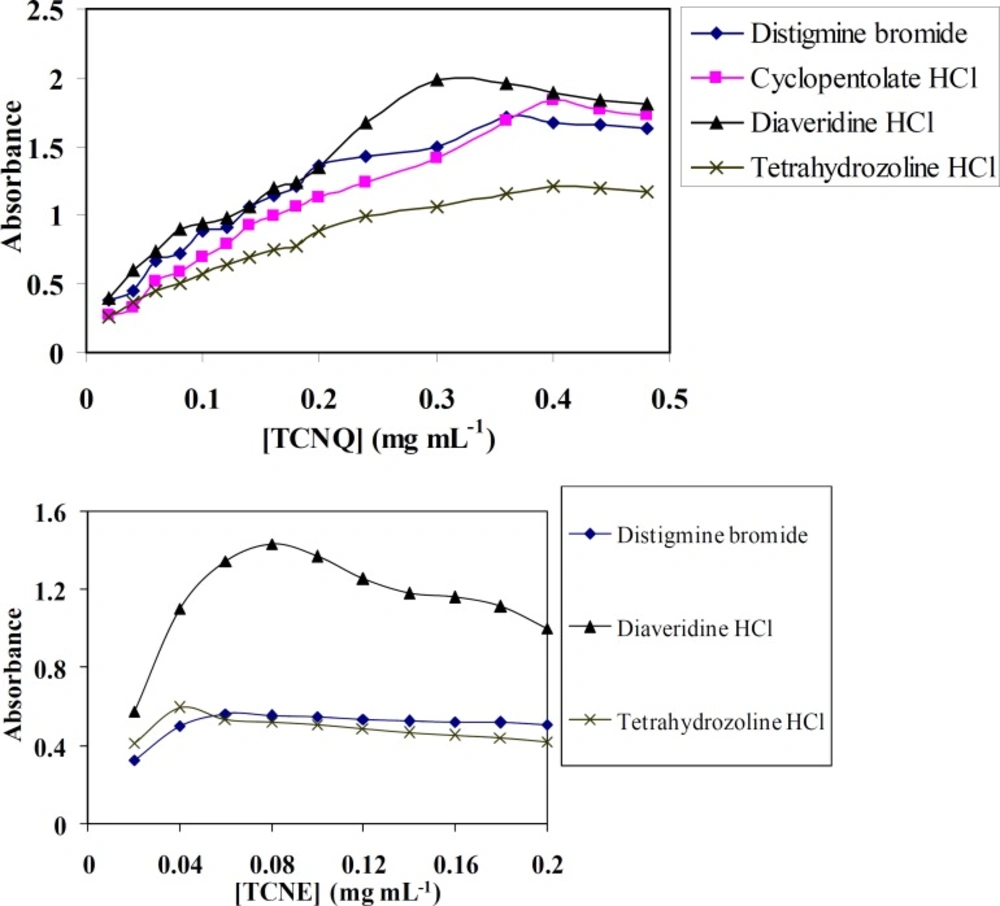
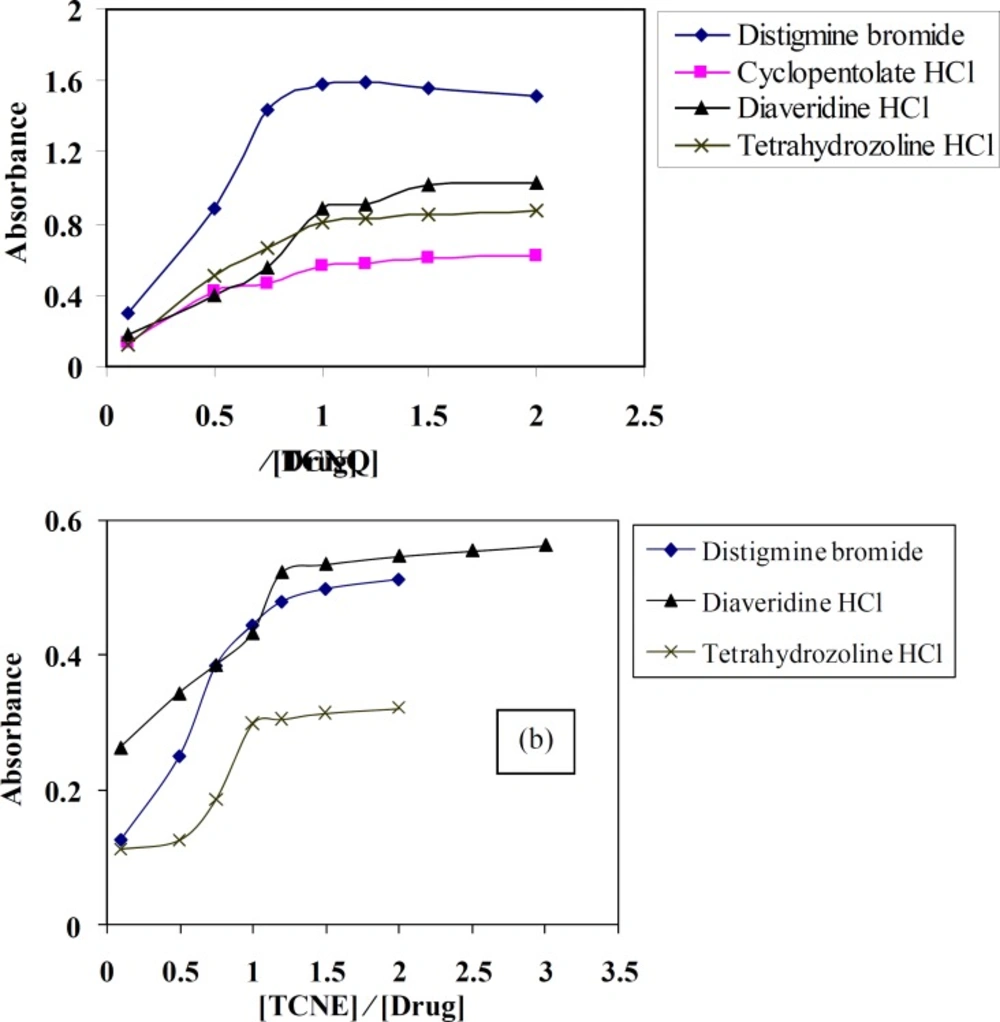
Effect of reagents concentration
Figure (3) shows the effect of 0.1% (w/v) TCNQ and TCNE reagents on the quantitativeness of their reactions with DTB, CPHC, DVHC and THHC drugs. It is found that, when various concentrations of TCNQ or TCNE solutions added to a constant concentration of DTB, CPHC, DVHC and THHC drugs, it is obvious that (0.3-0.4) or (0.04-0.08) mg mL
-1 of TCNQ or TCNE solutions, respectively, is found to be sufficient for quantitative determination of the drugs under study.
Effect of (a) TCNQ and (b) TCNE concentrations on the formation of distigmine bromide, diaveridine HCl and tetrahydrozoline HCl-CT complexes in acetonitrile
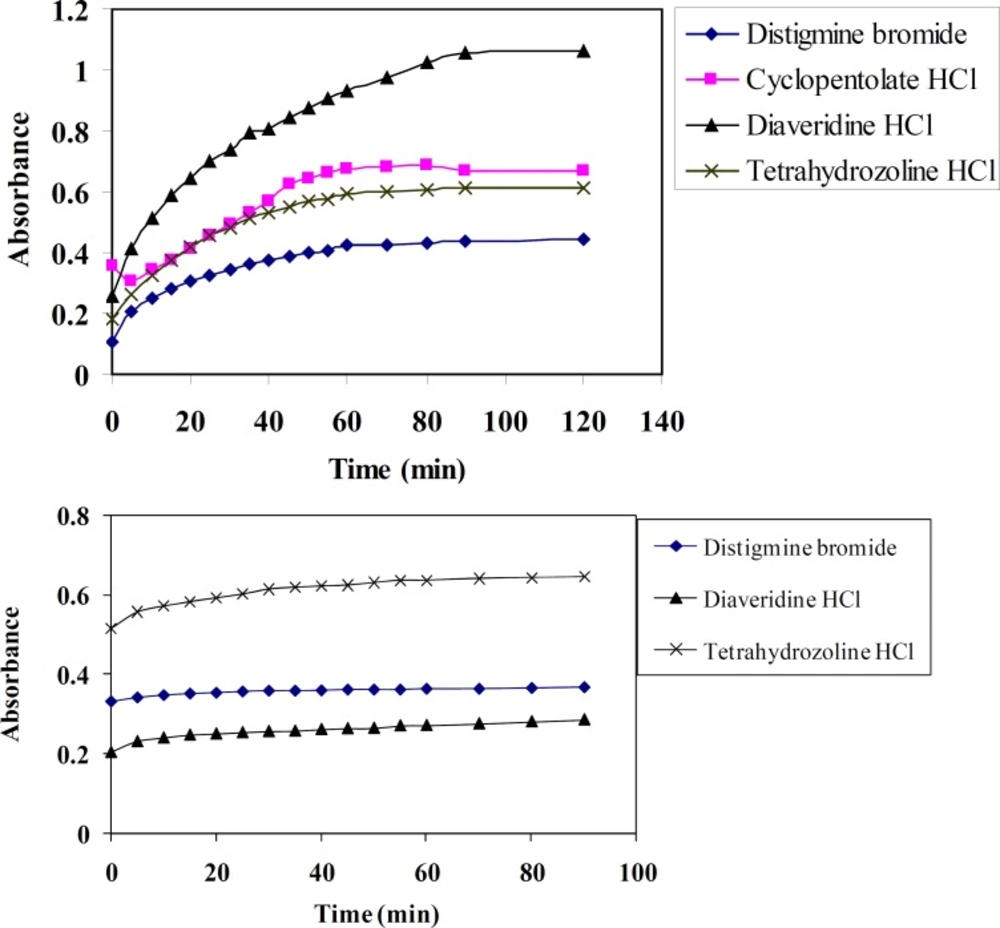
Effect of time
Time of reaction has a pronounced effect on quantitativeness of the reaction between DTB, CPHC, DVHC and THHC (electron donor) and TCNQ or TCNE reagents (electron acceptors). The optimum reaction time is determined spectrophotometrically at different time intervals and at λ
max = 842 or 415 nm for TCNQ and TCNE reagents, respectively.
Figure (4) shows that complete colour development is attained after 60 and 30 minutes for TCNQ and TCNE reagents, respectively. Also the colour remains stable for one day at least using these reagents.
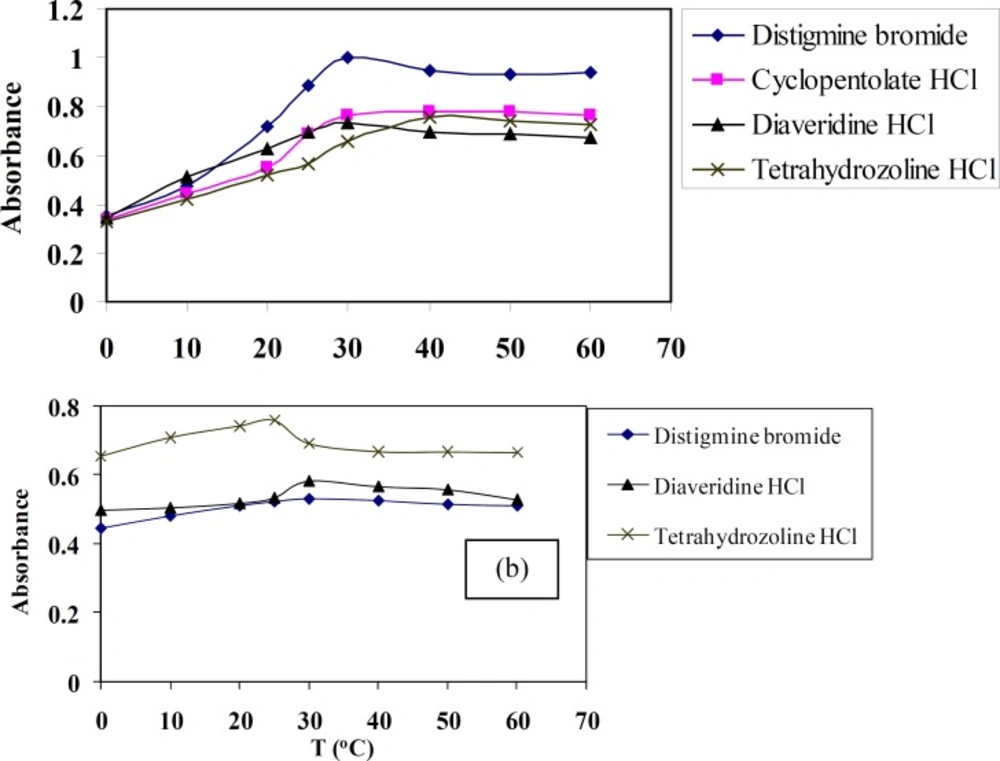
Effect of temperature
The aim of studying this factor using spectrophotometric method is to check the effect of temperature on the quantitativeness of these reactions. The effect of temperature in the range of 0 to 60 ºC on TCNQ or TCNE reactions with DTB, CPHC, DVHC and THHC drugs was studied. The absorbance of these CT complexes is measured at 842 and 415 nm for TCNQ and TCNE reagents, respectively, against the blank solution prepared without the drug. The effect of temperature on these CT complexes is shown in
Figure 5. The given results show that the absorbance attains a maximum colour at temperature 30-40 or 25-30 ºC for TCNQ and TCNE reagents, respectively. The colours of the reaction products CT complexes are remained constant for at least 24 hour.
Effect of time on the absorbance of CT complexes of distigmine bromide, diaveridine HCl and tetrahydrozoline HCl with (a) TCNQ and (b) TCNE reagents in acetonitrile
Effect of temperature (0-60 °C) on the absorbance of CT complexes of distigmine bromide, diaveridine HCl and tetrahydrozoline HCl with (a) TCNQ (t = 30 min, λ = 842 nm) (b) TCNE (t = 30 min, λ = 415 nm) reagents in acetonitrile
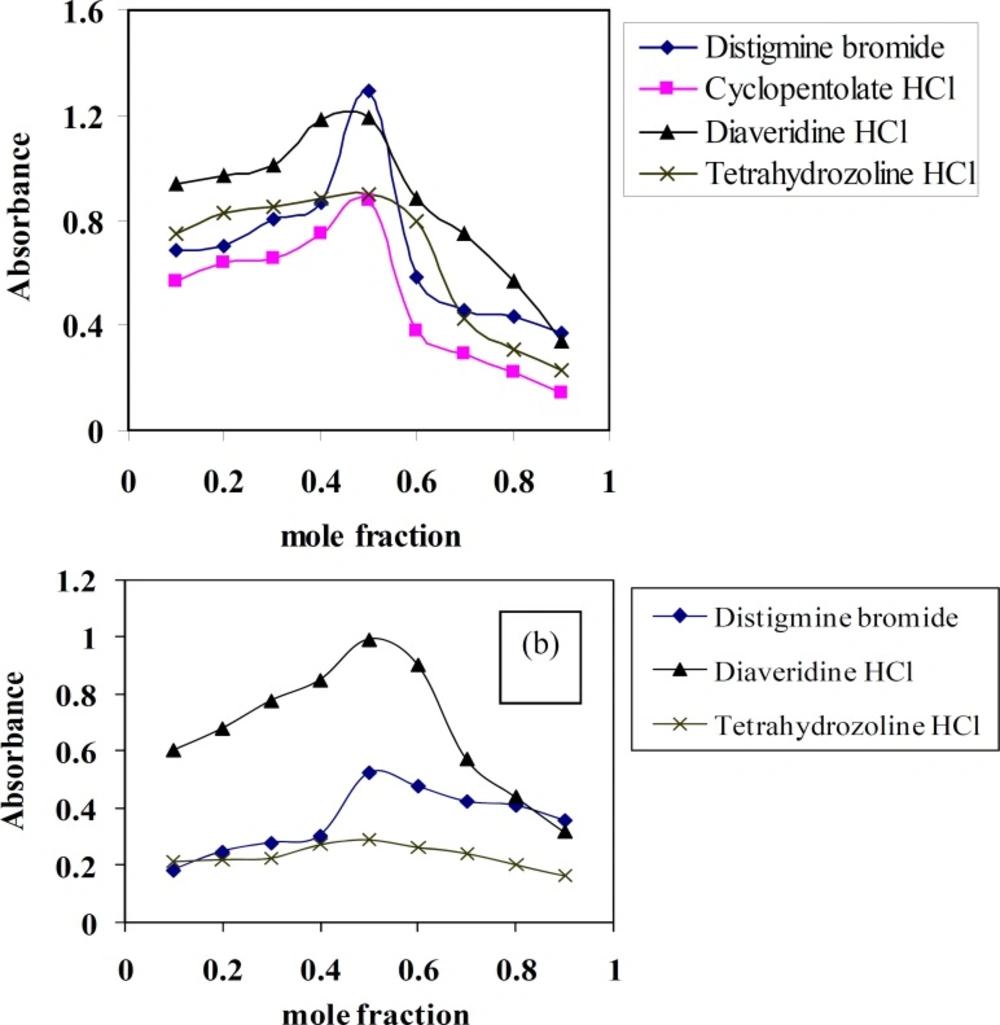
Stoichiometry of the CT complexes
Molar ratio and Job’s continuous variation methods (
34,
35) are applied in order to determine the suitable ratio between DTB, CPHC, DVHC and THHC drugs and TCNQ or TCNE reagents.
Figures (6,
7) show that the interaction between these drugs and reagents occurs in equimolar basis,
i.e the two straight lines are intersected at 1:1 [Drug]: [Reagents]. This means 1:1 CT complexes were formed between the drugs and TCNQ or TCNE reagents. The CT complexes formed between TCNQ or TCNE reagents and DTB, CPHC, DVHC and THHC drugs takes place through the migration of H
+ ion to one of the four cyano groups in TCNQ and TCNE reagents to form positive ion which associate with the phenolate anion to form ion pairs (
31-
33π∗
31-
33,
36).
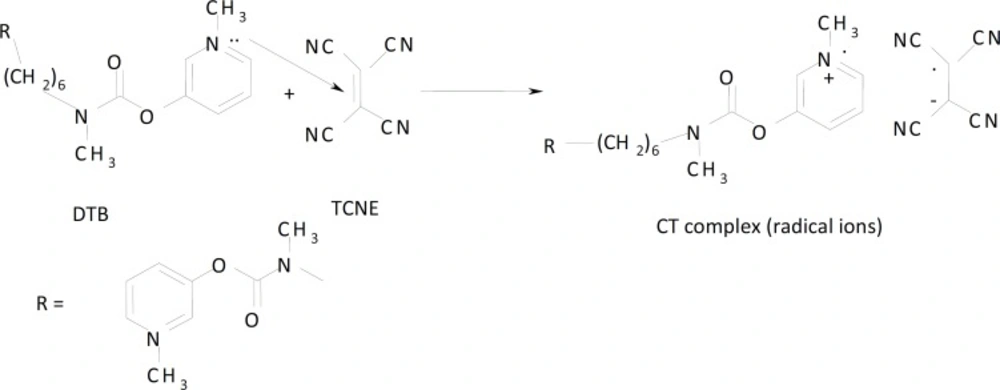
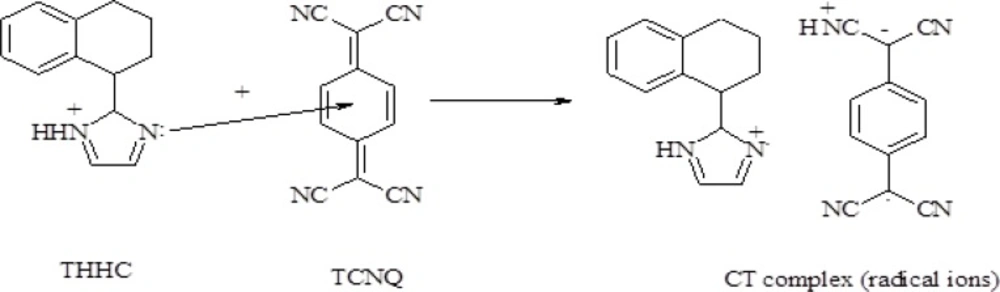
Figures (8,
9) represent the proposed CT complexes of DTB with TCNE and THHC drug with TCNQ as examples (
36).
Job's method for distigmine bromide, diaveridine HCl and tetrahydrozoline HCl CT complexes with (a) TCNQ and (b) TCNE reagentsin acetonitrile
Molar ratio of distigmine bromide, diaveridine HCl and tetrahydrozoline HCl-CT complexes with (a) TCNQ and (b) TCNE reagents in acetonitrile
CT complex formation between DTB drug with TCNE
CT complex formation of THHC with TCNQ
Obeyence to Beer’s law
After the selection of suitable pH, solvents, reagent concentrations, reaction time, temperature, and ratio it is also important to know the concentration limits of DTB, CPHC, DVHC and THHC drugs at which these reactions are quantitative. Consequently, it is easy to apply this spectrophotometric method to determine these drugs under investigation quantitatively in pharmaceutical formulations via its reaction with electron acceptor reagents like TCNQ or TCNE reagents.
Table (1) shows the results of studying quantitativeness of the reaction between DTB, CPHC, DVHC and THHC drugs with TCNQ and TCNE reagents under selected optimum conditions. It is found that, Beer’s law is valid over the concentration ranges from 6 to 400 and 80 to 600 μg mL-1 of DTB drug using TCNQ and TCNE reagents, respectively. While, the calibration curve is linear in the concentration range of 20-500 μg mL-1 of CPHC drug using TCNQ reagent.
While the calibration curves are linear in the concentration range of 1-180 and 1-60 μg mL-1 of DVHC drug using TCNQ and TCNE reagents, respectively. In addition, the calibration curves are linear in the concentration range of 60-560 and 80-640 μg mL-1 of THHC drug using TCNQ and TCNE reagents, respectively. Table 1 shows the slope, intercept, correlation coefficient, Sandell sensitivities, molar absorptivity (ε), range of error, standard deviation and relative standard deviation. The small values of Sandell sensitivity indicate the high sensitivity of the proposed method in the determination of the drugs under investigation. Four replicate measurements are performed at different concentrations of DTB, CPHC, DVHC and THHC drugs. The relative standard deviation and the range of error values are calculated and found that the small values of them indicate the high accuracy and high precision of the proposed spectrophotometric method.
Between-day determination of TB, CPHC, DVHC and THHC drugs.
In order to prove the validity and applicability of the proposed method and reproducibility of the results obtained, four replicate experiments at four concentrations of DTB, CPHC, DVHC and THHC drugs were carried out. Tables (2, 3) show the values of the between-day relative standard deviations for different concentration of the drugs, obtained from experiments carried out over a period of four days. It is found that, the between day relative standard deviations are less than 1%, which indicates that the proposed method is highly reproducible and TCNQ and TCNE reagents are successfully applied to determine DTB, CPHC, DVHC and THHC drugs via the charge transfer reaction.
Spectrophotometric determination of DTB, CPHC, DVHC and THHC drugs in different pharmaceutical preparations
The spectrophotometric determination of DTB, CPHC, DVHC and THHC drugs via their reaction with TCNQ and TCNE (strong electron acceptors) reagents are carried out. The results obtained are given in Tables (4, 5). These data show that, the determined concentration of DTB, CPHC, DVHC and THHC drugs by the proposed method are closed to that calculated from the applied standard method. In order to check the confidence and correlation between the suggested spectrophotometric procedures and the official method (1, 4, 10) for determination of DTB, CPHC, DVHC and THHC drugs, it is better to do the F- and t-tests for all the results (Tables 4, 5).
The calculated F- and t-tests at the 95% confidence level do not exceed the theoretical values indicating non significant difference between the proposed and official method. The small values of SD and RSD indicate the reliability, accuracy and precision of the suggested procedures.
Validation of the proposed method
Linearity, detection, and quantitation limits
Following the proposed experimental conditions, the relationship between the absorbance and concentration was quite linear in the concentration ranges given in Table 1. The intercept (a), slope (b), correlation coefficient (r), molar absorptivities (ε), and Sandell sensitivity values are summarized in Table 1. The percentage recoveries of the pure drugs using the proposed methods compared with that given by the reported methods are illustrated in Tables (3, 4). The validity of the proposed spectrophotometric method was evaluated by statistical analysis between the results achieved from the proposed method and that of the reported methods (1, 4, 10). Regarding the calculated t-test and F-test (Tables 3, 4), it is concluded that there is no significant difference between the proposed and reported methods regarding accuracy and precision. The detection limit (LOD) is defined as the minimum level at which the analyte can be reliably detected for the four drugs was calculated using the following equation (
37,
38), and listed in Table 1:
LOD = 3s / k
Where s is the standard deviation of replicate determination values under the same conditions as for the sample analysis in the absence of the analyte and k is the sensitivity, namely the slope of the calibration graph. The limits of quantization, LOQ, is defined as the lowest concentration that can be measured with acceptable accuracy and precision (
37,
38), and the data are listed in Table 1.
LOQ = 10 s / k
Accuracy and precision
The accuracy and precision of the proposed spectrophotometric method were evaluated by carrying out four replicate analyses on pure DTG, CPHC, DVHC and THHC drug solutions at four different concentration levels within the working range. Percentage relative standard deviation (RSD%) as precision and standard deviation (SD) as accuracy of the proposed spectrophotometric method were calculated (Tables 2, 3). The relative standard deviation values were found to be less than 2% in all cases, indicating good repeatability of the suggested method. The intra- and inter-day precision and accuracy results show that the proposed method has good repeatability and reproducibility (Tables 2, 3).
Ruggedness and robustness
The ruggedness of the proposed method was assessed by applying the procedures using two different instruments in the different laboratories. It is found that the RSD did not exceed 2.0% which indicate that laboratory-to-laboratory variation was found to be reproducible. Robustness of the procedures was assessed by evaluating the influence of small variation of experimental variables, i.e., concentrations of TCNQ and TCNE reagents and reaction time, on the analytical performance of the method. In these experiments, one experimental parameter was changed while the other parameters were kept unchanged, and the recovery percentage was calculated each time. The small variations in any of the variables did not significantly affect the results. This provided an indication of the reliability of the proposed method during routine work.
Interference studies
This study was performed in order to show the effect of possible interfering species on the reaction of the four drugs under investigation with the TCNQ and TCNE reagents. The selectivity of the proposed spectrophotometric method was investigated by observing any interference encountered from some common excipients of the pharmaceutical formulations such as starch and sugars like lactose, sucrose, glucose and maltose. It was observed that these excipients did not interfere with the proposed method. So, the proposed spectrophotometric method is able to determine the four drugs under investigation in the presence of common excipients.