Materials
Chemicals purchased from Sigma-Aldrich Chemical Company (St. Louis, USA) were silymarin, cholesterol and egg lecithin. Mueller-Hinton broth, dioxane, soybean casein digest agar (SCDA), chloroform, methanol was purchased from Merck (Darmstadt, Germany).
Microorganism
MRSA strain was isolated from clinical samples at Golestan Hospital (Ahvaz, Iran) and identified by using the reported method including tube coagulase test, slide coagulase test, latex agglutination test, Dnase and heat-stable nuclease tests, commercial biochemical tests, antimicrobial susceptibility test and PCR amplification and sequencing tests for some genes such as
mecA (
3,
16). This strain was inoculated onto blood agar plates and then incubated at 37 ˚C for 24 h and used for experimentation.
Preparation of nanoliposomes
Silymarin-loaded nanoliposomes were prepared using the method described previously (
13). Briefly, the egg lecithin and cholesterol at the appropriate molar ratio (
Table 1) were dissolved in chloroform and dried to a lipid film with a rotary evaporator (Brinkman, Toronto, Canada) under N2 flow and vacuum at 30 ˚C. The dried lipids were dispersed by agitation in silymarin solution and sonicated at 4 ˚C in ultrasonic bath (Braun-sonic 2000, Burlingame, USA). At finally, silymarin-loaded nanoliposomes were obtained by extruding of respective suspension using a polycarbonate membrane filter 100 nm-sized pores for 12 times and then for separation of excess free silymarin and larger lipid aggregation by ultracentrifugation (100000 g for 30 min). Control nanoliposomes were prepared similarly, but PBS (pH 7.4) was used instead of the silymarin solution.
| Lipids | Molar ratio of lipids (µmol/mL) |
|---|
| Egg lecithin:Cholestrol | 6:1 |
Determination of encapsulation efficacy
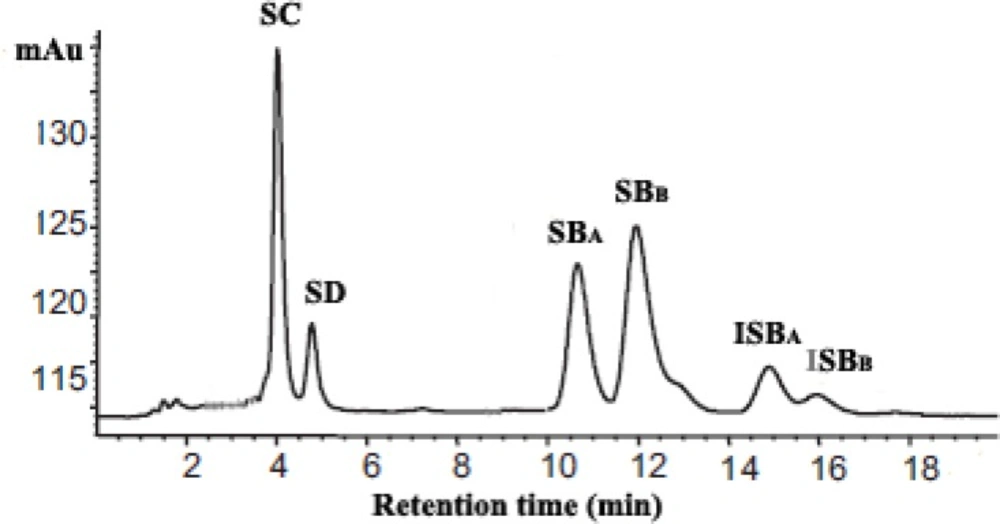
The content of silymarin in prepared nanoliposomes was determined by HPLC as previously described (
17), following dissolution in 0.1% Triton X-100. To determination of silymarin, the 20 µL of nanoliposomal lysate was injected into the HPLC column. In the HPLC analysis, a C18 column (4 mm × 150 mm, 5 µm,Waters Co., Milford, USA) was used. The mobile phase was phosphoric acid (85%): methanol: water (0.5:46:64, v:v) at a flow rate of 1 mL/min. The detection was done at 288 nm. Each analysis cycle required 20 min. Silymarin corresponds to the sum of peak areas of SC, SD, SB
A, SB
B, ISB
A and ISB
A concentrations. Then, the encapsulation efficiency defined as % encapsulation = (C
I/C
T) × 100, where C
I – silymarin in nanoliposome, C
T – total silymarin in the nanoliposome preparation, was used in calculation.
Particle size, zeta-potential and polydispersity index determination
Mean particle size, polydispersity index and zeta-potential of nanoliposomes was evaluated by Malvern zetasizer (Malvern instrument, Worcestershire, UK) apparatus, as described previously (
18).
Antimicrobial susceptibility testing
The MICs of free and silymarin-loaded nanoliposomes for isolated MRSA strain were determined by the broth dilution technique as recommended by Clinical and Laboratory Standards Institute (CLSI) (
19). Bacterial cell suspensions (~ 5×10
5 cells/mL) were diluted in Mueller-Hinton broth and dispensed (100 μL) into a microtiter tray containing serial two-fold dilutions of silymarin and then incubated for 24 h at 37 ºC. The MIC was the lowest concentration of silymarin in free and nanoliposomal form that prevented visible bacterial growth and expressed in µg/mL.
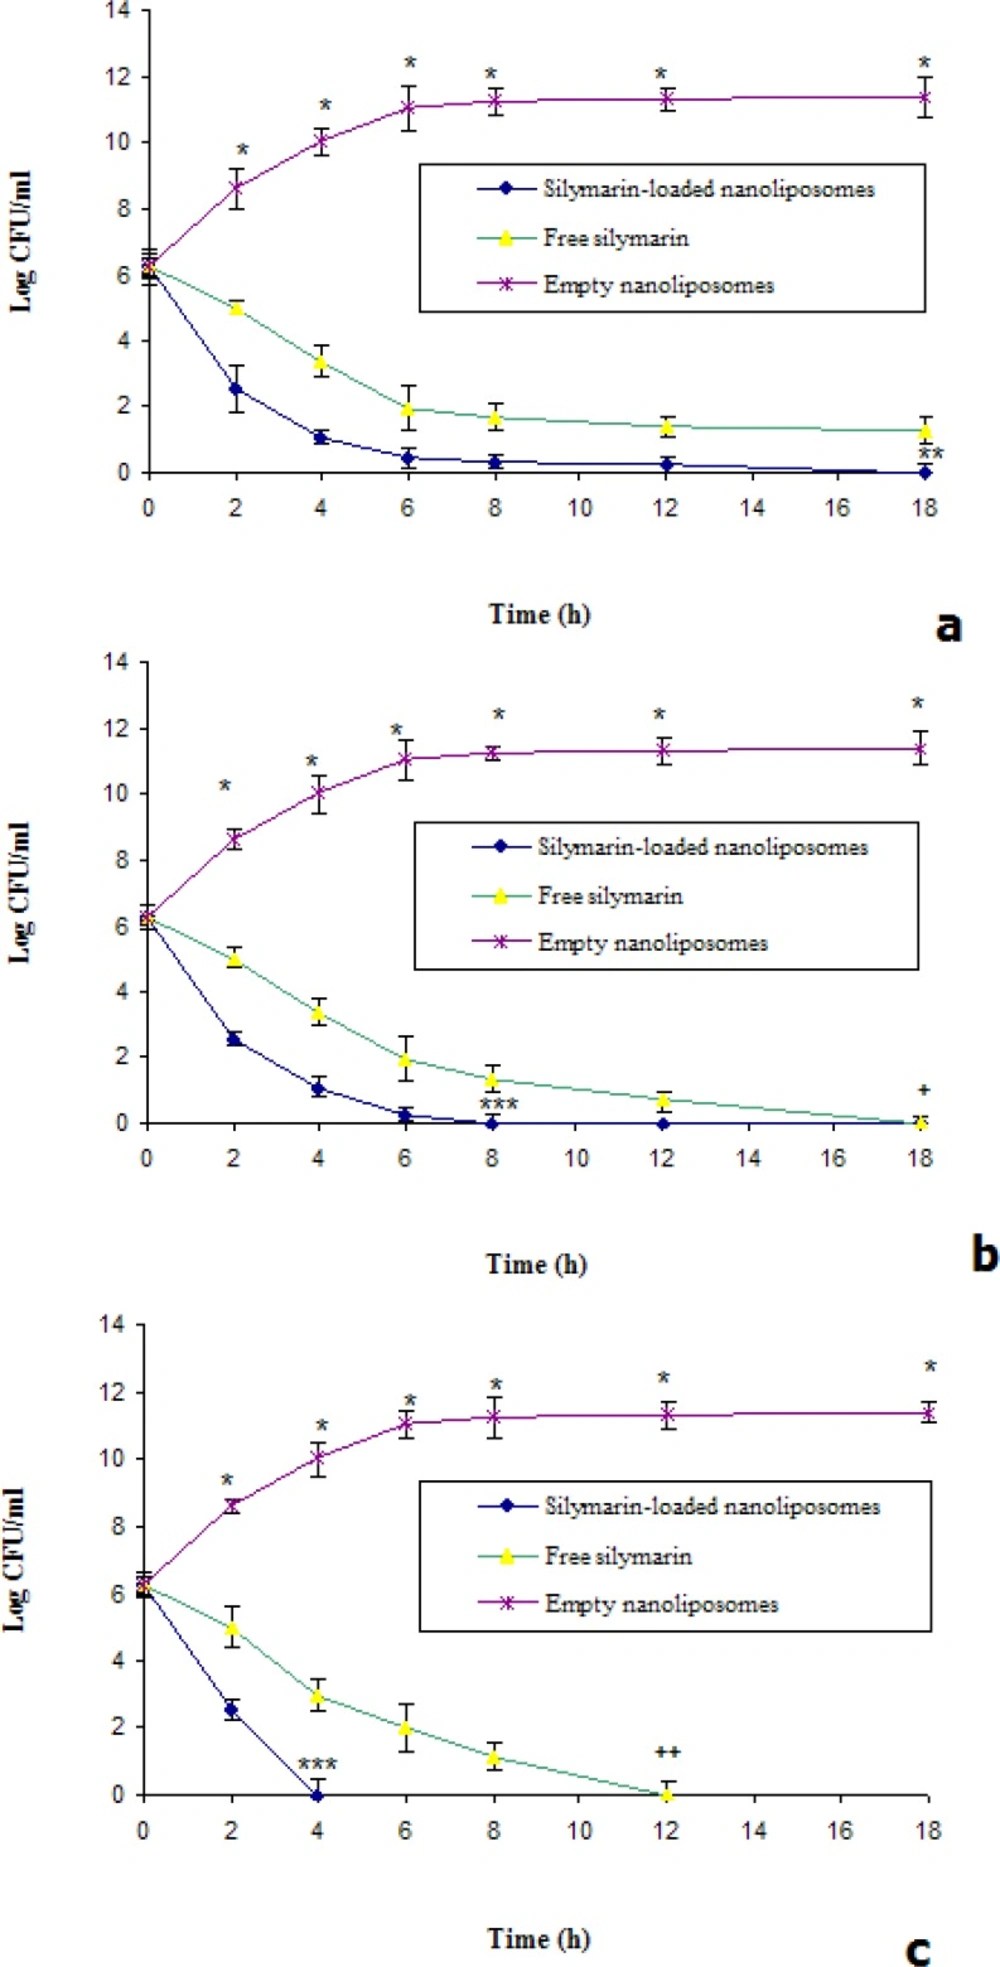
Time-kill studies
Time kill studies were preformed according to the method described previously (
20). Briefly, 100 µL of MRSA suspension were resuspended in 10 mL of Mueller-Hinton broth and then incubated overnight at 37 °C, and adjusted to match the 0.5 McFarland turbidity. Subsequently, 100 µL of this standardized inoculums were added to separate culture tubes containing 1 mL of Mueller-Hinton broth with 1 mL free and nanoliposomal silymarin solutions at 1, 2 and 4 times the MIC and then incubated at 37 °C. The colony counts were performed at 0, 2, 4, 6, 8, 12 and 18 h and data were expressed as log colony forming unit per milliliter (CFU/mL).
In-vivo study
In-vivo therapeutic efficacy of silymarin-loaded nanoliposomes was tested by a described method (
21), with some modification. In brief, forty male BALB/c mice (20-22 g) obtained from the National Institute of Pasture, Iran. Mice were handled according with the national guidelines of the laboratory animal and housed in separate cages and received water and food ad
libitum (
22). Animal care and protocols were performed and approved by the Institutional Animals Ethics Committee of Borujerd Branch, Islamic Azad University (Number: 202). After anesthetized with ketamine-xylazine mixture (150 mg/Kg, given intramuscularly), the mice back’s were shaved and a brass bar (10×10×100 mm) was heated in boiling water for 18 min and then applied on the shaved back of the mice for 50 seconds to burn induction. Then, 50 μL of the bacterial inoculums (containing 1×10
9 CFU of total bacteria) was applied subcutaneously into the burned sites on the animal's back. The burned mice were divided into 4 groups.
Prior to the treatment starting, the gel forms of the silymarin-loaded nanoliposomes, free silymarin, empty nanoliposomes and physiological saline were prepared according to the previously described method (
23).
All groups were treated topically as follows: Group 1 received silymarin-loaded nanoliposomes gel (150 mg/Kg/12h); groups 2 received free silymarin gel (150 mg/Kg/12); group 3 received empty nanoliposomes gel (150 mg/Kg/12h), and group 4 received physiological saline gel (1 mL/Kg/12h); for 12 days starting from the 4rd day post infection. Three days after the last dose the surviving mice were anesthetized and sacrificed by cervical dislocation. Then, the skin, liver and spleen of animals were removed under sterile conditions and homogenized for 5 min in PBS (pH 7.4, 2 mL/g). The homogenates were then serially diluted and plated for growth in SCDA. At finally, the inoculated plates were incubated at 35 ºC for 24 h and the colony forming unit (CFU) was counted.
Data analysis
All data were expressed as means ± SD. Statistical comparisons of killing rate study were performed by paired Student’s t-test, and p-value of less than 0.05 was considered significant. The data of survival rates were determined using ANOVA test.