Materials
Iguratimod (T-614, purity 99.2%, HPLC grade) was supplied by Jiade Medical Technology Co., Ltd. (Changzhou, China). Iguratimod metabolite (M2) was isolated and purified in our laboratory (purity >98%, HPLC grade). Iguratimod tablets were purchased from Simcere (Hai’kou, Hainan, China). Phenacetin (purity ≥98%), used as the internal standard (IS), was purchased from Macklin Biochemical Co., Ltd. (Shanghai, China). Recombinant human CYP450s yeast cells containing c-DNA expressed P450s (CYP1A2, CYP2C9, CYP2C19, CYP2D6, CYP2E1, and CYP3A4) were obtained from Nanjing BRT-Biomed Co., Ltd. (Nanjing, China). Other chemicals were obtained from the following sources: D-(+)-Glucose from Aladdin Industrial Corporation (Shanghai, China); di-Potassium hydrogen phosphate trihydrate and Potassium dihydrogen phosphate from Xilong Chemical Co. Ltd. (Shantou, Guangdong, China); trifluoroacetic acid (TFA) from Nanjing Chemical Reagent Co., Ltd. (Nanjing, China); Demethyl sulfoxide from Sinopharm Chemical Reagent (Nanjing, China); Ethyl acetate from Nanjing Chemical Reagent Co., Ltd. (Shanghai, China). Acetonitrile (HPLC grade) and methanol (HPLC grade) were purchased from Tedia (Fairfield, OH, USA). Distilled water, prepared from demineralized water, was used throughout the study.
Chromatographic condition
The chromatographic system was performed by LC-2010A HT high performance liquid chromatograph (Shimadzu, Japan). The assay was performed on ACE-C18 column (250 × 4.6 mm × 5 μm) (ACE, UK) and a InertSustain C18 precolumn (4.0 × 10 mm × 5 μm) (Shimadzu, Japan) was fitted just before the inlet junction of the analytical column. The mobile phase consisted of methanol-water containing 0.1% TFA (55:45 v/v) at a flow rate of 1 mL/min with UV detection at 257 nm. The column temperature was maintained at 30 °C, and the injection volume was 10 μL.
Incubation of iguratimod with the recombinant human CYP450s yeast cells
The incubation mixture (4 mL final volume) of recombinant CYP450s yeast whole-cell transformation system includes 1 g recombinant CYP450s yeasts containing c-DNA expressed P450s (CYP1A2, CYP2C8, CYP2C9, CYP2C19, CYP2D6, CYP2E1 or CYP3A4), 2 mL 0.2 M K2HPO4 phosphate buffer (pH 7.4), 0.4 mL 20% D-(+)-Glucose solution, 1.4 mL sterile water and 0.2 mL 10 mM iguratimod dissolving in DMSO to make the final system consisting of 2% glucose solution and 0.5 mM iguratimod. Seven types of recombinant human CYP450s yeast whole-cell reaction system at seven individual 50 mL tubes were initiated at the parallel time. The mixture in each tube was incubated for 72 h at 30 °C. The samples were collected from the incubation system at 0, 24, 48, and 72 h by taking 100 uL reaction solution to 1.5 mL clean and dry tubes and adding 200 μL methanol. The samples were fully extracted by vortex-mixing for 2 min. After centrifugation at 12,000×g for 10 min, the supernatant was collected and an aliquot (10 μL) was injected into the chromatographic system for analysis.
Identification of the iguratimod metabolite in rat plasma sample
Male Sprague-Dawley rats (180-200 g) were obtained from Jiesijie experimental animal Co., Ltd. (Shanghai, China) (license key, SCXK 2013-0006) and housed with a 12 h light/12 h night cycle at ambient temperature (about 25 °C) and 60% relative humidity. Free access to food and water was allowed at all times except for fasting 12 h before the experiment but with free access to water. All animal experiments were carried out according to the Guidelines for the Care and Use of Laboratory Animals, and were approved by the Animal Ethics Committee.
To a 50 μL aliquot of rat plasma, 25 μL Phenacetin IS solution (20 μg/mL) and 25 μL acetonitrile were added. After vortex-mixing for 2 min and centrifugation (12,000×g) for 10 min, the supernatant was collected and an aliquot (10 μL) was injected into the chromatographic system for analysis.
Preparation and isolation of the iguratimod metabolite
To prepare the metabolite of iguratimod, recombinant human CYP2C9 yeast cell reaction system was used according to the method described above. Total volume of the system is 80 mL which contains 20 g recombinant CYP450s yeasts, 40 mL 0.2 M K2HPO4 phosphate buffer (pH 7.4), 8 mL 20% D-(+)-Glucose solution, 28 mL sterile water and 4 mL 10 mM iguratimod dissolving in DMSO. After incubation at 30 °C for 72 h, 160 mL acetic ether were added to stop the reaction. Then the acetic ether extraction solution was concentrated by a rotary evaporator and then redissolved using 10 mL methanol. Preparative HPLC was performed in an isocratic elution mode using Durashell C18 (250 mm × 10 mm, 10 μm). The isocratic mobile phase of water-methanol (52:48, v/v) containing 0.1% TFA (v/v) was run at a flow rate of 7 mL/min. Other parameters were as follows: detection wavelength, 257 nm; injection volume, 200 μL; column and ambient temperature, 25 °C. The eluents were freeze-dried by a Bilon freeze dryer to prepare the metabolite powder.
Identification of the iguratimod metabolite structure by QTOF-MS and Nuclear magnetic resonance spectroscopy
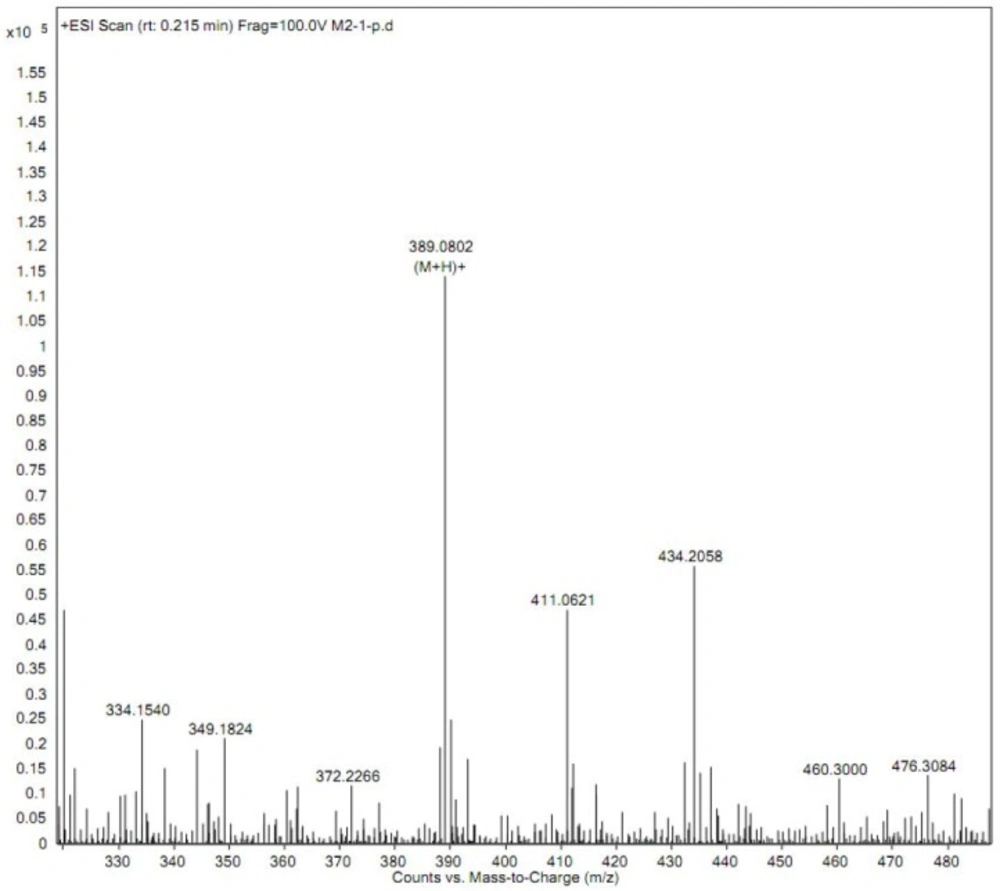
HR-MS spectral data was obtained on Agilent technologies 6520 Accurate-Mass QTOF-MS instruments (Agilent, USA). Data acquisition was performed with Agilent Mass hunter Workstation with advanced data acquisition and data analysis capabilities. The mass spectrometer was operated in the ESI-positive mode, and the MS data were collected at the range of 320 to 490. The HNMR spectra were recorded on Bruker AV-300 (300 MHz) apparatus (Bruker, USA).
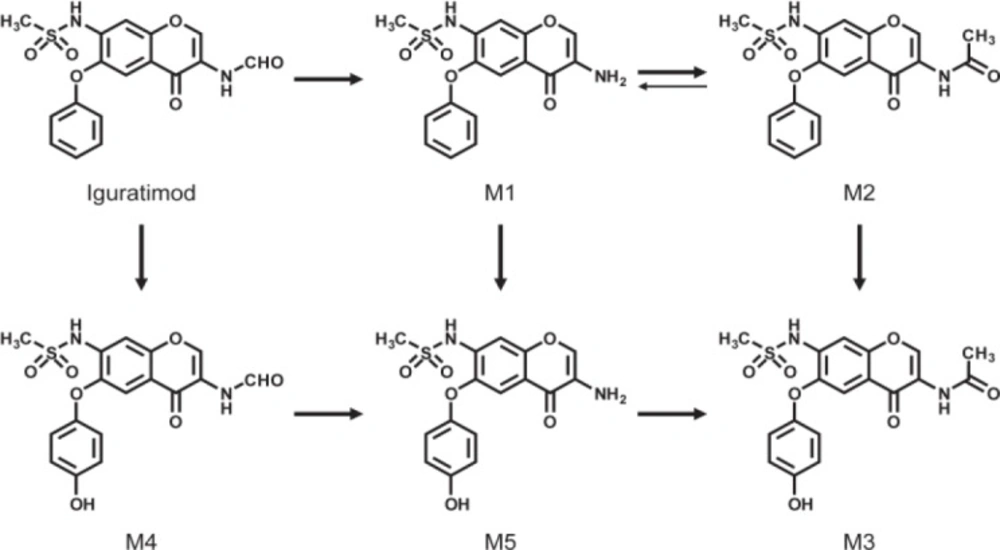
Metabolites and possible pathways of iguratimod
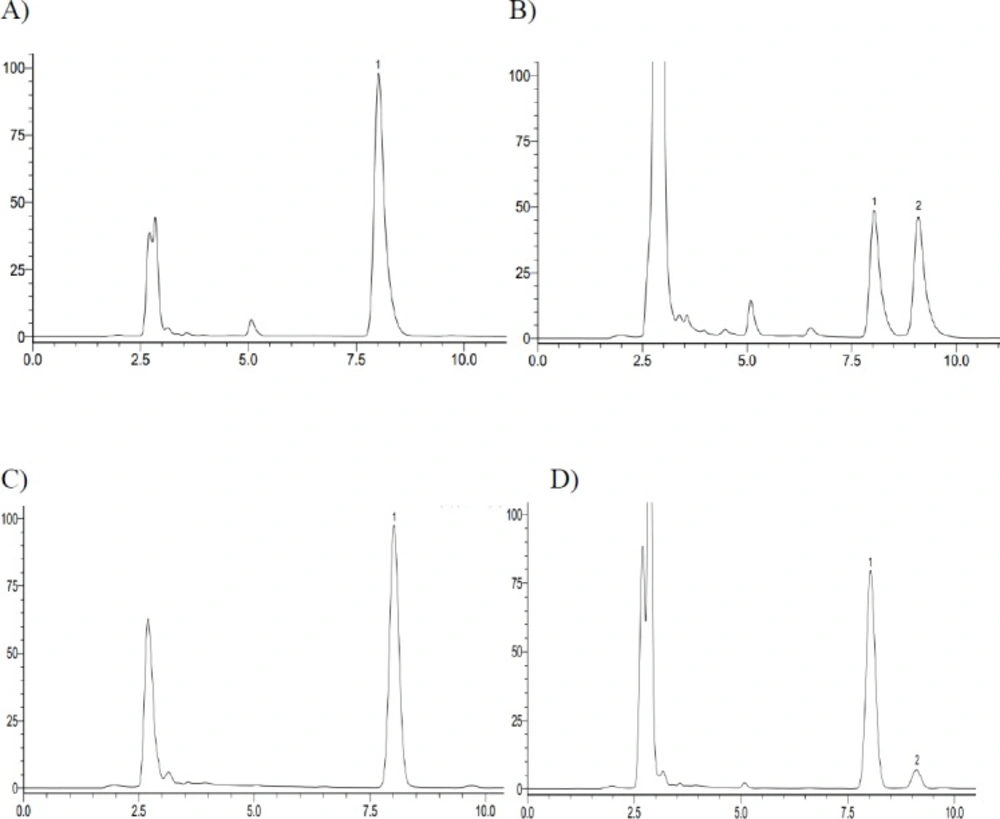
The representative HPLC chromatograph obtained from the analysis of reaction solutions in the recombinant human CYP2C9 and CYP2C19 reaction system after 72 h incubation. (A) CYP2C9 incubation – 0 h; (B) CYP2C9 incubation – 72 h; (C) CYP2C19 incubation – 0 h; (D) CYP2C19 incubation – 72 h (1. Iguratimod; 2. iguratimod metabolite)
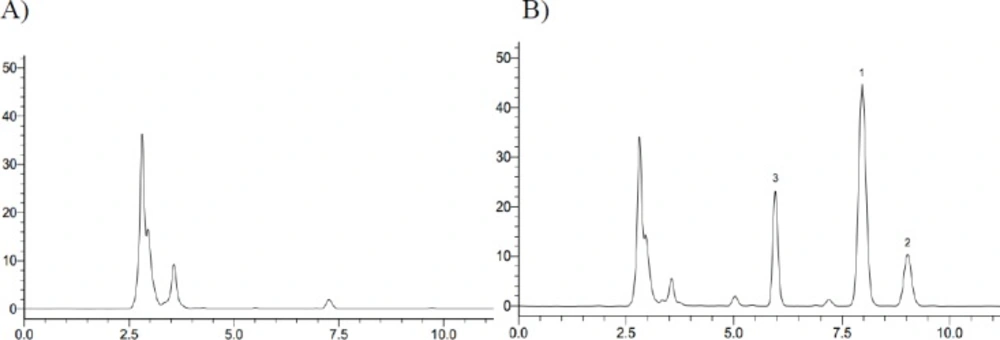
Typical HPLC chromatograph for iguratimod and its metabolite in rat plasma. (A) Rat blank plasma; (B) Rat plasma sample at 6 h after oral administration of iguratimod + Phenacetin (1. Iguratimod; 2. iguratimod metabolite; 3. IS, Phenacetin)
Product ion mass spectra of iguratimod metabolite
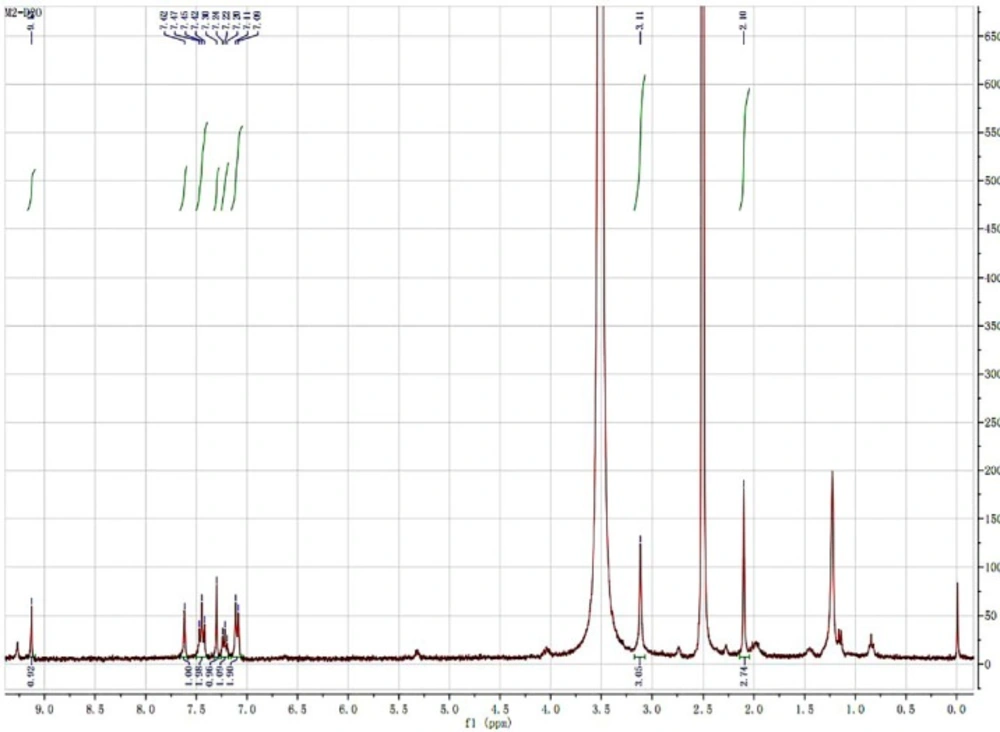
HNMR spectra of iguratimod metabolite
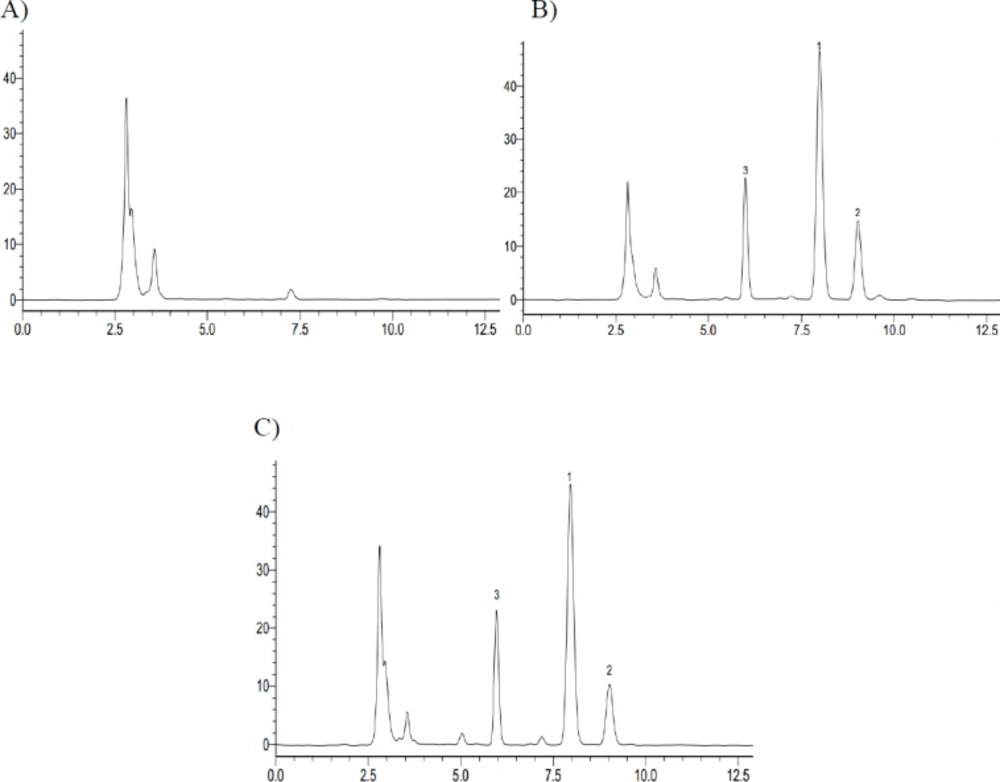
High Performance Liquid Chromatography of iguratimod, a iguratimod metabolite M2 and Phenacetin in Rat Plasma. (A) Blank plasma; (B) Standard plasma samples; (C) Plasma samples at 6 h after oral administration of iguratimod (1. Iguratimod; 2. iguratimod metabolite; 3. IS, Phenacetin)
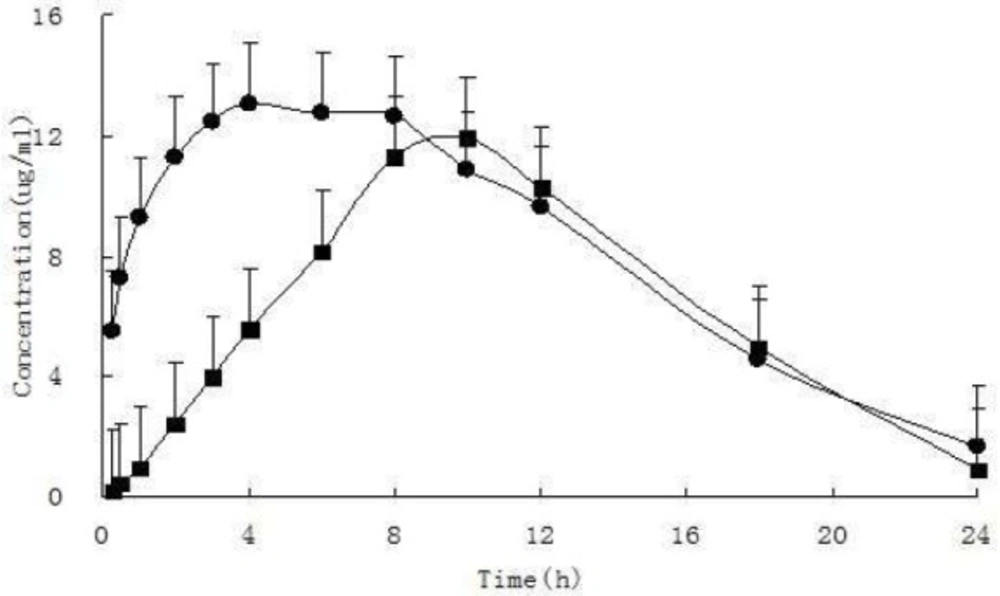
Mean plasma concentration-time profiles of iguratimod and iguratimod metabolite in rat plasma after oral administration of10 mg/kg iguratimod. (mean ± SD. n = 7). (●iguratimod; ■iguratimod metabolite M2)
| Analytes | Spiked (ug/mL) | intra-day
| inter-day
| Extraction Recovery
|
|---|
| Precision (RSD%) | Accuracy (RE%) | Precision (RSD%) | Accuracy (RE%) | Mean (%) | Precision (RSD%) |
|---|
| iguratimod | 0.5 | 2.29 | -1.75 | 2.36 | -6.79 | 98.25 ± 0.01 | 2.29 |
| 10 | 0.48 | 4.12 | 0.21 | 3.67 | 104.12 ± 0.50 | 0.48 |
| 20 | 0.15 | -2.75 | 1.16 | -1.58 | 97.25 ± 0.03 | 0.15 |
| iguratimod metabolite | 0.5 | 1.56 | -4.21 | 1.90 | -4.95 | 95.79 ± 0.01 | 1.56 |
| 10 | 0.52 | -2.79 | 0.29 | -2.69 | 97.21 ± 0.50 | 0.52 |
| 20 | 0.56 | -3.33 | 1.19 | -2.55 | 96.67 ± 0.11 | 0.56 |
| Parameters | units | iguratimod | iguratimod metabolite |
|---|
| t1/2 | h | 5.12 ± 2.45 | 3.70 ± 0.85 |
| Cmax | mg·L-1 | 14.16 ± 2.24 | 12.56 ± 3.58 |
| Tmax | h | 5.86 ± 2.19 | 9.14 ± 1.07 |
| AUC0→24 h | mg·h·L-1 | 197.42 ± 16.58 | 151.79 ± 41.47 |
| ClZ | L·h-1·kg-1 | 0.05 ± 0.00 | 0.07 ± 0.02 |
| VZ | L·kg-1 | 0.34 ± 0.13 | 0.38 ± 0.19 |
Method validation of HPLC
To assess selectivity of the method, blank plasma samples obtained from seven rats were processed by the same extraction procedure and chromatographed to determine whether endogenous components would interfere with the determination of iguratimod, iguratimod metabolite, and internal standard (Phenacetin).
The Calibration curves were prepared by assaying standard plasma samples at six concentration levels of iguratimod and metabolite over the range of 0.5-20 ug/mL, respectively. The calibration curves were constructed by plotting the peak area ratio of analytes to IS, and concentrations being used as y and x variables in a standard regression analysis. The lower limit of detection was defined as the detected concentration when the S/N ratio is 3.
Precision and accuracy were carried out in three replicates at 0.5, 10, and 20 µg/mL on the same day and on three consecutive validation days. The accuracy was expressed as relative error (RE%). The precision was calculated by relative standard deviation (RSD%). Intra- and inter-day precisions calculated as RSD (%) were required to be below 15% and accuracy as RE (%) to be within ±15%. Recoveries of the iguratimod and iguratimod metabolite were determined by comparing post-extraction standard plasma concentrations and control standard samples at corresponding concentrations.
Application to pharmacokinetic studies
The studies were approved by the Animal Ethics Committee of China Pharmaceutical University. The animals were adapted to the facilities for one week, and then fasted with free access to water overnight prior to the experiment. The iguratimod tablets were suspended in 0.1% CMC-Na aqueous solution and administered to the rats (10mg/kg bodyweight) by oral gavage. Approximately, 300 μL blood samples were collected from fundus venous plexus before dosing and at 0.25, 0.5, 1, 2, 3, 4, 6, 8, 10, 12 and 24 h following oral gavage. The blood samples were transferred to heparinized Eppendorf tubes and centrifuged at 4000×g for 10 min to separate the plasma. The plasma samples were immediately frozen at -80 °C until analysis. The pharmacokinetic parameters of iguratimod and its metabolite were calculated using Phoenix WinNonlin® 6.1 version. All results were represented as mean ± SD.