Characterization of GO nanosheets
The synthesized nanomaterial was characterized by FT-IR, XRD, and SEM. The XRD spectra of GO (Figure S1, supplementary information) reveals a high intensity peak at 2θ values of 12.81 with 6.9 Å interlayer corresponding to GO structure and very less intense peak at 2θ values of 26.48 Å interlayer corresponding to non-oxidation graphitic structure. The FT-IR spectrum of graphene oxide (Figure S2, supplementary information) confirms the successful oxidation of the graphite. The presence of different types of oxygen functionalities in graphene oxide were confirmed by a broad and wide peak at 3425 cm-1. The peak at 1721 cm-1 can be attributed to CO carboxylic. From Figure S3, it can be clearly seen that the GO nanosheets have a layered structure, with waves-like sheets, large surface area, and wrinkled edge.
Adsorption isotherms of AMP and CLI on GO nanosheets
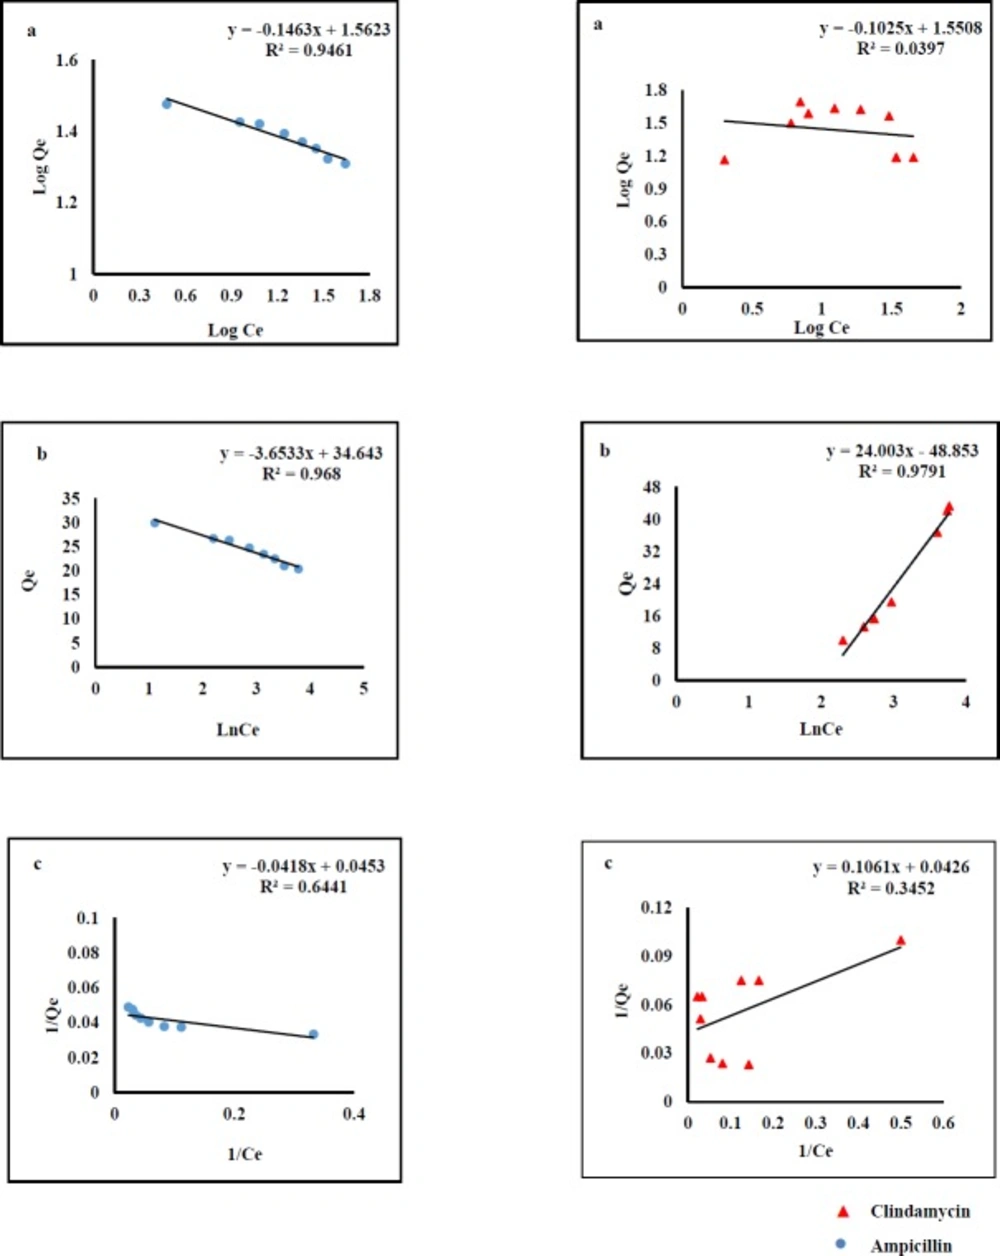
Adsorption isotherms were used to describe AMP and CLI adsorption characteristics. The results clearly indicated that the adsorption capacity increases with rising the equilibrium concentration of the analytes. The equilibrium data were fitted by three isotherm models named Langmuir, Freundlich, and Temkin (
Figure 1).The fitting parameters of AMP and CLI are scheduled in
Table1. Langmuir model predicts the existence of a single layer of the adsorbate at the adsorbent surface. Freundlich model represents adsorption on heterogeneous surfaces. The chemical adsorption based on electrostatic interaction between adsorbent and adsorbate can be described by Temkin model (40). As it was observed in
Figure 1, the regression values obtained from Temkin (AMP, R
2=0.968; CLI, R
2=0.979) and Freundlich models (AMP, R
2=0.946) are better than those from Langmuir model. This fact reflects that there was an electrostatic interaction under the process of adsorption for both analytes. Cation- π bindings may happen between graphene π-electrons and amino group of AMP molecule (pKa values of 2.5 and 7.3) at the pH 6 and also positive early amine group in CLI structure (pKa values of 7.6 and 7.7) at the pH 7.6 (
40-
42). Considering here that aromatic ring in the molecular structure of AMP and CLI are present, we suggested π- π interactions may be also responsible for the adsorption of analytes onto GO nanosheets. The mathematical representations of the Langmuir Equ. (2), Freundlich Equ. (3), and Temkin Eq. (4) are given below:
Equ, 1
Equ, 2
Equ, 3
Where Qmax is the theoretical maximum adsorption capacity per unit weight of the adsorbent (mg g-1); Kl, Kf and (A, B) are adsorption constants of Langmuir, Freundlich, and Temkin models, respectively, and n is the Freundlich linearity index.
Effect of temperature
The effect of temperature on the adsorption of AMP and CLI onto GO was investigated at 293, 298, 303, 313, 323, and 333 K. The adsorption energy changes of AMP and CLI on GO can be determined by thermodynamics analysis. The thermodynamics parameters such as standard enthalpy change (ΔH
0, kJ mol
-1), standard entropy change (ΔS
0, J mol
-1K
-1), and standard Gibbs free energy change (ΔG
0, kJ mol
-1), were presented in
Table 2. The standard Gibbs free energy changes are found to be negative at all temperatures, showing that the adsorption of AMP and CLI on GO was thermodynamically feasible process. At the same time, the values of standard Gibbs free energy changes were relatively close to each other with an increase from 293 to 333 K, indicating the effect of temperature on adsorption of AMP and CLI was slight.
The standard enthalpy change value was calculated to be negative which means that the adsorption of AMP and CLI on GO was an exothermic process. In addition, the positive change of standard entropy reveals the randomness adsorption process (
43). The dependence on temperature of sorption of AMP and CLI by GO are evaluated by the following equations:
Equ, 4
Equ, 5
Equ, 6
Where ΔH, ΔS, ΔG, T, R, and KC are the enthalpy, entropy, Gibbs free energy, absolute temperature (K), ideal gas constant (8.314 J mol -1), and equilibrium constant, respectively. Plots of log KC against 1/T give numerical values of ΔH and ΔS from the slope and intercept, respectively.
Optimization of GO based d-SPE parameters
In order to obtain the adsorption capacity (Qe) the main parameters, including sample pH, contact time, eluent solvent, elution volume, and desorption time were studied and optimized. Besides, the reusability of the sorbent was also discussed. All the tests were performed in triplicate at ambient temperature and the means of the results were used for optimization of the method.
Effect of pH
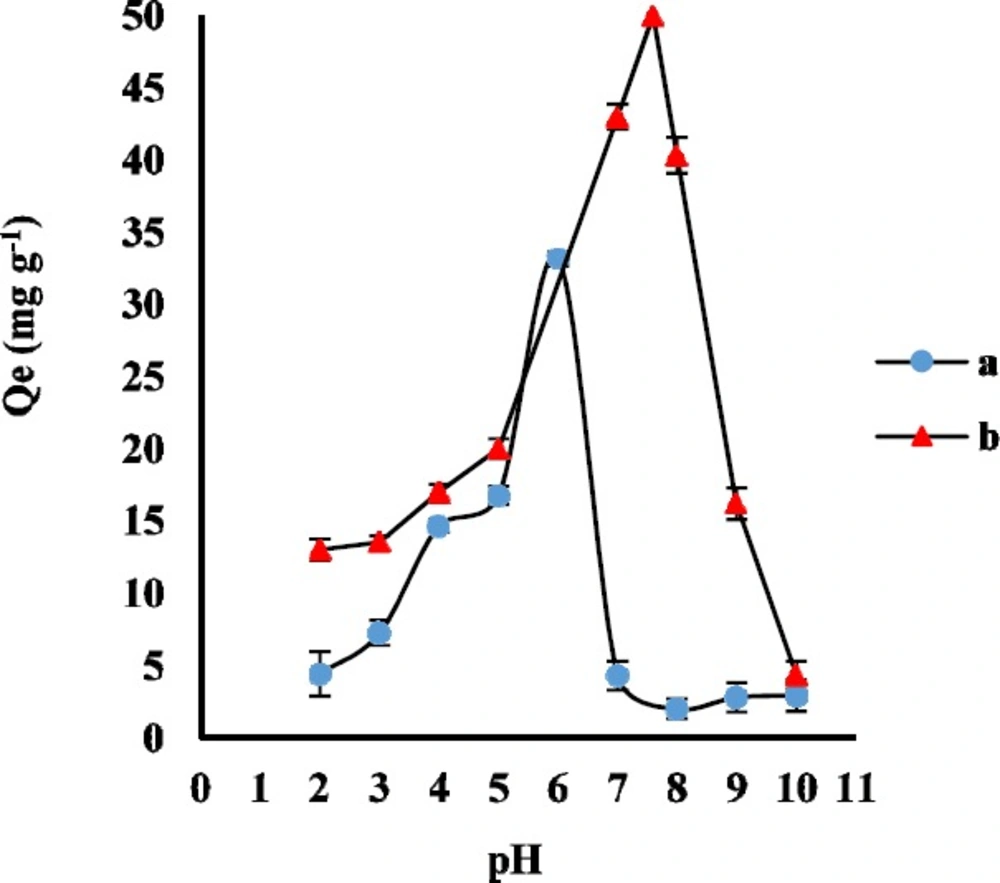
Generally, the pH of the sample solution determines the molecular or ionic form of the analytes and the surface charge of the sorbent. AMP structure has the primary amine and carboxyl groups with pK
a 7.3 and 2.7, respectively. Moreover, CLI structure has two proton binding sites with pK
a 7.6 and 7.7. In order to evaluate the effect of sample pH on the adsorption of AMP and CLI on GO, the appropriate volumes of phosphate buffer were used to adjust the pH values between 2 to 10. The experiment was carried out for adsorption of 2 ng mL
-1 AMP and 5 ng mL
-1 CLI on 3 mg GO as adsorbent for a contact time of 30 and 35 min, respectively. As it was shown in
Figure 2, the Q
e significantly increased from pH 2 to 6 for AMP and pH 2 to 7.6 for CLI, and reached the maximum value at pH 6.0 and 7.6 due to strong attraction between the negative charge of GO functional groups (such as -OH and -COOH) and the protonated AMP and CLI. Therefore, buffer solution of pH 6 and 7.6 were selected as the working pH for the following AMP and CLI experimental studies, respectively.
Effect of contact time
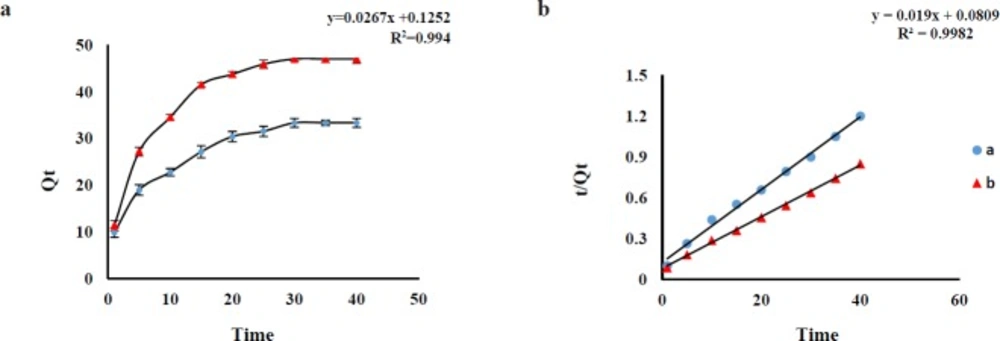
In order to optimize the best contact time, the effect of shaking time on the Q
e was investigated in the range of 1 to 40 min (AMP and CLI) at ambient temperature. The results revealed an increasing trend of AMP and CLI adsorption over time and the adsorption equilibrium was achieved after about 30 min for AMP and 35 min for CLI with desired pH. The adsorption capacities (Q
e, mg g
-1) of the AMP (at a time of 30 min) and CLI (at a time of 35 min) were about 32.70 and 49.63 mg g
-1, respectively, which are sufficient for the adsorption of trace amounts of AMP and CLI from sample (
Figure 3a). Pseudo-first-order and pseudo-second-order adsorption kinetic models were used to analyze the experimental data for the AMP and CLI adsorption onto GO at different time. The fitting parameters are scheduled in
Table 3. AMP and CLI adsorption processes on GO were fitted by pseudo-second-order kinetic model (
Figure 3b), which also were confirmed according to the correlation coefficient values (AMP, R
2=0.994; CLI, R
2=0.998) for pseudo-second model, higher than that of pseudo-first-order (AMP, R
2=0.922; CLI, R
2=0.961), suggesting that the adsorption system may be controlled by chemical reaction and adsorption capacity is proportional to the number of active sites on adsorbent surface(30). The comparison between the experimental (exp) adsorption capacity (AMP, Q
e exp: 33.10 mg g
-1; CLI, Q
e exp: 50.11 mg g
-1) value and the calculated (cal) adsorption capacity (AMP, Q
e cal: 37.1 mg g
-1; CLI, Q
e cal: 53.47 mg g
-1) value shows that Q
e cal values are very close to Q
e exp values for the pseudo-second-order kinetics. The pseudo-first-order (Equ. 8) and -second-order (Equ.9) adsorption kinetic models are expressed as follows:
Equ, 7
Equ, 8
Where Qe and Qt are the adsorption amount (mg g-1) at equilibrium and time t, respectively, K1 and K2 are equilibrium rate constant of pseudo-first and -second- order sorption.
Effect of type and volume of eluent
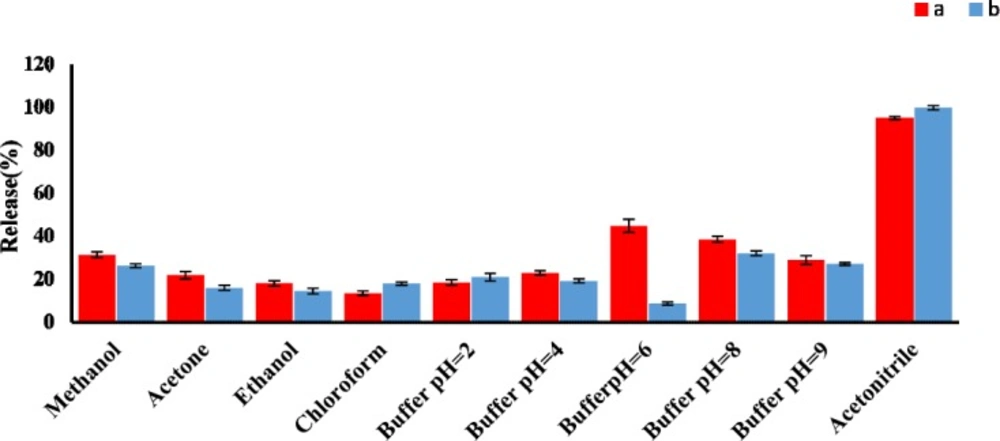
A good desorbing solvent in d-SPE should effectively elute the adsorbate with the lowest volume without damaging the nature of the adsorbent surface. In the present study, different solvents such as acetonitrile, methanol, and different phosphate buffer pH 2 to 9, were tested to obtain the best eluent for the removal of AMP and CLI and their release efficiencies were evaluated. The results shown in
Figure 4 clearly indicated that acetonitrile had the highest release percent in comparison with other solvents. Under the same experimental conditions, the effect of eluent volume on release efficiency of AMP and CLI were investigated in the volume range of 1 to 5 mL. Our results indicated that an acceptable preconcentration factor and release can be obtained using acetonitrile (5 mL) as eluent for both analytes (Figure S4, supplementary information).
Effect of desorption time
Desorption time is another main factor influencing the recovery of the AMP and CLI. Hence, it was optimized by increasing the shake time from 1 to 60 min. The influence of desorption time on the release percent is shown in Figure S5. The experimental results indicated that 30 min was enough for eluting the adsorbed AMP and CLI from the surface of the GO sorbent, and it was selected as the appropriate desorption time for both drugs.
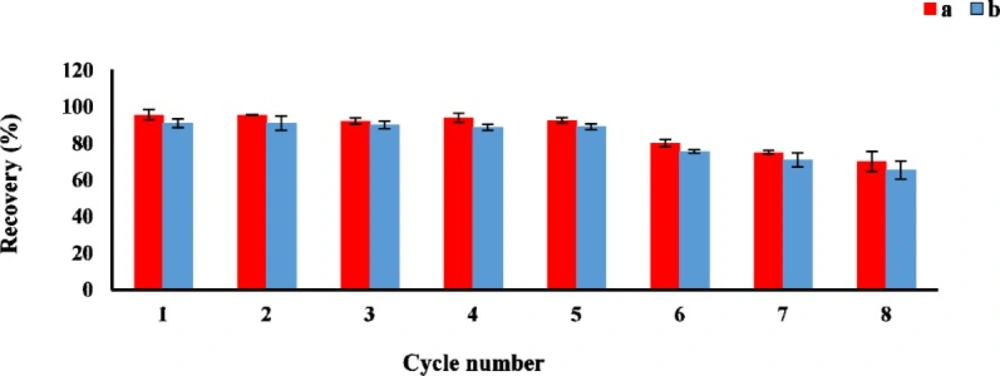
Reusability of the sorbent
The reusability is one of the important factor for evaluating the stability and efficiency of the adsorbent. The sorption-desorption batch cycles were repeated 8 times by the aforesaid procedure. After each cycle, the GO as sorbent was isolated and washed three times with acetonitrile, then air-dried at room temperature before reusing in the next cycle. As shown in
Figure 5, the GO could be effectively reused at least 8 times without a significant loss of the sorption capacity.
Effect of sample volume and validation parameters
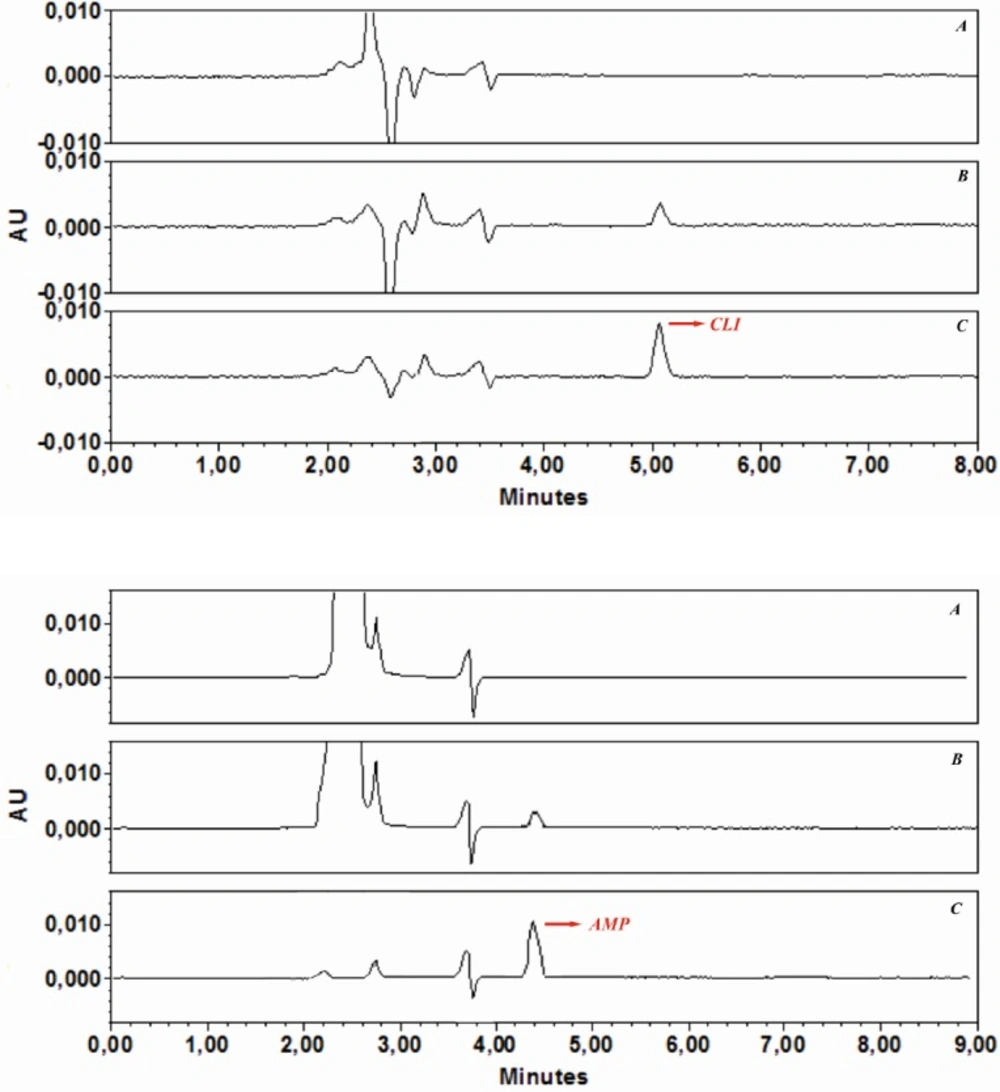
In the analysis of real samples, the sample volume is one of the important parameters influencing the pre concentration factor. Therefore, the effect of sample volume on quantitative adsorption of spiked AMP and CLI in tap-water was investigated, and all water samples were also filtered through a cellulose acetate membrane syringe filter. For this purpose, GO (3 mg) was dispersed in different sample volumes (20, 50, 100, 250, 500, 750 and 1000 mL) containing appropriate volumes phosphate buffer solution pH 6 for AMP and pH 7.6 for CLI Then, the obtained suspensions were shacked 30 min (AMP) and 35 min (CLIN), respectively. The samples were then submitted to the procedure of extraction and chromatographic analysis described above. The recoveries were found to be stable until 100 mL. After determination of preconcentration factor for both analytes, in order to demonstrate the applicability of the developed GO-based d-SPE-HPLC-UV method for analysis of AMP and CLI in the real samples, it was applied to the extraction and determination of both analytes in the water under the optimized conditions. The typical chromatograms of (a) a blank water sample before being spiked with AMP and CLI, (b) after spiking with AMP (2 ng mL
-1) and CLI (5 ng mL
-1), and (c) preconcentration with GO under optimized conditions are shown in
Figure 6a, b, and c. The comparison between the purity threshold and angle in Empower software revealed that the methods were specific for AMP and CLI. Analytical performance under the optimum conditions described, the calibration curves were linear over a concentration range of AMP (0.5-200 ng mL
-1) and CLI (1-200 ng mL
-1). Statistical and calibration parameters are shown in
Table 4. The LOQ were found to be 0.12 (AMP) and 0.71 (CLI) ng mL
-1. As it was shown in
Table 4, the low values of the relative standard deviation proved that the method was precise and repeatable. The preconcentration factor of 20 was obtained by the ratio of the slopes of the linear section of the calibration curve before and after preconcentration. These results demonstrated that the GO-based d-SPE combined with HPLC-UV analysis was reliable for measurement of trace amount of AMP and CLI in water samples.
Comparison of GO-based d-SPE with other reported methods
A comparison between the performance characteristics of the proposed method and previous reported methods for the analysis of AMP and CLI in aqueous samples are summarized in
Table 5. The most commonly analytical methods applied to the determination of AMP and CLI in water samples are LC-MS and LC-MS-MS (
7-
17), but these methods require expensive equipment and expert staff which are not readily available in many laboratories. Additionally, it is necessary to dry the final eluent of SPE before separation into the chromatographic system in the majority of previously reported methods (
7-
17,
19,
20,
21). The separation process in this method was highly efficient without the need for evaporation step. The reported LC-MS and LC-MS-MS with evaporation technique required a longer time for equilibrium to be established. As shown in
Table 5, the GO-based d-SPE-HPLC-UV methods have a little higher LOQ than some of the reported methods, which can be attributed to the sensitivity of the detection technique and evaporation process. These methods can be applicable in monitoring of AMP and CLI in environmental water samples. The developed methods in this work for AMP and CLI analysis in water samples showed a good recovery and repeatable results.