1. Background
Breast cancer has a second-degree mortality rate among women aged 45 to 55 (1). Depending on the stage of breast cancer, one out of eight women would indeed require treatment such as chemotherapy, tissue removal, radiotherapy, and hormone therapy (2). Despite the multispectral etiology of breast cancer, less information has been provided regarding the biochemical aspects of its progression. The metastatic ability of cancer cells by resistance to chemotherapy challenges its therapeutic management. The power of cancerous cells to deviate apoptosis processes through mutation or epigenetic alternations (3) brought the urgent need for personalized medicine to exclusively administer a specific drug based on the genetic profile of patients (4). Although there is no consensus about the underlying mechanism of cancer metastatic progression, the lysosome components and their activities within cancer cells have recently drawn much scientific attention (5).
Lysosomes play roles in cell phagocytosis, endocytosis, autophagy, and apoptosis (6, 7). It has been recently discussed that lysosomes contribute to cancer cell invasion, angiogenesis, and drug resistance (5). Notably, the lysosome membrane in cancerous cells is weaker than in normal cells. Since this defect can result in apoptotic susceptibility, it can be a vital targeting strategy in developing an efficient cancer therapy (8). Achieving this goal needs comprehensive knowledge about the involved genes in either lysosomal biogenesis or autophagy processes. Currently, the Coordinated Lysosomal Expression and Regulation (CLEAR) gene network, along with over 500 target genes of transcription factor EB (TFEB), has been recognized in the biogenesis and function of lysosomes and autophagy (9, 10). Addressing an ideal therapeutic target needs enough knowledge concerning the exact signaling pathways of the lysosomal process (11, 12). Experimental studies on multifactorial diseases are time-consuming and costly, but they can also poorly validate involved genes. The application of high-throughput bioinformatics tools and computational analysis can provide important information about exclusive candidate genes and proteins in either biological or disease processes (13).
The uncontrolled growth of cancer cells under harsh conditions leads to the depletion of nutrients and aggregation of damaged proteins and organelles. As a result, lysosomes and their enzymes, through autophagy, catabolism, growth, and recycling programs, provide nutrients for other cancer cells' further development and survival (14). Lysosomes have been widely studied in tumors' chemoresistance in cancer cells by exocytosis. The storage of chemotherapy drugs in the lysosomes has also been mentioned as a lysosome-dependent drug resistance mechanism (4). Since systems biology approaches identify the regulatory role of the master gene for lysosomal biogenesis (TFEB), this gene network is known as the coordinated lysosomal expression and regulation (CLEAR), consisting of genes involved in lysosomal autophagy flux (8). Moreover, previous experimental studies identified that TFEB promotes the transcription of several lysosomal genes by direct binding to specific E-box sites at their promoters. The results of microarray data, unbiased genomic and expression meta-analysis, and deep sequencing of TFEB chromatin immunoprecipitate (ChIP-seq) revealed a control system by which TFEB coordinates the expression of genes involved in the early and late steps of lysosomal biogenesis (9). TFEB targets 500 - 800 genes, many of which involve lysosomal biogenesis and autophagy. Lysosomes would be considered the Achilles' heel of cancer cells (8).
Gene prioritization is a computational approach for complex diseases that inputs candidate genes and applies several algorithms to rank them. A list of ranked genes will be introduced in the output. Genes with high ranking have the most importance and role in causing the disease (15). One of the ways to identify essential genes that play a vital role in diseases is to analyze the human protein-protein interaction network (HPPIN) and centrality measures. Centrality is the most critical parameter for identifying the gravity of each gene/protein as a node in networks (16).
Meanwhile, PPIs play a regulatory role in many cell-signaling networks associated with "cancer traits," as some PPIs strongly affect cell signaling (17). Another way to help researchers track genes essential in the etiology of diseases is to look for similarities between the studied genes and the marker genes associated with each condition. Scarce data clarify the role of lysosomal genes in drug resistance to breast cancer. To predict novel genes as hall markers of breast cancer, a total of 435 genes involved in the biogenesis and functional structure of lysosomes were profiled as the contributors to breast cancer development. Hence, the characterization of genes participating in lysosomal biogenesis and function is critical in drug-resistant breast cancer treatment.
2. Objectives
The current study aimed to identify the key lysosome-related genes associated with drug-resistant breast cancer.
3. Methods
3.1. Identification of Lysosomal Genes
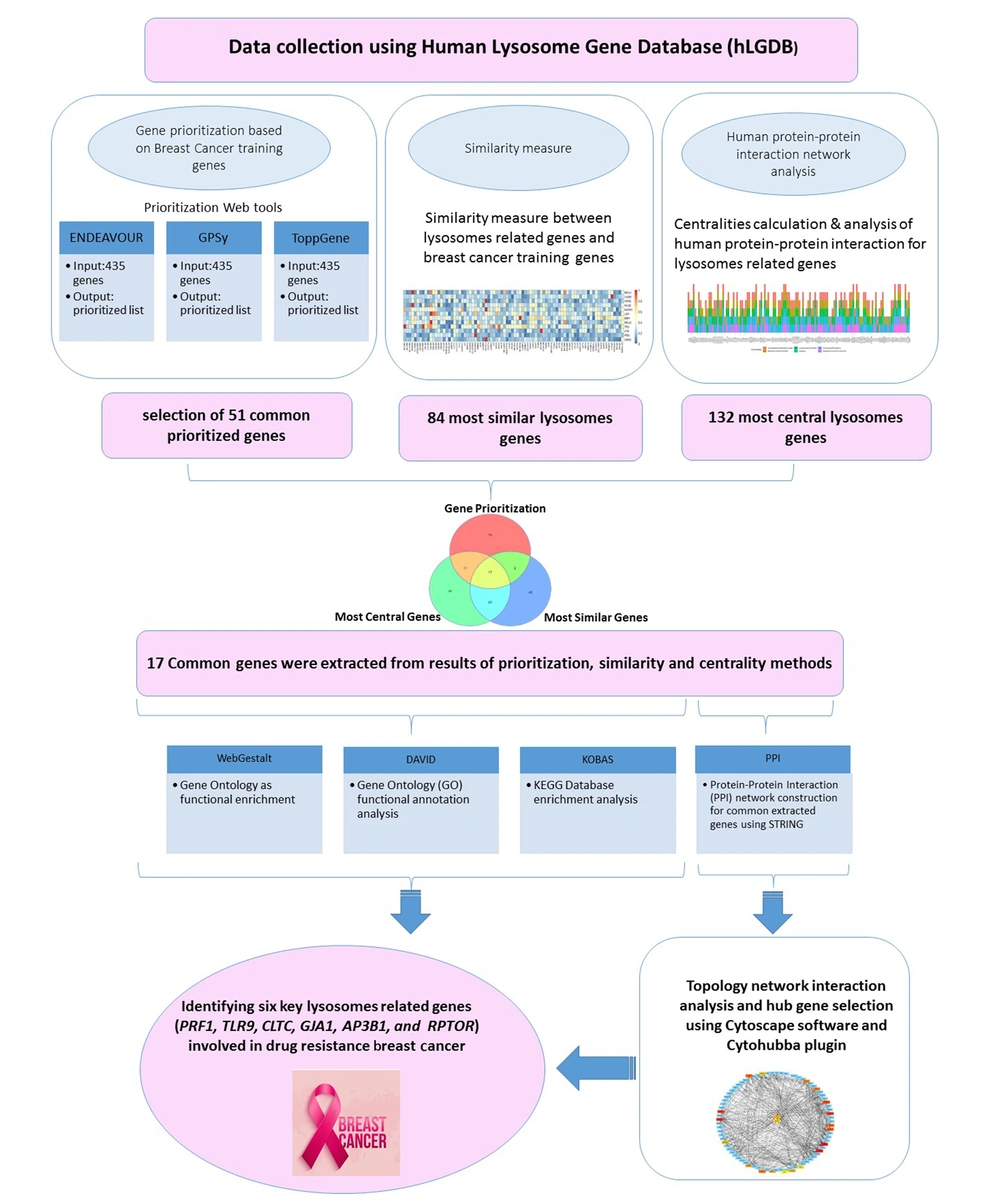
Structural and functional lysosomal genes were identified in the Human Lysosome Gene Database (Lysosome.unipg.it). The chosen genes from datasets were related to the lysosomal encoding proteins that provided information about miRNA-gene interactions and targeted genes of the CLEAR network by TFEB binding motif and binding sites. The filter algorithm used in this study was miRTarBase, and default data of CLEAR and TFEB binding motif of The Human Lysosome Gene Database were utilized. Four hundred thirty-five genes were identified as input candidates for gene prioritization, HPPIN analysis, and similarity measures. The project workflow, including data preparation, applied tools, analysis, and validation, is presented in Figure 1.
3.2. Gene Prioritization by ToppGene, GPSy, and Endeavour
Three software packages conducted gene prioritization according to the data source, popularity, and year. The Endeavour web tool is available at https://endeavour.esat.kuleuven.be/. Data from multiple heterogeneous sources were collected according to sequence data, expression data, functional annotations, PPI networks, text mining data, regulation information, chemical and phenotype information, and a priori probabilities. The computational approach of the Endeavour web tool, as the basic machine learning technique, was performed to score and rank the candidate genes that were ultimately merged with other data sources based on an order statistic. The algorithm behind Endeavour for prioritizing genes consisted of three steps. First, the algorithm trained a model of the biological process of interest. The user provided the seed genes. Every model has a sub-model based on the user-selected data source. Then, the algorithm used the model made in the previous step to score the candidate genes. In the last step, the ranked lists based on different data sources were merged with statistical methods to reach a single global ranking.
The gene set prioritization by Endeavour was performed according to cross-validation benchmarks and administered the "gold standard." The prioritized genes were validated using human phenotype ontology, according to a time-stamped benchmark that provides the closest genes to prospective validation. The Endeavour efficiency for gene scoring and prioritization had been approved previously (18). The ToppGene tool prioritizes genes based on functional similarity with the list of training genes publicly available at https://toppgene.cchmc.org/ (19). The GPSy tool, as online software, was applied further to prioritize genes to predict the function of conserved developmental processes like meiosis, gametogenesis, and sex differentiation, which is publicly accessible at http://gpsy.genouest.org (20).
Twelve genes with approved roles in the process of breast cancer had been selected as training genes (21, 22). To ensure the accuracy of analysis, the three top ones of 12 (TP53, BRCA1, and BRCA2) were imported into 435 genes from the lysosomal Gene Database. Since all three genes were located at the top of the ranking, the accuracy of administered tools was confirmed. Common genes were scored by the sum of scores of all methods, then genes with scores more than the median score of all common genes were selected. Finally, the top 51 genes common among the three software were selected.
3.3. Most Similar Lysosomes-related Genes to Breast Cancer Hallmark Genes
The Smith-Waterman alignment performs among all 435 lysosomal genes and 12 breast cancer-related genes. The third quantile of all alignment scores was used as a threshold, and all the lysosomal genes with alignment scores above this threshold were reported as the most similar genes to breast cancer-related genes.
3.4. Most Central Lysosomal Genes in Human PPI Network
A human PPI network (HPPIN) is a graph in which the nodes are human proteins (HPs), and the edges show their interaction. We extracted 288,989 experimental interactions between 20,748 HPs (shown in Appendix 1). Different centralities, including degree (connectivity), neighborhood connectivity, shortest paths, closeness centrality, betweenness centrality (16, 23), and diversity of predators, were applied (24) to score each HP. In the human-virus PPI network, for each HP, each of the virus families that interacts with it is called a predator. For each HP, the mean evolutionary distance of its predators multiplied by the number of its predators is considered its diversity of predators (DP) score (16). The top 100 lysosomal genes with the highest score were chosen for each of these centralities. Finally, genes with at least two centralities were selected as the most central lysosomal genes.
3.5. Extraction of Genes Common in the Output of All Three Methods
Common genes were extracted from analysis results of prioritization, similarity, and centrality methods. The Venn diagram was drawn using 'ggVennDiagram' packages in R. These common genes were considered the selected gene set for subsequent analysis.
3.6. Gene Ontology (GO) Preformation by WEB-based Gene Set Analysis Toolkit (WebGestalt) as Functional Enrichment
The GO enrichment analysis of the common gene set in the protein network was performed using WebGestalt (http://www.webgestalt.org/) (25). For basic parameters options, Homo sapiens, network topology-based analysis (NTA) method, and PPI BioGrid as a functional database were selected as suitable parameters. The network retrieval & prioritization method was used to construct a network for all common gene sets. The TOP method was performed to rank GO terms according to the adjusted p-value. Significant top GO terms were selected.
3.7. Gene Ontology (GO) Functional Annotation Analysis by DAVID
The DAVID tool analyzed the functions of the selected gene set as the GO terms. It is a popular functioning web tool that can functionally annotate and cluster data sets of genes with high success (26, 27). Gene ontology analysis was carried out by the default categories of DAVID tools, including disease, functional categories, GO, pathways, and protein domains.
3.8. KEGG Database Enrichment Analysis with KEGG Orthology Based Annotation System (KOBAS)
KOBAS (http://kobas.cbi.pku.edu.cn/home.do/) (28) evaluated the selected gene set based on KEGG database enrichment analysis. Both the KEGG pathway and KEGG disease databases were included in the evaluation. While the Hypergeometric test/Fisher's exact test was applied as statistical analysis, Benjamini and Hochberg were selected as the FDR correction method.
3.9. Protein-Protein Interaction (PPI) Network Construction and Topology Network Interaction Analysis and Hub Gene Selection
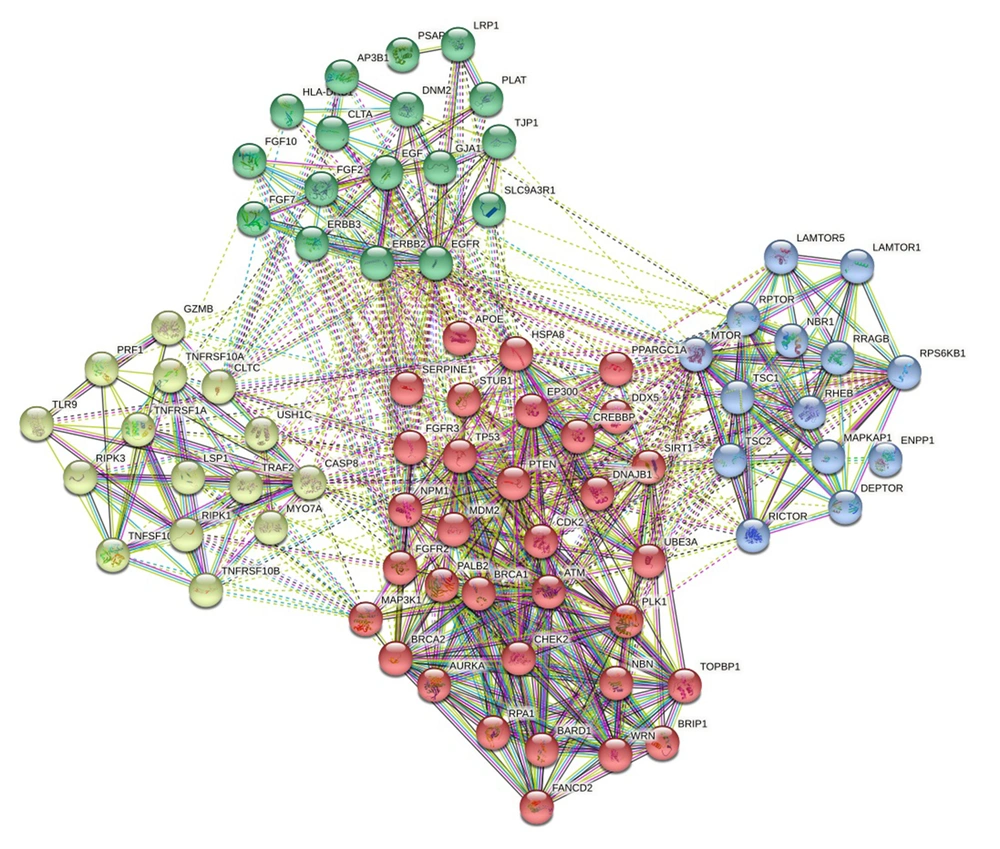
The selected common genes and 12 training genes were administered as input data to construct a PPI network using the STRING database (http://string-db.org/) (29). To create a PPI, Homo sapiens strains were selected. The "add more nodes to current network" option in the string database was selected to increase the number of related proteins and grow interactions. Totally 79 proteins were involved in the PPI network. The minimum interacted score was considered with 0.400 confidence. The K-means clustering was used to better understand protein interactions in the network, as it was categorized into four clusters according to the number of nodes. The constructed PPI network was imported into the Cytoscape software platform to be analyzed and visualized (30, 31). The topologic parameters like network centralization and clustering coefficient were performed with a network analyzer to show the importance of nodes. Hub genes were extracted and analyzed with the Cytohubba plugin.
4. Results
4.1. Selection of Candidate Genes and Prioritization
Four hundred thirty-five genes with structural and functional roles in the lysosomes were selected according to Human Lysosome Gene Database (LGDB). Imported lysosomal genes were selected based on proteomics studies and extracted from Reactome, Uniprot archive, KEGG, and Gene Ontology database, as well as literature reviews and systems biology approach. All 435 selected genes were prioritized using Endeavour, ToppGene, and GPSy web tools. For a list of training genes, we found 12 genes that previous studies had approved as the most related genes to breast cancer. The selected signature of genes was imported into a database analysis tool as training genes, including BRCA1, BRCA2, TP53, PTEN, CASP8, FGFR2, LSP1, MAP3K1, CHEK2, ATM, BRIP1, and PALB2 (21). Each prioritization algorithm ranked the candidate genes based on their significance. Ultimately, the top 51 genes that were common in all three administered tools were selected and prioritized.
4.2. Identification of Most Similar Lysosomes Genes to Breast Cancer Genes and Most Central Lysosomal Genes
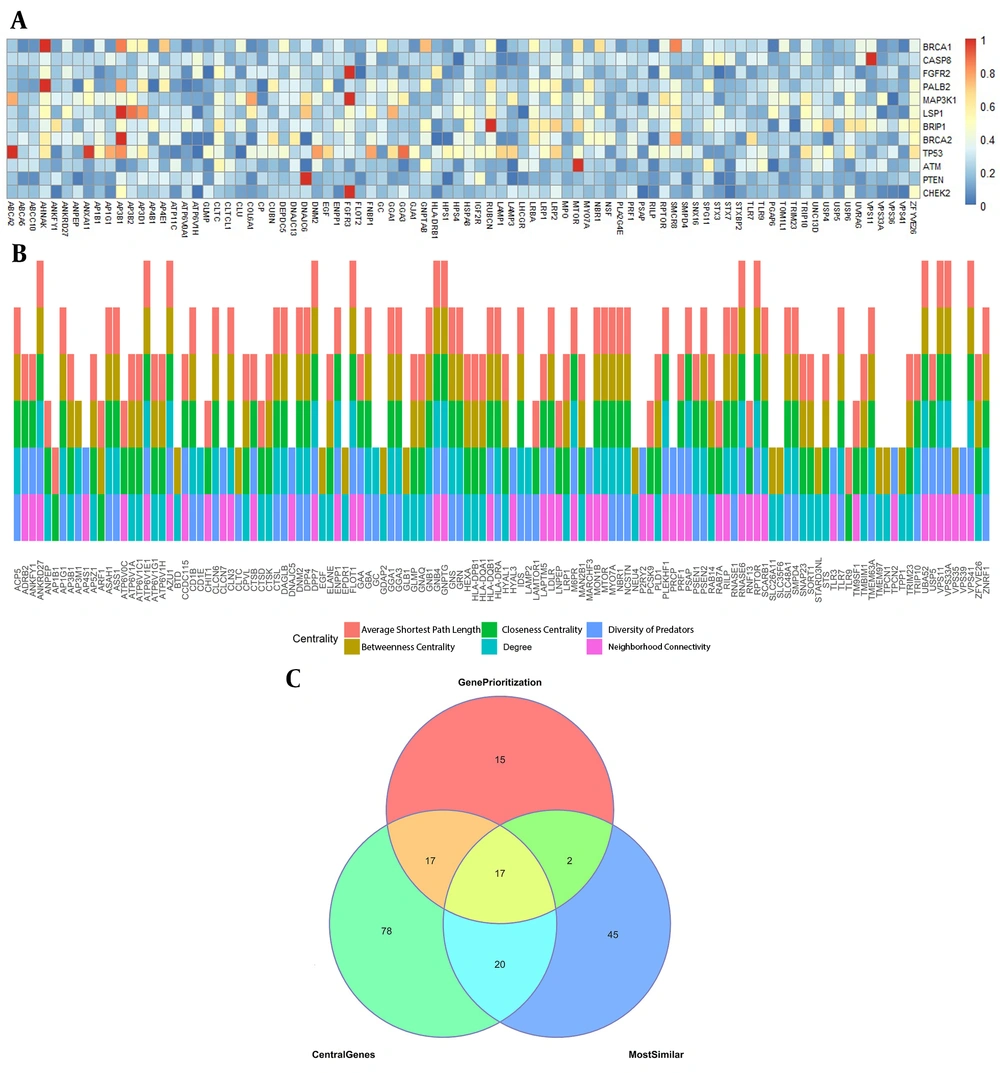
Eighty-four lysosomal genes with alignment scores above median alignment scores and all 12 breast cancer-related genes were selected as the most similar to breast cancer genes. Figure 2A shows these normalized alignment scores. As shown, 132 lysosomal genes were present at least in two centralities and reported as the most central lysosomal genes. For each of these 132 genes, Figure 2B illustrates the centralities in which that gene is central.
4.3. Identification of Lysosomal Genes in All Three Methods
As shown in the Venn diagram of Figure 2C, 17 genes were in the results of all three methods as follows: MTOR, PRF1, FGFR3, TLR9, CLTC, GJA1, HLADRB1, NBR1, HSPA8, DNM2, EGF, LRP1, PSAP, ENPP1, MYO7A, AP3B1, and RPTOR
4.4. Gene Ontology Functional Enrichment of Candidate Genes
The functional enrichment of the selected gene set was analyzed through WebGestalt software. The process was performed according to NTA (network topology-based analysis) methods. The functional database of the selected 17 genes was evaluated with PPI-BioGrid, which confirmed the selected gene set as highly involved in the regulation of cellular response to heat (adjusted P-value = 0.02), antigen processing, and presentation (adjusted P-value = 0.03), and cellular response to starvation (adjusted P-value = 0.05). The threshold for P-value was 0.05. The significance of adjusted P-values was obtained through Bonferroni-Hochberg false discovery rate correction (Appendices 2 and 3).
DAVID web server Gene Ontology analysis enriched prioritized genes in eight annotation clusters. The most critical Gene Ontology terms are described in Appendix 4.
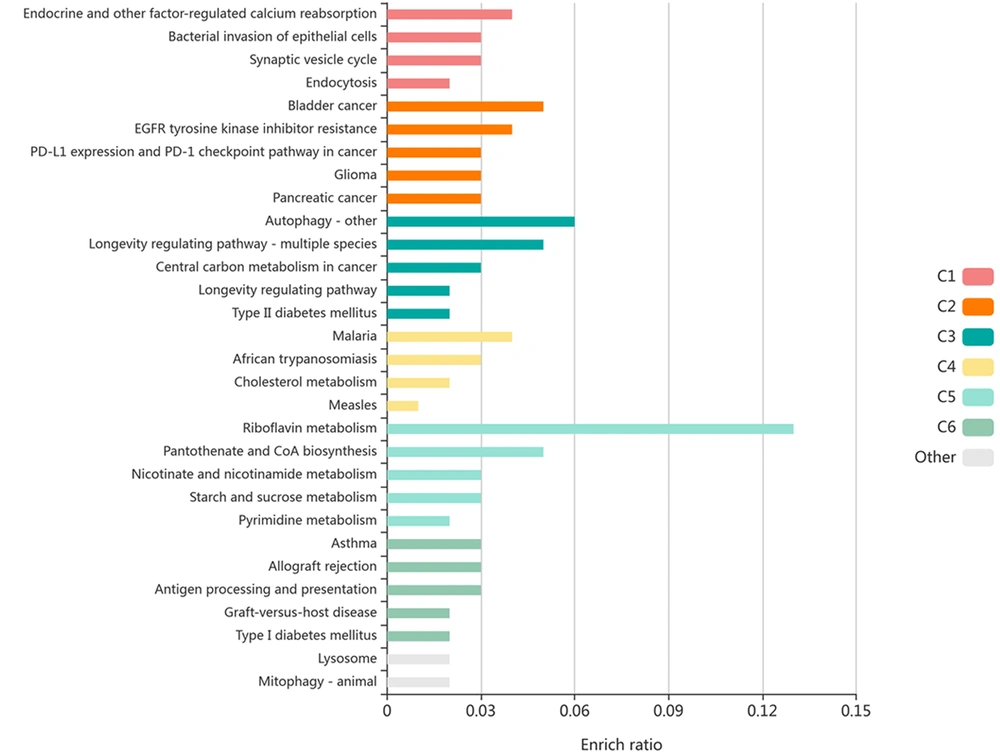
The KOBAS server performed the enrichment of 17 genes for all normal and disease KEGG pathways. The output of KOBAS software is based on the P value and Corrected P-value. In this study, the P-value of less than 0.05 was considered statistically significant. The results showed a significant enrichment in the endocytosis pathways (P-value = 0.00000347; corrected P-value = 0.000279), checkpoint pathway in cancer (P-value = 0.00000827; corrected P-value = 0.000333), and autophagy (P-value = 0.0000982; corrected P-value = 0.00158). The results indicated that the top selected genes are involved in cancer development (Figure 3).
Enrichment of 17 selected genes by KOBAS based on KEGG pathway and disease. The P-value of less than 0.05 was considered statistically significant. Each row represents an enriched function, and the length of the bar represents the enrich ratio, which is calculated as "input gene number"/ "background gene number." The color of the bar represents different clusters. For each cluster, the top five with the highest enrich ratio will be displayed if there are more than five terms.
4.5. PPI Network and Topological Analysis
The PPI network construction using the STRING database was performed for 17 selected common genes and 12 training genes. Four distinct clusters were observed, which were highly interconnected. The network consisted of 79 proteins with 636 connectors, revealing a high degree of functional association of clusters with malignancy (Figure 4). The STRING network was analyzed using Cytoscape. The topologic characteristic of the PPI network was determined using Network Analyzer. The network coefficient clustering was 0.613, indicating the connection of adjacent nodes. This parameter measures nodes' importance in the network and their ability to form clusters. A network clustering coefficient always ranges between 0 and 1. As the value of this parameter approaches 1, it shows the ability of nodes to create clusters (32). Furthermore, network centralization was 0.499. Network centralization as a fundamental network concept is a simple and widely used index of network connectivity distribution. Centralized networks have scores close to 1, whereas decentralized networks are characterized by having a score close to 0 (33).
4.6. Identification of Hub Genes and Biological Significance
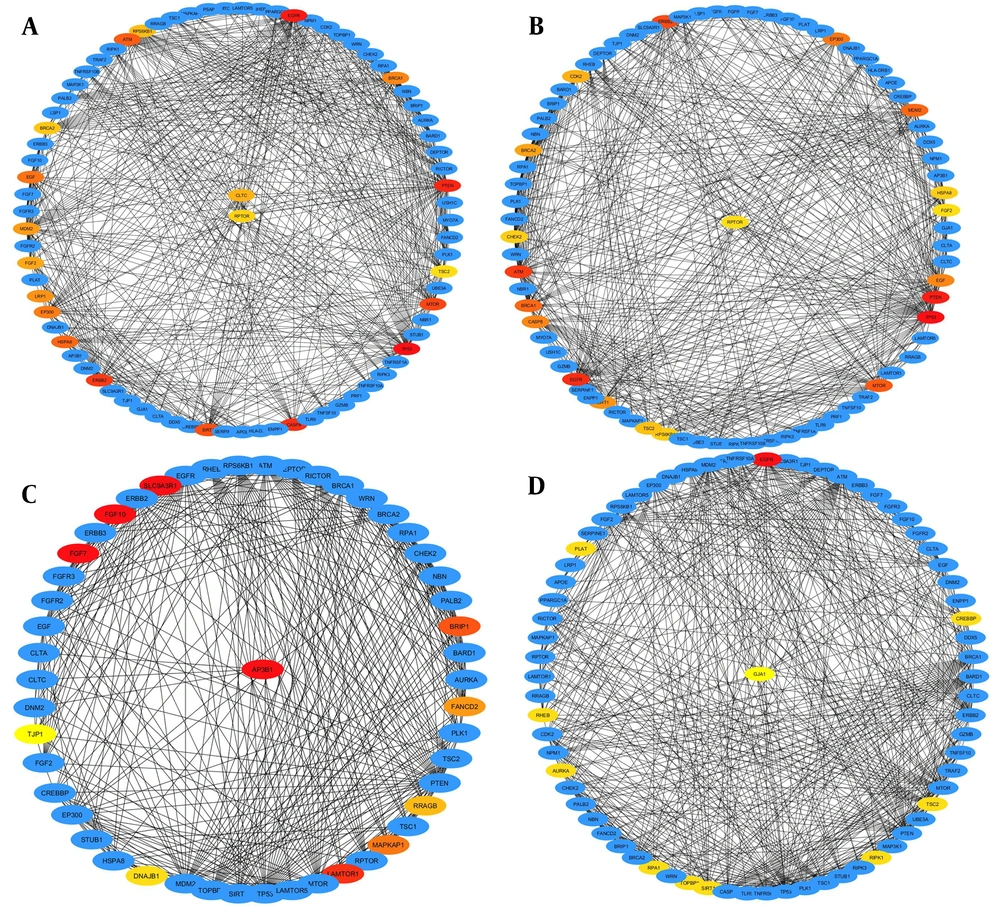
Hub genes of the PPI network were determined using the CytoHubba plugin in Cytoscape software. The results were extracted using all 12 methods in the tool. It is demonstrated that some top 17 prioritized genes were also hub genes. The hub genes were analyzed using four calculating methods (betweenness, degree, clustering coefficient, and eccentricity) (Figure 5A - D).
The constructed PPI network by Cytoscape. Hub genes were identified by the cytoHubba plugin. A, Hub genes were chosen based on the betweenness method; B, Hub genes were chosen based on the Degree method; C, Hub genes were chosen based on the Clustering coefficient method; D, Hub genes were chosen based on the Eccentricity method.
Ultimately, based on biological studies, literature reviews, and comparing all mentioned analyzing methods, PRF1, TLR9, CLTC, GJA1, AP3B1, and RPTOR were introduced as essential genes in breast cancer. The analyses of these six genes suggest that they may have a crucial role in the development of breast cancer, which has rarely been evaluated.
5. Discussion
The present study adds to the growing evidence that implicates the essential roles of the lysosomal genes in drug resistance and human cancer progression. We introduced a computational approach utilizing systems biology methods such as prioritization tools, enrichment web servers, network analyzer software, and computational biology methods to calculate the centrality of human PPI networks and measure gene similarity. As a result, 17 top genes were identified, including mTOR, PRF1, FGFR3, TLR9, CLTC, GJA1, HLA-DRB1, HSPA8, EGF, LRP1, MYO7A, ENPP1, PSAP, NBR1, AP3B1, DNAM2, and RPTOR, which play roles in the cellular response to starvation, autophagy, endocytosis pathways, and cancer development. Furthermore, the selected gene set PPI analysis revealed four main clusters highly associated with cancer development. Finally, six rarely evaluated genes, PRF1, TLR9, CLTC, GJA1, RPTOR, and AP3B1, were identified with the leading potential roles in breast cancer development and drug resistance.
The mammalian cells target rapamycin (mTOR) to regulate eukaryotic cell metabolism and growth with environmental inputs, such as growth factors and nutrients (34). mTOR directly or indirectly regulates the phosphorylation of at least 800 proteins. The mTOR pathway regulates the translation of proteins associated with drug resistance, controlling cell cycle progression and apoptosis and thereby contributing to cancer cell drug resistance (35). RPTOR regulatory associated protein of mTOR complex 1 operates as a scaffold for recruiting mTORC1 substrates and is an essential procedure for mTOR activating (36). The RPTOR upregulation has a role in the resistance of renal cancer cells to PI3K-mTOR inhibition (37). The previous experimental study showed that RPTOR mRNA expression correlates with higher breast cancer tumor grade (38). Another study suggested that RPTOR mediates, at least partially, resistance to EGFR inhibition in triple-negative breast cancer cells (39). mTOR-induced cancer drug resistance to autophagy defects opens a therapeutic window for treating otherwise therapy-refractory tumor patients (40). Lysosomes are essential components contributing to chemoresistance by the mTORC1 axis and are implicated in developing drug resistance (41). Interestingly, our results demonstrated that RPTOR is the hub gene involved in lysosome function in breast cancer biology.
Mutations in the PRF1 gene are associated with various human diseases and across 19 different cancer types. Perforin is encoded by PRF1 and forms membrane pores that allow the release of granzymes and subsequent cytolysis of target cells. Perforin plays an essential role in host immunity and could be an attractive therapeutic target in cancer (42, 43).
Under hypoxic conditions, several chemical substances are released, activating toll-like receptors (TLRs), thus inducing various pathophysiological responses, like tumorigenesis. TLR9 leads to the activation of NF-κB and mitogen-activated protein kinases (MAPKs), which then influence the release of NO and pro-inflammatory cytokines. The most potent activator of angiogenesis in tumors is hypoxia. Activated TLR9 upregulates the inhibitors of apoptosis, such as Bcl-xL, cFLIP, and surviving, reducing the chemosensitivity of cancer cells (44, 45). In a study, TLR9 mRNA and protein expression were higher in HR-negative than in HR-positive breast cancers. In addition, TLR9 expression increases with rising grades in both breast cancer and ovarian neoplasm. TLR9 is also directly associated with poor differentiation of breast and ovarian cancers. Overexpression of TLR9 through the stimulation of hypo-methylated DNA contributes to the migration of cancer cell lines (46). TLR9 may be a novel target for chemosensitizing cancer cells.
The clathrin heavy chain (CLTC) gene has high expression in all cells and plays a pivotal role in membrane trafficking and mitosis. As an oncogene with different expression levels in breast cancer, its elevation in urinary samples of patients could be a biomarker of breast cancer. It could distinguish breast cancer from the other types of cancer with a 94.3% accuracy (47). Also, the mammalian AP3 adapter complex has been shown to associate with clathrinid through the interaction of the appendage domain of the AP3B1 protein with the amino-terminal domain of CLTC (48). Our computational and systems biology analysis revealed CLTC and Ap3B1 as hub lysosomal genes highly involved in breast cancer.
Researchers indicated that connexins, consisting of Cannexin 43 (GJA1) and GJB2, were overexpressed in metastatic lesions of cancer patients and promoted cancer cell migration and adhesion. Connexin would be a cancer biomarker for prognosis and therapeutic targets for inhibiting metastasis and chemoresistance (49). The functional analyses demonstrated the GJA1 gene encoding Connexin 43 (Cx43) and the importance of Cx43 in drug resistance. An experimental study showed highly upregulated GJA1 in cisplatin-resistant ovarian cancer cells. (50). Finally, we focused on the relationship between lysosomal genes and drug resistance in breast cancer treatment and introduced the top six hub genes. Although previous studies have shown the role of some genes introduced in cancer drug resistance, our research emphasizes the critical role of all these genes in breast cancer chemoresistance. Since these genes play a pivotal role in the structure and function of lysosomes, targeting them can effectively overcome drug resistance. However, the current research results should be further validated through in vitro and in vivo studies to confirm the critical role of these genes in drug-resistant breast cancer.
5.1. Conclusions
In summary, growing evidence implicates the essential roles of lysosomes in drug resistance of human cancers. The present work focused on all functional and structural lysosome-related genes associated with breast cancer biology. Our approach found the top six essential lysosome hub genes, including PRF1, TLR9, CLTC, GJA1, AP3B1, and RPTOR, which could be significantly involved in drug resistance. Lysosome targeting in cancer is a promising strategy to overcome chemoresistance and could lead to innovative therapeutic approaches.
