


1. Background
Lymphoma is a type of cancer in which malignant B, T, and natural killer cells are developed in the lymphatic system. Non-Hodgkin lymphoma (NHL) is one of the most common types of cancer in both males and females (1). B-cell lymphomas account for more than 85% of NHLs in the US, with overexpression of CD20 molecules on the B-cell surface (2). Chemotherapy alone or combined with radiotherapy is traditionally used to treat NHL (3). However, due to the non-specific nature of these treatment strategies, targeted antibody-based immunotherapies have significantly improved the clinical responses (4-7). Several B-cell surface markers such as CD19, CD20, CD22, CD23, CD37, and CD52 have been used for lymphoma treatment, among which CD20 is the most significant target due to its role in B-cell development (6, 8, 9) and high expression level (> 80%) (10).
Human CD20, encoded by the MS4A gene family (11), is a non-glycosylated hydrophobic phosphor-protein with a molecular weight of 35 to 37 kDa (12). It has been characterized by four transmembrane domains, intracytoplasmic N and C termini, and a short 40 amino acid extracellular domain (ECD) which exists as a disulfide-bonded loop-like structure (13). CD20 does not detach from the expressing cells and therefore is a desirable biomarker for immunotherapies (12, 14). During the last decades, several anti-CD20 monoclonal antibodies (mAbs) have been developed to recognize different extracellular epitopes. Rituximab, as the first chimeric anti-hCD20, was approved by the FDA (15) as a single medicine for the management of relapsed or refractory low-grade B-cell NHLs (16) or in combination with chemotherapy (17). The second and third generations of anti-CD20 mAbs like ofatumumab, veltuzumab, ocrelizumab, AME-133v, PRO131921, and GA101 are humanized and engineered to reduce the immunogenicity (18).
The binding of the Fab moiety of these antibodies to the CD20 molecule is the primary action of their function, which can be assessed through cell-based or non-cell-based platforms. Although the former is usually preferred due to the physiological relevance, the latter can be acceptable when the development of a precise and sensitive cell-based assay is challenging due to the unavailability of an appropriate cell line, high cost of the applied FACS technique, lack of desirable sensitivity and precision or possible interfering reagents within the test medium. In the case of non-cell-based CD20 ELISA assays, commercial availability of the antigen and accessibility of its epitopes is an essential issue in assessing the biological activity of anti-CD20 mAbs.
Different approaches have been developed to produce CD20 derivatives in which several expression systems, including bacterial, yeast, insect, plant, and mammalian cells, are used (19, 20). According to the literature, alternative CD20 designations, including its reactive epitopes fused to the common tags, are more favorable than its full-length transmembrane CD20 molecule. Although the fusion tags theoretically can enhance protein expression and facilitate the purification procedure, their effect on the stability and solubility of the protein is controversial (19, 21-23). Thioredoxin (Trx), a 12.9 kDa non-glycosylated polypeptide, contains 119 amino acids. This protein is essential for maintaining the highly reduced environment of bacterial cytosol, which results in proper folding and activity of the protein (24). Histidine (His)-tag, a small peptide of six amino acids, is generally used to accelerate protein purification through Ni-based affinity chromatography approaches. Although Escherichia coli has been considered a desirable host cell for the production of recombinant proteins, the effects of other interactive variables such as culture conditions (incubation temperature and post-induction incubation time), the concentration of the inducer, and medium type have been repeatedly reported on the yield of protein expression.
Design of experiments (DOE) is a statistical methodology for identifying significant factors and possible interactions between them to predict the actual optimum conditions through a reduced number of experiments (25). The response surface methodology is an applicable statistical method to screen several potential variables affecting the expression of recombinant proteins, which will model and evaluate the effects through multivariable equations.
2. Objectives
This study evaluated the culture conditions using the RSM-Box Behnken design to improve the expression level of designed CD20 proteins in the E. coli (DE3) strain. The effect of frequently used tags in the expression of recombinant CD20 molecule (Trx and His tags) was also investigated on the immunoreactivity of rituximab through bioinformatics studies, followed by in vitro binding assays.
3. Methods
3.1. Design of CD20 Constructs
The reported discontinuous extracellular regions (ECL1 and ECL2) of the CD20 protein were selected from the human CD20 amino acid sequence (UniProt: P11836). For linking these regions, different approaches were taken. The first approach selected a linker with a theoretically random coil structure of ASPAAPAPA peptide sequence (PAS motif) in 20, 40, 60, and 80 amino acid lengths. The second approach used the common (G4S)3 linker to join CD20-selected extracellular regions. For ease of purification, the addition of His-tag (His8) at the N and C terminal end of the constructs was also investigated. After bioinformatics analysis, to examine the effect of tagging on the function of recombinant protein, thioredoxin (TrxA) amino acid sequence (109 aa) was extracted from UniProt (Accession No. P0AA25) and placed at the N-terminal region of the selected expression cassette.
3.2. Homology Modeling and Refinements
Homology modeling of the expression cassettes was performed with I-TASSER (Iterative Threading ASSEmbly Refinement). This web server predicts the protein structure using a hierarchical approach (26). The models were selected based on root mean square deviation (RMSD), TM, and C-scores. The RMSD is a standard measurement of the structural similarity of the proteins to the native structures where lower RMSD values show less deviation of the modeled protein compared to the native structures. The TM-score is a suggested scale to measure the similarity of the two structures ranging from 0 to 1, where 1 provides a complete matching of the two structures. The C-score is a confidence score for estimating the quality of predicted models within the range of [-5, 2], where higher values characterize a highly assured model.
The stereochemical properties of the predicted models were analyzed by Ramachandran plot on the PROCHECK server (27). The compatibility of 1 and 3D structures was measured by the Verify3D server (28). The ERRAT server was applied for calculating non-bond atomic interactions (29). The MolProbity webserver was used to compare the quality of the models with crystallography and NMR protein structures (30).
3.3. Physicochemical Analysis
The physicochemical properties of the designed proteins were calculated by the ProtParam tool on ExPASy (31), in which the half-life of the subject protein was estimated in three different expression systems (mammalian, yeast, and E. coli cells) based on the N-end rule according to the N-terminal residual identity (32). In brief, it relates the in vivo half-life of the target protein to the identity of its N-terminal amino acid residue when the N-terminal pattern of a ubiquitin fused reporter protein such as β-galactosidase is selected as the reference molecule for in vivo studies. The ProtParam instability index indicates in vivo stability of the proteins, and values greater than 40 specify the unstable proteins. The grand average of hydropathicity (GRAVY) index shows the hydrophobicity property of the protein in which positive and negative values represent hydrophobic and hydrophilic properties. The Protein-Sol web tool computed the protein solubility by comparing the target protein with the average soluble E. coli proteins available in experimental solubility datasets. Values greater than 0.45 show solubility higher than E. coli-deposited soluble proteins (33).
3.4. Molecular Docking
To understand the possible interaction of designed CD20 molecules and rituximab (PDB ID: 6VJA), the anti-CD20 mAb, molecular docking was performed by ClusPro server (34), which can effectively dock protein-protein complexes using knowledge-based algorithms. The LigPlot+ program was used to analyze the docking results (35). The tertiary structures of the complexes were visualized in the PyMOL system (pymol.org). The PRODIGY (PROtein binDIng enerGY) webserver was used to predict binding affinities (free energy of binding (ΔG) and dissociation constant (KD)) of the given complexes.
3.5. Molecular Dynamics Simulations
Molecular dynamics (MD) simulations were done by the GROMACS package (v. 2021) to study the stability and conformational changes of protein complexes under physicochemical conditions (36). All-atom optimized potentials for liquid simulations (OPLS-AA) force field was selected for simulation. The cubic simulation box was generated with a 1 nm distance from the protein edges and filled with a simple point charge (SPC) water model. The steep-descent algorithm evaluated the system energy minimization with a threshold of 10 kJ/mol/nm in 500,000 steps. For thermal equilibration of the system, constant number of particles, volume, and temperature (NVT) was conducted by Verlet algorithm for 100 ps. The temperature-stabilized system was stabilized for pressure using constant number of particles, pressure, and temperature (NPT) in the case of a constant number of particles, pressure, and temperature. The MD simulations were performed for 100 ns with 2 fs time intervals, followed by stability analysis of complexes by the RMSD. The compactness and stability of complexes were evaluated by the radius of gyration (Rg). The number of hydrogen bonds, the solvent-accessible surface area (SASA) of the binding sites, and the fluctuation of each amino acid during simulation were also investigated.
3.6. Protein Expression
The final selected expression cassettes were subcloned under the control of the T7 promoter within pET24a and pET28a. The recombinant vectors were transformed into E. coli BL21 (DE3) strain (Novagen, USA) and inoculated into 5 mL LB broth medium supplemented with appropriate selection antibiotics on a shaker incubator at 37°C till the optical density at 600 nm reached 0.4. Protein expression was induced using 0.5 mM IPTG as the inducer. The tubes were incubated at 37°C for a further 4 h. The bacterial pellet was collected and run on 12% SDS-PAGE. The identity of the expressed proteins was confirmed using western blotting by the anti-His antibody. In brief, bacterial proteins were transferred to nitrocellulose membrane (GE Healthcare, USA) using a semi-dry blotting system (Bio-RAD, USA). The membrane was blocked in 3% (w/v) skim milk in phosphate-buffered saline (PBS) overnight (o/n) at 4°C. Horseradish peroxidase (HRP) conjugated anti-His antibody (Sina Biotech, Iran) was added to the membrane at a 1: 750 dilution rate and incubated for 2 h at room temperature (RT). After washing the membrane with PBS supplemented with 0.1% Tween-20 (five times), 3,3’-diaminobenzidine (DAB) substrate was added to the membrane to observe the desired protein bands.
In another western blotting experiment, Zytux (rituximab, Aryogen Pharmed, Iran) (400 μg/mL) was used as the first antibody for 2 h (RT). After the washing step (five times), the membrane was treated with 1: 10000 dilution of HRP-conjugated rabbit anti-human IgG (Invitrogen, USA) for 1 h (RT), and DAB substrate was used for visualization of the CD20 protein bands.
3.7. Experimental Design and Optimization of Protein Expression
After preliminary optimization work on protein expression based on different post-induction times (4, 8, 12, and 24 h) and types of culture medium (LB and TB), the best conditions for the highest expression level of the two recombinant proteins were selected through densitometry analysis of the expressed recombinant protein within the whole bacterial lysate on SDS-PAGE using Image J analyzer (National Institute of Health, USA). Experimental designs were conducted based on response surface methodology (RSM) to further optimize protein expression levels. The effects of three independent factors, including post-induction temperature, optical density at induction time, and IPTG concentration, were analyzed on the expression level of the two CD20 derivative proteins using the Box-Behnken design (Design Expert v.10.0.7.0, USA). Fifteen experiments were designed for each protein, including three replicates at the central point (Appendix 1).
Multiple correlation coefficient (R2) and adjusted coefficient (Adj-R2) were indicators of quadratic polynomial equation fitness. Contour and three-dimensional surface plots were used for the visualization of possible interactions.
3.8. Purification of Recombinant CD20 Proteins
Large-scale protein expression (500 mL) was performed under optimized conditions. The bacterial pellet was resuspended in lysis buffer (50 mM NaH2PO4, 300 mM NaCl, 10 mM imidazole; pH 8.0) and sonicated by 18 pulses (30 s sonication with the same intervals at 25% amplitude). After centrifugation at 10,000 rpm for 10 min at 4°C, the pellet and supernatant samples were separately analyzed on 12% SDS-PAGE.
Inclusion bodies were washed twice with IB washing buffer (200 mM NaCl, 1 mM EDTA, 0.5 M urea, 1% triton X100; pH 7.0), followed by PBS alone. The suspension was centrifuged at 10,000 rpm for 30 min at 4°C, and the pellet was resuspended in binding buffer (50 mM NaH2PO4, 500 mM NaCl, 10 mM imidazole, 8 M urea; pH 8.0) and injected into the equilibrated Ni-NTA column (ABT, Spain) under 1 mL/min flow rate in the Bio-Rad FPLC system. The column was washed with washing buffer I (50 mM NaH2PO4, 300 mM NaCl, 40 mM imidazole, 8 M urea; pH 8.0) (20 CV), followed by 10 CV of washing buffer II (50 mM NaH2PO4, 300 mM NaCl, 60 mM imidazole, 8 M urea; pH 8.0). Histidine-tagged proteins were eluted from the column using the elution buffer (50 mM NaH2PO4, 300 mM NaCl, 250 mM imidazole, 8 M urea; pH 8.0). Eluted protein samples were dialyzed against 20 mM phosphate buffer (pH 7.2), and the concentration was measured using Nanodrop at 280 nm.
3.9. Affinity Measurement of Zytux/r-CD20 Molecules
Beatty et al.’s affinity measurement was performed to evaluate the effect of attached peptide tags on the affinity of Zytux towards recombinant truncated CD20 molecules (37). The purified recombinant proteins were diluted in carbonate bicarbonate buffer to a final concentration of 2.5 and 5 μg/mL and coated in 96-well ELISA plates (Jet Biofil) overnight at 4°C. After washing the plate with PBS (pH 7.2), the wells were blocked by PBS containing 1% bovine serum albumin (BSA) for 2 h (RT). Serially diluted Zytux (400 μg/mL to zero) was used as the first antibody for 1 h (RT). After washing with PBS supplemented with 0.05% Tween-20 (T-PBS), 1:10,000 dilution of HRP-conjugated rabbit anti-human IgG (Sigma, USA) was added to each well and incubated for 1 h (RT). After the washing step with T-PBS buffer, 3,3’,5,5’-tetramethylbenzidine (TMB) substrate was added to each well, and the reaction was stopped using 2N H2SO4. The optical densities were measured at 450 nm using an ELISA reader (BIOHIT, Finland), and the affinity constant (Kaff) was calculated using the equations:
And
where Ag and Ag’ were set as 5 and 2.5 μg/mL of CD20 proteins and Ab and Ab’ represented the EC50 concentrations of the first antibody, Zytux, for the above-mentioned antigen concentrations.
3.10. Cell-based ELISA Assay
CD20-positive Raji cells (Pasteur Institute of Iran) were cultured in RPMI medium supplemented with 10% FBS (48 h at 37°C). The cells were washed with PBS, and 10,000 cells/well were plated in 96-well-bottomed microtiter plates. The cells were sedimented by centrifugation at 1100 rpm for 5 min and fixed with 3.7% paraformaldehyde buffer for 20 min, followed by careful removal of the buffer (RT). The wells were blocked with 2% BSA in PBS buffer for 20 min (RT). The wells were treated with Zytux (anti-CD20) and AryoTrust (Anti-HER2; Aryogen Pharmed, Iran) mAbs at different concentrations (50 - 400 μg/mL) (2 h RT). The wells were washed with washing buffer (PBS, 0.1% Tween-20). The secondary antibody (HRP-conjugated rabbit anti-human IgG; 1: 10000 dilution) (Sigma, USA) was added to the wells for one hour at RT. After washing three times, TMB substrate was added. The reaction was stopped by 2N H2SO4, and the optical absorbance was read at 450 nm.
3.11. Statistical Analysis
Data were analyzed using Prism (GraphPad software). The effect of selected variables on protein expression level was assessed by ANOVA at P values < 0.05 as significant. ELISA tests were performed in triplicate, and the results were expressed as means ± standard error of the means. Significant differences were analyzed using Student’s t-test or One-way ANOVA.
4. Results
4.1. Design of Expression Cassettes
Different CD20 expression cassettes compromising the two mentioned linkers and His-tag (His8) at the N or C-terminal region of the cassette were designed (Figure 1). The tertiary structures predicted by I-TASSER revealed that CD20 constructs having the C-terminal His-tag had better folding (Figure 2), which were selected for further bioinformatics analysis. Increased length of the PAS linker resulted in inappropriate folding of the protein, particularly in the case of the PAS linker with 80 amino acids, which had the worst tertiary structure than the rest molecules. Interestingly, the structural alignment of the designed constructs revealed that CD20 ECL1 and ECL2 regions linked with the G4S linker had similar folding compared to the original CD20 protein, while other designed constructs did not match (Appendix 2).
-tag, respectively. I and J, Expression cassettes with (G<sub>4</sub>S)<sub>3</sub> linkers possessing N- or C-terminal His-tag, respectively.")
The designed expression cassettes using PAS or G4S linkers connecting CD20-ECL1 and CD20-ECL2 regions. A - H, Expression cassettes possessing 20, 40, and 60 PAS amino acid polypeptide linkers with N- or C-terminal histidine (His)-tag, respectively. I and J, Expression cassettes with (G4S)3 linkers possessing N- or C-terminal His-tag, respectively.
-tag, respectively. I and J, (G<sub>4</sub>S)<sub>3</sub> linkers with N- or C-terminal His-tag, respectively.")
I-TASSER predicted tertiary structures of all designed constructs. A – H, CD20 structures with 20, 40, and 60 PAS amino acid polypeptide linkers with N-or C-terminal histidine (His)-tag, respectively. I and J, (G4S)3 linkers with N- or C-terminal His-tag, respectively.
4.2. Model Validation
ProSA calculated the overall quality of the selected models based on the Z-scores. The obtained Z-score values revealed that all models had been located within the range of protein structures, and their structures were experimentally identified by X-ray and NMR (Appendix 3). Ramachandran plot by PROCHECK assessed the stereochemical quality of selected models. The results indicated that the G4S-linked CD20 expression cassette had the best stereochemical quality value, as more than 90% of the amino acid residues were located within the most favored region, and no amino acid residue was detected in the disallowed region (Appendix 3).
Verify3D evaluated the compatibility of a 3D protein model/profile based on the local environment of each amino acid residue according to the buried area of each residue, the fraction of the side-chain area covered by polar atoms, and the local secondary structures. Values above 80% show good agreement between 1D and 3D protein structures. Although CD20 cassettes having 40 or 60 PAS amino acid linkers showed good accordance with 1 and 3D structures, the G4S linker showed a value of around 36.6%, representing less structural compatibility which may be due to the very small size of this protein. This linker is more flexible than PAS polypeptides and has no characterized structure. The ERRAT value computes the nonbonded atomic interactions of protein structure, and its values greater than 50% indicate the reliability of the protein structure. The calculated values of all designed constructs were over 50% showing the high reliability of the models. The MolProbity score is a log-weighted combination of clash score, percentage of bad-chain rotamers, and Ramachandran valuations into a single number reflecting expected X-ray crystallographic resolution. All predicted models had MolProbity scores higher than 66%, indicating the appropriate quality of the models. The best MolProbity score belonged to the CD20/G4S protein (100%).
4.3. Molecular Modeling and Docking of Rituximab at CD20 Proteins
To investigate putative interactions between rituximab and CD20-designed constructs, we performed docking by the ClusPro webserver. The results revealed that CD20/G4S construct could interact more effectively with the amino acid residues within the CDR regions of rituximab (Figure 3 and Table 1). Affinity anticipation with the PRODIGY webserver demonstrated that CD20/G4S cassette had a dissociation constant of 5.80E-09M, one of the highest affinity values among designed constructs. Due to the higher amino acid interactions of the CD20/G4S cassette and its high affinity towards rituximab, this construct was nominated for further experimental analysis.

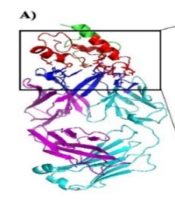
Molecular docking of designed CD20 constructs. A, CD20/20aa PAS; B, CD20/40aa PAS; C, CD20/60aa PAS; D, CD20/80aa PAS; E, CD20/G4S. Designed constructs are colored green, and their ECL1 and ECL2 regions are colored red. Heavy and light chains of rituximab are colored magenta and cyan, respectively. The stick amino acids are residues located in the interface of CD20 and rituximab. Bolded amino acids belong to the antibody, while amino acids in regular font belong to the ECL1 and ECL2 regions of CD20.
| Protein Structure | Residues Involved in CD20 | Residues Involved in Rituximab a | KD b (M) | ∆G c |
|---|---|---|---|---|
| CD20/20aa PAS | Asn140, His145, Lys148, Cys167, Glu168, Asn171, Glu174, Lys175, Tyr182 | Asn53, Tyr49, Trp100B, Gly99, Tyr98, Tyr97, Asn54, Tyr52, Tyr32, Ser31 | 3.0E-08 | -10.3 |
| CD20/40aa PAS | Met71, Ile76, Cys183, Tyr184, Ile186 | Asn94, Tyr32, Ser31, Trp100B, Gly101, Gly100, Tyr97, Thr96, Ser95, Arg94, Tyr52, His35, Asn33, Tyr32, Ser31, Val2 | 5.4E-09 | -11.3 |
| CD20/60aa PAS | Phe146, Leu148, Glu150, Ser151, Asn153, Phe154, Ala157 | Tyr32, Trp100B, Gly101, Gly100, Tyr98, Tyr97, Thr96, Asp56, Tyr52, Asn33, Arg94, Tyr32, Ser31 | 6.6E-08 | -9.8 |
| CD20/80aa PAS | Phe146, Leu147, Lys148, Phe154, Ile155, Arg156, Ala157, His158, Tyr165, Glu174, Lys175, Asn176, Tyr182 | Thr92, Asn53, Ala50, Tyr32, Trp100B, Gly101, Gly100, Tyr98, Tyr97, Tyr52, Asn33, Tyr32, Ser31 | 2.0E-07 | -9.1 |
| CD20/G4S | Ile76, Tyr77, Asn153, Arg156, Ala157, Pro160, Tyr161, Ile162, Asn166, Glu168, Ala170, Asn171, Glu174, Ser177, Pro178, Ser179 | Gln61, Tyr59, Ser58, Thr57, Asp56, Gly55, Asn54, Ala50, His35, Asn33, Lys19, Asn94, Thr92, Trp91, Ser31, Trp100B, Asp100A, Gly100, Ser95, Lys73, Thr70, Leu69, Thr68, Lys64 | 5.80E-09 | -11.2 |
a The naming and numbering of rituximab amino acids were obtained from PDB (PDB ID: 6VJA).
b Dissociation constant value (molarity)
c Free energy of binding (kcal.mol-1)
4.4. Thioredoxin Tagging of CD20/G4S
The tertiary structure of the Trx-tagged CD20 cassette (Trx-CD20/G4S) (Figure 4A) was predicted by the I-TASSER webserver (Figure 4B) in which the correct folding of the protein and high quality of the model (ProSA Z-score of 4.27) were comparable with experimentally identified X-ray and NMR protein structures (Appendix 4). Also, more than 90% of the amino acid residues of this model were located in the most favored regions indicating the acceptable stereochemical quality of the proposed model. A molecular docking study of the Trx-CD20/G4S cassette in comparison with the untagged CD20 protein (CD20/G4S) discovered a more effective interaction of rituximab with ECL1 and ECL2 regions (affinity of 7.10E-10 vs. 5.80E-09M) (Tables 2 and 1, respectively).
-CD20 structure. A, Schematic view; B, I-TASSER predicted tertiary structure of N-terminally fused Trx-CD20 fusion protein possessing C-terminal histidine (His)-tag. Thioredoxin, ECL1, G<sub>4</sub>S linker, ECL2, and His-tag are colored orange, blue, yellow, green, and red, respectively.")
Thioredoxin (Trx)-CD20 structure. A, Schematic view; B, I-TASSER predicted tertiary structure of N-terminally fused Trx-CD20 fusion protein possessing C-terminal histidine (His)-tag. Thioredoxin, ECL1, G4S linker, ECL2, and His-tag are colored orange, blue, yellow, green, and red, respectively.
| Protein Structure | Residues Involved in CD20 | Residues Involved in Rituximab a | KD b (M) | ∆G c |
|---|---|---|---|---|
| Trx-CD20 | Ala74, Tyr77, Ala78, Phe146, Ser151, Glu152, Leu154, Asn171, Ser173, Glu174, Asn176, Ser177, Thr180, Gln181, Tyr184 | Trp100B, Asp100A, Gly100, Tyr97, Lys64, Gln61, Asp56, Asn54, Tyr52, Asn33, Tyr32, Ser31, Asn94, Thr92, Trp91 | 7.10E-10 | -13 |
Abbreviation: Trx, thioredoxin.
a The naming and numbering of rituximab amino acids were obtained from PDB (PDB ID: 6VJA).
b Dissociation constant value (molarity)
c Free energy of binding (kcal.mol-1)
4.5. Physiochemical Properties of Thioredoxin-CD20 Molecule
Similar half-lives were observed for Trx-tagged and CD20/G4S molecules in mammalian, yeast, and E. coli expression systems (Appendix 5). The computed negative GRAVY values reflected the hydrophilic nature of tested proteins. The observed solubility scores (> 0.5) indicated the water solubility of these proteins. The instability index below 40 showed higher stability of Trx-CD20 than CD20/G4S, which was reconfirmed by its higher aliphatic index.
4.6. Molecular Dynamics simulation
The stability of the two final CD20 proteins was assessed over time by molecular dynamics simulation. According to the RMSD plot, both CD20 molecules reached a steady state during 100 ns of simulation and interacted effectively with rituximab (Figure 5A). The radius of gyration plot depicted similar compactness and folding state of CD20 proteins during simulation (Figure 5B). At the atomic level, the number of formed hydrogen bonds was calculated, and the corresponding hydrogen bond plot showed the stability of each protein during the simulation as well as its interaction with rituximab (Figure 5C).
 plot; B, Radius of gyration (Rg) plot; C, Hydrogen bond plot; D, Solvent-accessible surface area (SASA) plot; E, Root mean square fluctuations (RMSF) plot. CD20/G<sub>4</sub>S and thioredoxin (Trx)-CD20 proteins are in blue and orange, respectively.")
Molecular dynamic simulation of rituximab: CD20 complexes. A, Root mean square deviation (RMSD) plot; B, Radius of gyration (Rg) plot; C, Hydrogen bond plot; D, Solvent-accessible surface area (SASA) plot; E, Root mean square fluctuations (RMSF) plot. CD20/G4S and thioredoxin (Trx)-CD20 proteins are in blue and orange, respectively.
The solvent accessible surface area is described by the surface around the biomolecules characterized by a solvent through van der Waals interactions. Higher SASA values indicate exposure of the molecule to the solvent, while low scores represent buried residues. Although the calculated SASA value of rituximab: CD20 complexes showed that CD20/G4S had a higher SASA value than Trx-CD20 (approximately 97 vs. 83 nm2), both constructs could efficiently interact with CDRs of rituximab during simulation (Figure 5D). The root mean square fluctuations (RMSF) plot discovered that both designed structures had approximately the same average fluctuation of each residue located in the ECL1 and ECL2 regions of CD20 during simulations (Figure 5E).
4.7. Cloning and Expression of CD20 Proteins
The designed expression cassettes (Trx-CD20 and CD20/G4S) were synthesized (Biomatik, Canada), subcloned into pET24a and pET28a expression vectors, and confirmed through restriction digestion analysis using NdeI, NcoI, and HindIII, as well as nucleotide sequencing (data not shown). Recombinant 22 and 8.7 kDa Proteins were expressed as Trx-CD20 and CD20/G4S proteins in LB medium after induction by 0.5 mM IPTG and 4 h incubation at 37°C (Appendix 6A and Appendix 6B). The two expressed recombinant CD20 proteins were detected through immunoblotting using anti-His antibodies (Appendix 6C).
4.8. Optimization of Protein Expression by Box Behnken Design
In a preliminary study, the effect of culture medium and post-induction time on protein expression level was evaluated to reduce the number of experiments in RSM design. It was revealed that the LB medium could increase the expression of both Trx-CD20 and CD20/G4S recombinant proteins in 4 and 24 h, respectively. In the next step, to determine other critical, independent factors in maximizing protein expression level, the Box Behnken design was performed. The results of 15 experiments were analyzed through SDS-PAGE by densitometry of desired bands using Image J software (Table 3).
| Independent Variables | Responses | |||||
|---|---|---|---|---|---|---|
| Trx-CD20 Expression (%) | CD20/G4S expression (%) | |||||
| Temperature (°C) | Cell Density (OD 600 nm) | IPTG (mM) | Experimental | Predicted | Experimental | Predicted |
| 37 | 0.2 | 0.55 | 56.11 | 55.51 | 20.14 | 20.43 |
| 31 | 0.2 | 0.1 | 57.45 | 56.45 | 29.11 | 29.14 |
| 25 | 0.2 | 0.55 | 48.39 | 48.71 | 24.05 | 25.07 |
| 31 | 0.2 | 1 | 50.64 | 52.32 | 29 | 27.65 |
| 37 | 0.8 | 0.55 | 55.73 | 55.40 | 37.82 | 36.8 |
| 31 | 0.8 | 0.1 | 53.01 | 51.32 | 39.98 | 40.32 |
| 31 | 0.8 | 1 | 51.85 | 53.26 | 41 | 40.96 |
| 25 | 0.8 | 0.55 | 44.45 | 45.04 | 33.51 | 33.21 |
| 31 | 0.5 | 0.55 | 36.20 | 32.57 | 37.11 | 38.66 |
| 25 | 0.5 | 1 | 33.76 | 31.75 | 34.21 | 34.53 |
| 31 | 0.5 | 0.55 | 33.61 | 32.57 | 38.88 | 38.66 |
| 25 | 0.5 | 0.1 | 36.09 | 37.18 | 31.05 | 29.99 |
| 31 | 0.5 | 0.55 | 27.91 | 32.57 | 40 | 38.66 |
| 37 | 0.5 | 1 | 45.97 | 44.87 | 28 | 29.05 |
| 37 | 0.5 | 0.1 | 39.22 | 41.22 | 34.77 | 34.44 |
Abbreviation: Trx, thioredoxin.
The prediction of optimal CD20 protein expression was performed using the following quadratic polynomial equations:
Equation 1 (for Trx-CD20):
Y = 5.70 + 0.32A - 0.066B - 0.028C + 0.066AB + 0.18AC + 0.096BC + 0.18A2 + 1.26B2 + 0.33C2
Equation 2 (for CD20/G4S):
Y = 38.66 - 0.26A + 6.13B - 0.21C + 2.06AB - 2.48AC + 0.53BC - 6.15A2 - 3.63B2 - 0.51C2
Where Y is the predicted response (protein expression level), and A, B, and C are post-induction temperature, cell density at the induction time, and IPTG concentration, respectively.
The ANOVA test of the models for Trx-CD20 and CD20/G4S expression levels is presented in Table 4. F-values of the two models for optimization of Trx-CD20 and CD20/G4S proteins (10.46 and 23.01) could describe the significance of the models in which the reported lack-of-fit values were non-significant, implying the adequate predictive performance and fitness of selected models. The goodness of the models was rechecked by the R2 coefficient. The mean square values of 0.94 and 0.97 for Trx- and CD20/G4S expression levels indicated that the developed models could explain 94% and 97% of the total system variances. In addition, Adj-R2 of 0.85 and 0.93 for Trx-CD20 and CD20/G4S proteins suggested good compatibility between actual and predicted CD20/G4S expression levels, which was not observed for Trx-CD20. Therefore, these two models were selected for further analysis.
| Source | df | Trx-CD20 Expression (%) | CD20/G4S Expression (%) | ||||||
|---|---|---|---|---|---|---|---|---|---|
| Sum of Squares | Mean Square | F Value | P-Value | Sum of Squares | Mean Square | F Value | P-Value | ||
| Model | 9 | 7.15 | 0.79 | 10.46 | 0.0094 a | 520.70 | 57.86 | 23.01 | 0.0015 a |
| A, Temperature | 1 | 0.82 | 0.82 | 10.77 | 0.0219 a | 0.55 | 0.55 | 0.22 | 0.6608 |
| B, OD 600 nm | 1 | 0.035 | 0.035 | 0.46 | 0.5275 | 300.25 | 300.25 | 119.42 | 0.0001 a |
| C, IPTG | 1 | 6.223E-003 | 6.223E-003 | 0.082 | 0.7861 | 0.36 | 0.36 | 0.14 | 0.7202 |
| AB | 1 | 0.017 | 0.017 | 0.23 | 0.6524 | 16.89 | 16.89 | 6.72 | 0.0487 a |
| AC | 1 | 0.13 | 0.13 | 1.68 | 0.2513 | 24.65 | 24.65 | 9.80 | 0.0259 a |
| BC | 1 | 0.037 | 0.037 | 0.48 | 0.5177 | 1.13 | 1.13 | 0.45 | 0.5316 |
| A2 | 1 | 0.12 | 0.12 | 1.63 | 0.2573 | 139.61 | 139.61 | 55.53 | 0.0007 a |
| B2 | 1 | 5.89 | 5.89 | 77.51 | 0.0003 a | 48.76 | 48.76 | 19.40 | 0.0070 a |
| C2 | 1 | 0.41 | 0.41 | 5.39 | 0.0680 | 0.95 | 0.95 | 0.38 | 0.5661 |
| Residual error | 5 | 0.38 | 0.076 | 12.57 | 2.51 | ||||
| Lack-of-fit | 3 | 0.096 | 0.032 | 0.23 | 0.8729 | 8.32 | 2.77 | 1.31 | 0.4611 |
| Pure error | 2 | 0.28 | 0.14 | 4.25 | 2.12 | ||||
| Cor. total | 14 | 7.53 | 533.27 | ||||||
Abbreviation: Trx, thioredoxin.
a Effect of the variable and its interactions are statistically significant at P < 0.05.
Statistical analysis presented in Table 4 implied that post-induction temperature and optical density at the induction time were influential variables in the expression of Trx-CD20 and CD20/G4S proteins, in sequence. Regression analysis revealed that the quadratic term of B2 was significant in the Trx-CD20 designed model, while product terms of AB, AC, and quadratic terms of A2 and B2 were significant for CD20/G4S (Table 4). Square root transformation was also used to minimize the difference between predicted and adjusted R2 in the design of the expression experiments. Adeq-precisions of 7.979 and 15.85 indicated adequate signals (Appendix 7).
The effect of the post-induction temperature, IPTG concentration, cell density, and their interactions on protein expression level is graphically represented by 3-dimensional response surface plots in Appendix 8. Considering all the responses, the direct effect of temperature on the expression of Trx-CD20 protein was approved.
Combinations of post-induction temperature (25 - 37°C), cell density at the time of induction (OD600nm: 0.2 - 0.8), and IPTG concentration (0.1 - 1 mM) resulted in expression levels ranging from 27.9% to 57.45% for Trx-CD20 and 20.1% to 41% for CD20/G4S (Table 3). The optimized Trx-CD20 expression resulted in cell density of 0.8 and 0.1 mM IPTG at 31°C (57.45% protein expression at the center point), while the highest level of CD20/G4S expression was obtained at OD600nm of 0.8 and 1mM IPTG at 31°C (41%) (Appendix 9).
4.9. Protein Purification
Due to the inclusion body formation of both expressed recombinant proteins, the denaturing approach of affinity chromatography on Ni-based resin was performed. The eluted samples were buffer exchanged and analyzed on 12% SDS-PAGE (Appendix 10).
4.10. Binding Affinity Measurements
The specific antigen-binding activity of the anti-CD20 monoclonal antibody, Zytux, was compared with a non-related mAb, trastuzumab (anti-HER2 antibody) using homemade ELISA assays. Zytux represented higher binding activity when the Trx-CD20 protein was set as the target molecule compared to the assay performed by the CD20/G4S molecule (Figure 6A and C), while AryoTrust showed no false-positive results in these assays (Figure 6B and D). The calculated affinities of Zytux against Trx-CD20 and CD20/G4S molecules were 2.66 × 10¹² and 2.37 × 10¹² M-1, respectively (Figure 6E).
-CD20 protein; C, Zytux; D, AryoTrust against CD20/G<sub>4</sub>S protein; E, Rituximab affinity measurements against the two designed recombinant CD20 molecules using Beatty’s method; F, CD20-positive Raji cell-based ELISA assay. Data are given as mean ± SEM values of triplicate wells.")
Indirect sandwich ELISA assessment. A, Zytux; B, AryoTrust against thioredoxin (Trx)-CD20 protein; C, Zytux; D, AryoTrust against CD20/G4S protein; E, Rituximab affinity measurements against the two designed recombinant CD20 molecules using Beatty’s method; F, CD20-positive Raji cell-based ELISA assay. Data are given as mean ± SEM values of triplicate wells.
In another experiment, the two mentioned mAbs were tested in a cell-based ELISA assay to investigate the unspecific binding of the antibodies to the CD20-expressing Raji cells. The results showed that both antibodies had the same interaction pattern with the coated Raji cells (Figure 6F).
5. Discussion
Industrial manufacturing of recombinant proteins by E. coli host cells has attracted too much attention during the last decades, mainly when the proteins do not require complex post-translational modifications (38). The CD20 protein is a vital target antigen for treating particular autoimmune diseases, lymphomas, and leukemias. Recombinant full-length human CD20 protein is commercially available from various expression systems, including mammalian, insect, and E. coli cells, but its complexity and unstable biological activity are the main issues that should be considered. The bacterial r-CD20 protein has been repeatedly reported as an aggregated inclusion body which may be due to its large molecular size and hydrophobic regions, resulting in a misfolded protein within this expression host cell (19, 39). Therefore, engineering the molecule to overcome these problems is required.
Fusion tag proteins/peptides have been considered helper agents in protein expression, solubility, folding, and downstream processing, including purification and detection (40, 41). N- or C-terminal location of the fusion tags may also affect the solubility and biological activity of the expressed protein and should be considered in protein engineering approaches. Histidine and Trx tags are commonly used in the case of recombinant proteins. The former does not affect protein solubility but facilitates protein purification using metal affinity chromatography procedures. Thioredoxin is a small protein accelerating dithiol-disulfide exchange reactions, an activity that is significant for various cellular processes. It is also the fusion tag of choice when the expressed protein contains disulfide bonds (42). Selecting the desired combination of elements and conditions is a time-consuming and error-prone procedure for successful protein expression. Therefore, the initial screening of the designed expression cassettes using bioinformatics tools makes it possible to theoretically test several criteria before expression trials and scale-up procedures. Accordingly, the effect of these two tags on the folding of CD20 truncated extracellular domain was first investigated in the in silico conditions, and the most appropriate constructs were further examined in the in vitro experiments.
Due to the importance of tertiary structures in the biological activity of the proteins, in silico analysis of recombinant CD20 structures was performed, and their interaction with rituximab, an anti-CD20 mAb, was evaluated. The homology modeling results indicated that all CD20 cassettes possessing C-terminal His-tag have proper protein folding, among which (G4S)3 linker demonstrated similar folding to the native extracellular domain of CD20 protein which highly interacted with rituximab. Physicochemical analysis of selected CD20 structures with a G4S linker showed that they might have similar half-lives and good solubility in the E. coli expression system, while the Trx-CD20 cassette showed a more stable structure and higher thermostability than other expression cassettes. This finding was compatible with the previous study conducted by Habibi Anbouhi et al., in which the fusion of the thioredoxin tag to the extracellular loop of CD20 reduced misfolding and aggregation of this protein within E. coli (19). Ernst et al. have reported that rituximab binding was localized within the residues 142 and 184 of the extracellular loop of the CD20 protein in which the two cysteines (Cys167 and Cys183) are assumed to be responsible for disulfide bond formation and stability of the molecule (39).
On the other hand, phage displaying homologous CD20 amino acid sequences revealed the responsibility of 170ANPS173 and 182YCYSI186 motifs for the interaction with rituximab (43). These findings were revised after crystallography analysis of CD20 protein in complex with rituximab (PDB ID: 6VJA) in which the amino acid residues 164 to 174 were reported as interactive amino acids, and the two mentioned cysteines played a pivotal role in the appropriate folding of CD20 molecule (44). In the present study, the structural alignment of the proposed constructs showed that the G4S peptide linker could properly fold the epitopes similar to the native CD20 structure. In addition, molecular docking analysis revealed that the use of a G4S linker could increase the interaction of the 164IYNCEPANPSE174 region with rituximab through the amino acids Tyr161, Asn166, Glu168, Ala170, Asn171, and Glu174 compared to the PAS linkers which resulted in no or very low interaction with rituximab except for PAS#20aa. On the other hand, adding the Trx-tag to the CD20/G4S construct kept the interaction between the amino acids Asn173, Ser175, Glu176, and rituximab.
Optimization experiments aim to obtain the maximum protein expression level with the highest possible cell density. Parameters that can be optimized include the type of culture medium, concentration of the inducer, optical cell density at the time of induction, and culture duration after induction. Although higher cell densities often produce more proteins, it became quickly apparent that more cells do not necessarily yield high-quality proteins, and the produced proteins may be insoluble or aggregated. As preliminary experiments, we examined the effect of culture medium (TB and LB) and post-induction time (4, 8, 12, and 24 h) on the expression level of the two CD20 recombinant proteins. Although many studies have documented the advantages of TB medium in the expression of several heterologous proteins, this study surprisingly showed that the LB medium could maximize the expression of both truncated CD20/G4S and Trx-CD20 proteins after 4 and 24 h, respectively.
In the next step, an experimental design methodology was employed to optimize the expression of the designed r-CD20 protein with and without the Trx-tag. Due to the adverse effects of IPTG on host metabolism, growth, and viability (45-47), IPTG concentration was one of the investigated parameters. Post-induction temperature and optical density at the time of induction were also selected as other independent variables which should be considered. Within the developed models, F-values, the observed corresponding P-values, and their insignificant lack-of-fit values suggested the significance of the applied models in which post-induction temperature and optical density at the time of induction had significant positive effects on the expression level of these proteins. The approved optimum conditions were applied for large-scale production of the two recombinant CD20 derivatives, resulting in a total yield of 42 and 54 mg/L for Trx-CD20 and CD20/G4S proteins, respectively. In the next step, the affinity of rituximab biosimilar (Zytux), anti-CD20 mAb, towards r-CD20 proteins was tested in indirect ELISA assays.
Analysis of dissociation constants of all designed structures revealed that Trx-CD20 has the highest affinity to rituximab, suggesting no adverse effect of the Trx-tag on CD20-rituximab interactions. Interestingly, PRODIGY calculated dissociation constants of designed structures and represented that the affinities of CD20/G4S (5.8E-09M) and Trx-CD20 (7.1E-10M) molecules toward rituximab were significantly greater than full-length human CD20 (PDB ID: 6VJA) (2.0E-7 and 2.14E-8M calculated by PRODIGY webserver and surface plasmon resonance) (44). This data is in line with the study by Oscherwitz et al., in which peptide fragments of the extracellular region of human CD20 could be considerably more effective than its full-length protein in interaction with rituximab (48). Furthermore, the binding assay, according to Beatty at al.’s ELISA protocol, showed that the affinity of Zytux towards Trx-CD20 recombinant protein was slightly higher than CD20/G4S protein when minimum and maximum antigen concentrations were tested. This observation confirmed the bioinformatics findings’ accuracy in the present study’s early stages (37).
According to the pharmaceutical guidelines, the capacity assessment of antibodies should be done using efficient competitive ligand binding (CLB) assays, which may be cell or antigen-based approaches. Considering the action mode of the target molecule, the applied binding assay varies. The antigen-based assay can assess direct binding to the target molecule, which does not apply to the other functional properties. The lack of appropriate specific cell lines, which can develop strong signals without significant false-positive results, the high cost, and the time-consuming nature of cell-based functional tests make their application limited when suitable comparable CLB tests can be provided. In the present study, the two recombinant CD20 proteins (Trx-fusion and truncated form) were used as the coating antigens in homemade ELISA assays compared with cell-based ELISA using CD20-positive Raji cell line to study the affinity of anti-CD20 rituximab. The affinity of Zytux towards the Trx-CD20 protein was significantly stronger, resulting in higher optical densities when compared to the truncated CD20/G4S protein.
Interestingly the negative control anti-HER2 monoclonal antibody (trastuzumab) represented a feeble response which could be negligible. Eventually, Beatty et al.’s calculated affinity of Zytux towards the two tested recombinant CD20 proteins agreed with the KD values obtained by molecular docking, which confirmed the accordance of bioinformatics and in vitro experiments (37). According to the published data regarding the use of Raji cells in assessing rituximab affinity towards CD20 protein (49), these cells were used in a cell-based ELISA assay. The obtained optical densities were significantly lower than the values of antigen-based ELISA assays. Interestingly, the two tested mAbs, Zytux and AryoTrust, represented very close optical densities, especially in lower concentrations. One explanation may be due to the presence of small quantities of HER2 protein on the surface of Raji cells, which may cause false-positive results.
5.1. Conclusions
To obtain a full picture of CD20/anti-CD20 antibody interactions, preparation and availability of well-structured CD20 proteins are inevitable. Bioinformatics modeling studies performed in the present research and the obtained data helped us design an appropriate cassette for the expression of an interactive extracellular domain of CD20 protein to assess its affinity towards anti-CD20 rituximab monoclonal antibody via an antigen-based ELISA, and the results were compared with the routinely established cell-based ELISA assay. The results confirmed the higher accuracy of the former approach and indicated the importance of the CD20 extracellular domain in the assessment of anti-CD20 molecules. Unchanged conformation of the truncated, engineered extracellular domain of CD20 protein after fusion to the E. coli thioredoxin revealed that this fusion tag does not interfere with interactive epitopes of CD20 and anti-CD20 monoclonal antibody.
