


1. Background
Subacromial impingement (SI) is a spectrum of subacromial space pathologies including partial-thickness supraspinatus tendon tear, tendinosis and calcific tendinitis (1). SI is a very common disorder of the shoulder, accounting for 44% - 45% of all shoulder pain (2, 3). The subacromial space is defined by the humeral head inferiorly, the anterior border and undersurface of the anterior acromion, the coracoacromial ligament and the acromoclavicular joint superiorly. The distance between the acromion and the humeral head ranges from 1 to 1.5 cm in healthy subjects, as seen on plain radiography (2). Other studies have reported that the distance ranges from 0.6 to 1.4 cm in the neutral position (4). The supraspinatus tendon, long head of the biceps tendon, subdeltoid and subacromial bursa are interposed between the acromion and the humeral head (2). The coracoacromial ligament, a very hard structure, impinges the cuff, and is the upper main structure of the subacromial space. Any abnormality that disturbs these anatomic relationships may lead to impingement (5).
Orthopedic surgeons use acromiohumeral distance (AHD) as well as the morphology of the acromion for evaluation of the rotator cuff and surgical decision-making (6). Norwood et al. reported that an AHD less than 7 mm on anteroposterior radiographs suggest a large rotator cuff tear (7). Others reported that narrowing of the AHD is associated with degeneration of the rotator cuff (2). These previous studies were mainly based on plain radiography. The acromion and humeral head are curved and round, which makes accurate evaluation on plain radiography a challenge.
2. Objectives
We sought to use MRI to determine the mean value of AHD in impingement and to identify which part of the subacromial space affects impingement most. Therefore, the purpose of our study was to use MRI to establish a cutoff value for AHD in SI and to determine which site most strongly correlates with impingement.
3. Patients and Methods
3.1. Case Selection
Two radiologists and a clinician retrospectively evaluated 80 consecutive patients who underwent shoulder MRI. The reason for MRI examination was shoulder pain and impaired mobility. The patient population was composed of 56 (70%) men and 24 (30%) women (49 ± 12 years, range: 18 - 75 years) who underwent MRI at our institution between May 2012 and May 2013. Thirty-seven cases involved the left shoulder, and 43 cases involved the right. The patient who had severe degenerative joint disease of the acromioclavicular joint was excluded. A diagnosis of impingement was made upon positive physical exam findings of Neer’s sign and Hawkin’s sign, as indicated by pain when physicians elevate or twist the patient’s arm (1). One experienced orthopedic surgeon who had fellowship training in shoulder joint surgery and 20 years of experience performed all clinical evaluations and physical examinations. Positive symptoms of SI were pain worsened by overhead shoulder movement, weakness and loss of motion in the affected shoulder. Pain could also be aggravated when the patient lies on the side of the involved shoulder joint. Loss of motion resulted from painful motion during forward elevation of the arm from 60 to 120 degrees (8). Diagnostic criteria were positive MRI findings (partial rotator cuff tear, sub-deltoid bursitis or calcific tendinitis) with at least one of the combined positive clinical manifestations and positive physical examination findings (9, 10). MRI diagnosis of SI was categorized as partial tear of the supraspinatus tendon, tendinosis, calcific tendinitis or subdeltoid bursitis. Full-thickness rotator cuff tears were excluded because the correlation between full-thickness supraspinatus tears and AHD is well-established, and the narrowing of the distance is the result of humeral dislocation (11). Visualization of a partial defect in the supraspinatus tendon extending along either the articular or bursal surface was an MRI finding of a partial tear of the supraspinatus tendon (12). If the partially torn tendon was swollen with signal void on every pulse sequence and calcific lesions on plain radiography, calcific tendinitis was diagnosed. The main MRI finding of subdeltoid bursitis was fluid collection between the deltoid muscle and supraspinatus tendon greater than 3 mm in thickness (13). If no signal change or disruption of the tendon fiber was visible in the tendon and no fluid collection was observed around the tendon, then the MRI diagnosis was no tendon tear or tendinitis. Exclusion criteria included the presence of fractures (1 case), bone tumors (1 case), or full-thickness tears of the supraspinatus tendon (10 cases). This study was approved by our Institutional ethics review board, and the need for informed consent was waived due to the retrospective nature of the study.
3.2. MRI Parameters
MRI examinations were performed using the same protocol in a 1.5 T MRI scanner (Intera, Philips, Best, Netherlands) using an 8-channel shoulder coil. The sequences and imaging parameters of the standard protocol for the shoulder joint are summarized in Table 1. The position of the patients was supine with the arms in a neutral position (no rotation, no abduction, and no flexion). The coronal images were acquired with cuts made parallel to the supraspinatus tendon, which can be seen on the axial images. The sagittal images were obtained with cuts parallel to the articular surface of the glenoid, as seen on the axial images from the lateral margin of the humerus through the scapular neck.
| Parameter | Coro T2 FSE | Coro T2 FS FSE | Coro PD FSE | Sag T1 FSE | Sag T2 FSE | Axial FS PD FSE | Axial T2 FSE |
|---|---|---|---|---|---|---|---|
| TR, msec | 3200 - 3500 | 3200 - 3500 | 4000 | 520 | 2800 - 3000 | 3000 | 3500 |
| TE, msec | 60 - 90 | 60 - 80 | 30 | 10 | 60 - 90 | 30 | 60 |
| Flip angle, ° | 90 | 90 | 90 | 90 | 90 | 90 | 90 |
| Matrix size | 356 × 262 | 356 × 262 | 340 × 240 | 340 × 250 | 356 × 250 | 340 × 250 | 356 × 260 |
| Field of view, cm | 16 | 16 | 16 | 16 | 16 | 16 | 16 |
| Slice thickness, mm | 3 | 3 | 3 | 4 | 4 | 4 | 4 |
| Interslice gap, mm | 1 | 1 | 1 | 1 | 1 | 1 | 1 |
| Band width, kHz | 290 | 290 | 290 | 370 | 360 | 290 | 290 |
| Echo train length | 15 | 15 | 23 | 5 | 16 | 14 | 15 |
| Signal average | 2 | 2 | 2 | 2 | 2 | 2 | 2 |
| Scan time, min:sec | 2:48 | 2:50 | 2:57 | 2:04 | 2:07 | 2:30 | 2:30 |
Abbreviations: Coro, Coronal; FS, Fat saturation; FSE, Fast spine-echo; Sag, Sagittal; PD, Proton density; TE, Echo time; TR, Repetition time.
3.3. Image Analysis
MRI data were collected electronically with a picture archiving and communication systems (Infinitt 3.0, Seoul, Korea) workstation by two fellowship-trained musculoskeletal radiologists with 12 and 9 years of experience. The radiologists worked independently and were blinded to clinical information and previous radiologic reports. We measured the shortest distance from the outer margin of the inferior cortex of the acromion to the upper cortex of the humeral head at a total of six points. Neer et al. (14) reported that SI results from impingement of the anterior one-third of the acromion. Therefore, we measured the most anterior portion of the acromion and 4 mm behind it on the oblique sagittal T2-weighted turbo spin-echo (TSE) image assigned to the most lateral portion of the acromion. Then, we measured the points of two 4-mm slices medial from the most lateral portion of the acromion based on the oblique coronal T2-weighted TSE image (Figure 1). We measured a total of six points (Table 2).
| Diagnosis | Lateral Anterior | Lateral Posterior | Central Anterior | Central Posterior | Medial Anterior | Medial Posterior |
|---|---|---|---|---|---|---|
| No impingement | 7.76 (± 1.70)/ 7.75 (± 1.70) | 7.72 (± 1.53)/ 7.68 (± 1.55) | 8.20 (± 1.69)/ 8.17 (± 1.72) | 7.89 (± 1.70)/ 7.90 (± 1.72) | 9.50 (± 2.03)/ 9.48 (± 2.03) | 8.90 (± 1.85)/ 8.89 (± 1.88) |
| Impingement | 6.74 (± 0.97)/ 6.74 (± 0.96) | 6.88 (± 1.10)/ 6.87 (± 1.10) | 7.20 (± 1.23)/ 7.19 (± 1.23) | 7.02 (± 1.14)/ 7.00 (± 1.14) | 8.75 (± 1.57)/ 8.76 (± 1.56) | 8.70 (± 1.48)/ 8.71 (± 1.47) |
| P value | 0.004/0.006 | 0.009/0.013 | 0.004/0.006 | 0.019/0.022 | 0.102/0.118 | 0.753/0.786 |
aReader 1/ reader 2.
bData in parentheses represent standard deviation.
cValues are expressed as mean ± SD.
/TE), 3200/80) of the shoulder joint at the level of the posterior third of the humeral head shows the most lateral portion of the acromion. Three vertical planes (oblique sagittal view) were used for measurement from the lateral edge of the acromion at 4 mm intervals. B, The oblique sagittal T2-weighted image (TR/TE, 2900/80) of the shoulder joint. The shortest distance between the inner surface of the acromion and the outer surface of the humeral head is measured from the anterior edge of the acromion and 4 mm behind (arrows).")
A, The oblique coronal T2-weighted image (repetition time/echo time (TR)/TE), 3200/80) of the shoulder joint at the level of the posterior third of the humeral head shows the most lateral portion of the acromion. Three vertical planes (oblique sagittal view) were used for measurement from the lateral edge of the acromion at 4 mm intervals. B, The oblique sagittal T2-weighted image (TR/TE, 2900/80) of the shoulder joint. The shortest distance between the inner surface of the acromion and the outer surface of the humeral head is measured from the anterior edge of the acromion and 4 mm behind (arrows).
3.4. Statistical Analysis
Inter-observer agreement between readers was analyzed using intra-class correlation coefficients (ICCs). The mean AHD of each location in patients with and without SI were compared using Mann-Whitney tests. A p value less than 0.05 was considered statistically significant. ICC values less than 0.4 indicated poor reproducibility, ICC values of 0.4 - 0.75 indicated fair or good reproducibility, and ICC values greater than 0.75 indicated excellent reproducibility (15). To define the optimal cutoff values at each location for the diagnosis of SI, we applied a receiver operating characteristic (ROC) curve and maximum Youden index and calculated the area under the curve (AUC). Using that cutoff value, the sensitivity, specificity and 95% confidence interval (CI) were calculated. All analyses were performed with PSAW software version 10.1 (SPSS Inc., Chicago, IL, USA).
4. Results
There were 35 cases without SI. The causes of shoulder symptoms in these patients were adhesive capsulitis (13 cases), acromioclavicular arthritis (11 cases), superior labrum anterior posterior (SLAP) lesion (six cases) and labral Bankart lesion (five cases). Thirty-nine patients had partial-thickness tears, four had sub-deltoid bursitis, and two had calcific tendinitis (Figure 2). The mean age of the SI group was 43 ± 9.9 years and that of the no impingement group was 55 ± 10.0 years. The mean AHDs of patients with and without SI, stratified by location, are presented in Table 2 and Figure 3. The mean AHD of SI patients was about 6.8 mm in the lateral portion of the acromion and 7.1 mm in the central portion. The mean length of AHD in SI patients was shorter than that in patients without SI. The length differences of the lateral and central portions were statistically significant (0.004 < P value < 0.022). The length differences of the medial portion were not statistically significant. The ICC of each measurement between two readers was from 0.995 to 0.999, indicating excellent inter-observer agreement (Table 3).
Table 4 presents the optimal cutoff values acquired using the ROC curves. A cutoff value of 7.9 mm at the lateral anterior portion showed 96% sensitivity and 43% specificity. Cutoff values of 7.8 mm (reader 1, senior radiologist) and 7.5 mm (reader 2, junior radiologist) at the lateral posterior portion showed 89% and 78% sensitivity and 46% and 57% specificity, respectively. The cutoff AUC values of the medial portion were not significantly different (0.108 < P value < 0.791).
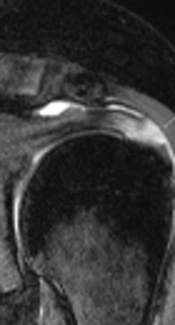
 at the lateral edge of the acromion demonstrates a 7.3 mm acromiohumeral distance at the anterior portion. B, The oblique fat-suppressed coronal T2-weighted image (TR/TE, 3200/60) shows a partial tear of the supraspinatus tendon (arrow).")
A 36-year-old woman with subacromial impingement syndrome. A, Oblique sagittal T2-weighted image (TR/TE, 2900/80) at the lateral edge of the acromion demonstrates a 7.3 mm acromiohumeral distance at the anterior portion. B, The oblique fat-suppressed coronal T2-weighted image (TR/TE, 3200/60) shows a partial tear of the supraspinatus tendon (arrow).
| Location | Lateral Anterior | Lateral Posterior | Central Anterior | Central Posterior | Medial Anterior | Medial Posterior | P value |
|---|---|---|---|---|---|---|---|
| Value | 0.999 | 0.999 | 0.999 | 0.995 | 0.997 | 0.999 | < 0.001 |
.")
The graph shows the mean acromiohumeral distance according to location. N = no impingement, P = subacromial impingement, R1 = reader 1, R2 = reader 2 (Abbreviations: CA, central anterior; CP, central posterior; LA, lateral anterior; LP, lateral posterior ; MA,medical anterior; MP, medical posterior).
| Location | Optimal Cutoff (mm) | Area under the ROC curve and P value | Sensitivity % | 95% CI of Sensitivity, % | Specificity, % | 95% CI of Specificity, % |
|---|---|---|---|---|---|---|
| Lateral anterior | 7.91/7.89 | 0.69 (0.002)/0.68(0.004) | 95.56/95.56 | 84.9 - 99.5/84.9 - 99.5 | 42.86/42.86 | 26.3 - 60.6/26.3 - 60.6 |
| Lateral posterior | 7.84/7.49 | 0.67 (0.007)/0.66 (0.011) | 88.89/77.78 | 75.9 - 96.3/62.9 - 88.8 | 45.71/57.14 | 28.8 - 63.4/39.4 - 73.7 |
| Central anterior | 8.79/8.14 | 0.69 (0.003)/0.68 (0.005) | 95.56/82.22 | 84.9 - 99.5/67.9 - 92.0 | 42.86/54.29 | 26.3 - 60.6/36.6 - 71.2 |
| Central posterior | 7.97/7.89 | 0.65 (0.015)/0.65 (0.017) | 80.00/80.00 | 65.4 - 90.4/65.4 - 90.4 | 48.57/45.71 | 31.4 - 66.0/28.8 - 63.4 |
| Medial anterior | 9.69/9.65 | 0.61 (0.108)/0.60 (0.125) | 80.00/80.00 | 65.4 - 90.4/65.4 - 90.4 | 45.71/45.71 | 28.8 - 63.4/28.8 - 63.4 |
| Medial posterior | 7.19/7.21 | 0.52 (0.758)/0.52 (0.791) | 8.89/8.89 | 2.5 - 21.2/2.5 - 21.2 | 77.14/77.14 | 59.9 - 89.6/59.9 - 89.6 |
Abbreviations: CI, Confidence interval; ROC, Receiver operating characteristic.
aReader 1/ reader 2
5. Discussion
Saupe et al. reported that reduced AHD is associated with supraspinatus tendon tears, with 90% of patients with an AHD less than 7 mm having a full-thickness tear of the supraspinatus tendon (11). The exact location of the measurement on oblique coronal MRI was not described in their study. The optimal cutoff values of our study were 7.5 mm and 7.8 mm at the lateral posterior portion, 7.9 mm at the lateral anterior portion (Figure 2) and 8.8 and 8.1 mm at the central anterior portion of the acromion (Table 4). Although Saupe et al. (11) included full-thickness tears of the supraspinatus in their study, we excluded full-thickness tears because narrowing of the AHD in these cases is already well-established in many reports (11, 16). Superior migration of the humeral head is a well-known phenomenon in full-thickness tears of the supraspinatus, and this process is quantified by AHD narrowing. This narrowing results from lack of stabilization by the rotator cuff and the absence of torn tendon structures as space holders (12). Although SI results from abutment between the humeral head and acromion during abduction of the shoulder joint, decreased AHD in the neutral position is also associated with SI. Saupe et al. (11) verified the importance of AHD in the neutral position in the evaluation of SI. Our study found that statistically significant differences in AHD exist between patients with and without SI and that the lateral portion of the subacromial space plays a more important role in the development of SI than the medial portion. Anatomical factors that cause narrowing of the AHD include variations in the shape of the acromion, orientation of the slope of the acromion and prominent osseous changes to the inferior aspect of the acromion (17). Some researchers do not agree that the slope of the acromion plays an important role in impingement (18). The acromion is a large, triangular or oblong process, which is flattened in an anterior-posterior direction and projects laterally before curving forward and upward. Neer et al. (19) reported that the anterior third is responsible for characteristic impingement. Proliferative spurs and ridges exist on the anterior lip and undersurface of the anterior process of the acromion, and these morphologic characteristics act as therapeutic clues of anterior acromioplasty. In our study, only AHD in the lateral portion of the acromion and 4 mm medial to that portion were significantly different between groups. These results are mostly in agreement with earlier studies; however, there were no significant differences in AHD between the anterior and posterior portions.
Our study had some limitations. One limitation was the single neutral posture of the shoulder MRI that was evaluated, as a significant change in minimal AHD during abduction has been observed (20). In our study, all MRI procedures were performed in a neutral, supine position, and no abduction was applied. Variation between patients was minimized by using the same position in every patient. Second, this study lacked surgical confirmation of lesions because partial tears of the supraspinatus tendon and calcific tendinitis do not always require surgical intervention. Hence, the diagnostic standard of the reference was imperfect.
In conclusion, SI patients showed narrower AHD than patients without impingement, and the lateral and central portions of the acromion appear to play an important role in the development of SI. AHD on MRI can be a useful ancillary marker for evaluation of SI in patients without a full-thickness tear of the supraspinatus tendon.
