

1. Background
Detection of prostate cancer is a big challenge. MRI helps in localizing prostate cancer with further guidance in the biopsy (1). Due to the high incidence of the disease, parameters for detection of early prostate cancer are controversial (2). In May 2010 Ad MeTech foundation’s international prostate MRI working group suggested the use of prostate imaging reporting and assessment system just like breast imaging-reporting and data system (BI-RADS) for breast cancer (3). The European society of urogenital Radiology published the prostate imaging reporting and data system (PI-RADS) for diagnosing prostate cancer in 2012 with multiparametric magnetic resonance imaging. PI-RADS v2 is the most recently advised guideline for prostate cancer interpretation (4).
2. Objectives
To evaluate the role of multiparametric magnetic resonance imaging based prostate imaging reporting and data system (PI-RADS) version 2 for the assessment of peripheral zone prostate cancer and its correlation with the T Staging, prostatic-specific antigen (PSA) levels and apparent diffusion coefficient (ADC) values.
| Revised PI-RADS Score Criteria | |
|---|---|
| Imaging Sequence and Score | Criteria |
| T2 W PZ | |
| 1 | Uniform hyper intense signal intensity (normal) |
| 2 | Linear or wedge shaped hypo intensity or diffuse hypo intensity, usually indistinct margin |
| 3 | Heterogeneous signal intensity or non-circumscribed, rounded, moderate hypo intensity includes others that do not qualify as 2, 4, or 5 |
| 4 | Circumscribed, homogeneous moderate hypo intense focus/mass confined to prostate and < 1.5 cm in greatest dimension |
| 5 | Same as 4 but ≥ 1.5 cm in greatest dimension |
| T2 W TZ | |
| 1 | Homogeneously moderate signal intensity (normal) |
| 2 | Circumscribed hypo intense or heterogeneous encapsulated nodule(s) (benign prostatic hyperplasia) |
| 3 | Heterogeneous signal intensity with obscured margins |
| 4 | Non circumscribed, homogeneous, moderately hypo intense and < 1.5 cm in greatest dimension |
| 5 | Same as 4, but ≥ 1.5 cm in greatest dimension or definite extra prostatic extension or invasive behavior |
| DWI PZ | |
| 1 | No abnormality on ADC maps and DWI with high b value (≥ 1400) |
| 2 | Indistinct and hypo intense on ADC maps |
| 3 | Focal mildly or moderately hypo intense on ADC maps and iso intense or mildly hyper intense on high b value DWI (≥ 1400) |
| 4 | Focal markedly hypo intense on ADC maps and markedly hyper intense on DWI with high b values (≥ 1400) and < 1.5 cm on axial images |
| 5 | Same as 4 but ≥ 1.5 cm in greatest dimension or definite extra prostatic extension and invasive behavior |
| DCE | |
| Negative | No early enhancement, diffuse enhancement not corresponding to a focal finding on T2-weighted and/or DWI, or focal enhancement corresponding to a lesion showing features of BPH on T2-weighted images |
| Positive | Focal enhancement and enhancement earlier than or contemporaneously with that of adjacent normal prostatic tissues and findings corresponding with findings suspicious for cancer on T2W and/or DWI images |
Abbrviations: ADC, apparent diffusion coefficient; BPH, benign prostatic hyperplasia; DCE, dynamic contrast-enhanced; DWI, diffusion weighted imaging; PI-RADS V2, prostate imaging reporting and data system version 2; PZ, peripheral zone; TZ, transitional zone; T2W, T2-weighted.
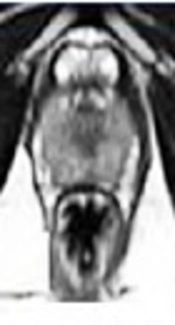
 (A) sequence in axial section reveals uniformly hyper intensity of the peripheral zone of the prostate with no hyper intense signal on diffusion weighted images (B) or hypo intensity on apparent difusion coefficient (ADC) maps (C) giving prostate imaging reporting and dating system (PI-RADS) v2 score of 1 on both T2WI and diffusion weighted imaging (DWI). D shows a wedge shaped faint hypo intensity on T2WI in the peripheral zone in the central and right paracentral location (arrows) with no hyper intense signal on DWI (E) or hypo intensity on ADC maps (F). It was falling under the score of 2 on T2WI and 1 on DWI. As it is located in the peripheral zone, a DWI score of 1 was given finally. Patient had a serum prostate-specific antigen (S.PSA) level of 6.5 ng/mL and underwent biopsy on urologist’s request and with his own consent which was negative for malignancy. T2WI (G) sequence in axial section in another patient reveals a small non-circumscribed indistinct hypo intensity in the peripheral zone of prostate on the left side (arrow), appearing isointense on DWI (H ) with hypointense signal on ADC maps (I) giving PI-RADS v2 score of 3 on T2WI and 3 on DWI . Lesion appears isointense to mildly hyper intense on pre-contrast volumetric interpolated breath-hold examination (VIBE) sequences (arrow in J) and showing early enhancement (K) and early wash out (L) on post contrast sequences- suggestive of positive pattern of enhancement on dynamic contrast enhanced (DCE). The PI-RADS v2 score of the lesion was upgraded from 3 to 4 by adding positive contrast enhancement pattern on DCE. Patient had S. PSA level of 43 ng/mL and biopsy revealed adenocarcioma. Lowest ADC value in the lesion was 0.73mm<sup>2</sup>/s and it was stage T2.")
T2-weighted image (T2WI) (A) sequence in axial section reveals uniformly hyper intensity of the peripheral zone of the prostate with no hyper intense signal on diffusion weighted images (B) or hypo intensity on apparent difusion coefficient (ADC) maps (C) giving prostate imaging reporting and dating system (PI-RADS) v2 score of 1 on both T2WI and diffusion weighted imaging (DWI). D shows a wedge shaped faint hypo intensity on T2WI in the peripheral zone in the central and right paracentral location (arrows) with no hyper intense signal on DWI (E) or hypo intensity on ADC maps (F). It was falling under the score of 2 on T2WI and 1 on DWI. As it is located in the peripheral zone, a DWI score of 1 was given finally. Patient had a serum prostate-specific antigen (S.PSA) level of 6.5 ng/mL and underwent biopsy on urologist’s request and with his own consent which was negative for malignancy. T2WI (G) sequence in axial section in another patient reveals a small non-circumscribed indistinct hypo intensity in the peripheral zone of prostate on the left side (arrow), appearing isointense on DWI (H ) with hypointense signal on ADC maps (I) giving PI-RADS v2 score of 3 on T2WI and 3 on DWI . Lesion appears isointense to mildly hyper intense on pre-contrast volumetric interpolated breath-hold examination (VIBE) sequences (arrow in J) and showing early enhancement (K) and early wash out (L) on post contrast sequences- suggestive of positive pattern of enhancement on dynamic contrast enhanced (DCE). The PI-RADS v2 score of the lesion was upgraded from 3 to 4 by adding positive contrast enhancement pattern on DCE. Patient had S. PSA level of 43 ng/mL and biopsy revealed adenocarcioma. Lowest ADC value in the lesion was 0.73mm2/s and it was stage T2.
 in the peripheral zone on the right side appearing hypointense on T2WI (A) sequence in axial section, appearing hyperintense on DWI (B) and hypointense on apparent difusion coefficient (ADC) maps (C) giving prostate imaging reporting and dating system version 2 (PI-RADS v2) score of 4 on T2WI and 4 on diffusion weighted imaging (DWI). The lesion measures 1.5 × 1.4 × 1.1 cm in size. Image D shows the an isointense lesion to faintly hypo intense on pre-contrast T1WI (arrow) and showing early enhancement (E) and early wash out (F) on post contrast sequences –suggestive of positive pattern of enhancement on DCE. PI-RADS v2 score of 3 was given finally. The patient had serum prostate-specific antigen (S.PSA) level of 25 ng/mL and biopsy revealed adenocarcioma. Lowest ADC value in the lesion was 0.80 mm<sup>2</sup>/s and it was stage T2. T2WI (G) sequence in axial section in another patient reveals a large ill defined hypo intensity in the peripheral zone of prostate on the right side (arrow), appearing hyper intense on DWI (H) with hypo intense signal on ADC maps (I) There is extra capsular extension of the lesion into right neurovascular bundle. It was PI-RADS v2 score 5 lesion. Image (J) shows the lesion to be isointense on pre-contrast T2W high resolution isotropic volume examination (THRIVE) sequences (arrow) and showing early enhancement (K) and early wash out (L) on post contrast sequences- suggestive of positive pattern of enhancement on dynamic contrast enhanced (DCE). Delayed enhancement pattern observed in the left lobe of prostate was a benign adenomatous lesion (L). The patient had an S. PSA level of 190 ng/ml and biopsy revealed adenocarcioma. Lowest ADC value in the lesion was 0.32 mm<sup>2</sup>/s and it was stage T3.")
There is a wedge shaped altered signal intensity area (arrow) in the peripheral zone on the right side appearing hypointense on T2WI (A) sequence in axial section, appearing hyperintense on DWI (B) and hypointense on apparent difusion coefficient (ADC) maps (C) giving prostate imaging reporting and dating system version 2 (PI-RADS v2) score of 4 on T2WI and 4 on diffusion weighted imaging (DWI). The lesion measures 1.5 × 1.4 × 1.1 cm in size. Image D shows the an isointense lesion to faintly hypo intense on pre-contrast T1WI (arrow) and showing early enhancement (E) and early wash out (F) on post contrast sequences –suggestive of positive pattern of enhancement on DCE. PI-RADS v2 score of 3 was given finally. The patient had serum prostate-specific antigen (S.PSA) level of 25 ng/mL and biopsy revealed adenocarcioma. Lowest ADC value in the lesion was 0.80 mm2/s and it was stage T2. T2WI (G) sequence in axial section in another patient reveals a large ill defined hypo intensity in the peripheral zone of prostate on the right side (arrow), appearing hyper intense on DWI (H) with hypo intense signal on ADC maps (I) There is extra capsular extension of the lesion into right neurovascular bundle. It was PI-RADS v2 score 5 lesion. Image (J) shows the lesion to be isointense on pre-contrast T2W high resolution isotropic volume examination (THRIVE) sequences (arrow) and showing early enhancement (K) and early wash out (L) on post contrast sequences- suggestive of positive pattern of enhancement on dynamic contrast enhanced (DCE). Delayed enhancement pattern observed in the left lobe of prostate was a benign adenomatous lesion (L). The patient had an S. PSA level of 190 ng/ml and biopsy revealed adenocarcioma. Lowest ADC value in the lesion was 0.32 mm2/s and it was stage T3.
| PI-RADS v2 score on DWI | ||||||
|---|---|---|---|---|---|---|
| 1 | 2 | 3 | 4 | 5 | ||
| T stage | 2 | 0 | 1 | 4 | 3 | 0 |
| 3 | 0 | 4 | 13 | 11 | 3 | |
| 4 | 0 | 0 | 1 | 12 | 35 | |
| P < 0.001 (highly significant) | ||||||
| S.PSA levels, ng/mL | > 4- ≤ 10 | 3 | 0 | 0 | 0 | 0 |
| 10 - 19.9 | 0 | 2 | 4 | 0 | 0 | |
| 20 - 99.9 | 0 | 3 | 13 | 15 | 2 | |
| > 100 | 0 | 0 | 1 | 8 | 36 | |
| P < 0.001 (highly significant) | ||||||
| ADC value, mm2/s | 0.30 -< 0.60 | 0 | 0 | 6 | 12 | 36 |
| 0.60 - < 0.90 | 0 | 5 | 12 | 11 | 1 | |
| > 0.90 | 3 | 0 | 0 | 0 | 1 | |
| P < 0.001 (highly significant) | ||||||
| PI-RADS score on T2WI | ||||||
| 1 | 2 | 3 | 4 | 5 | ||
| T stage | 2 | 0 | 1 | 5 | 2 | 0 |
| 3 | 1 | 7 | 12 | 10 | 3 | |
| 4 | 0 | 0 | 1 | 11 | 35 | |
| P < 0.001 (highly significant) | ||||||
| S.PSA levels, ng/mL | > 4 - ≤ 10 | 2 | 1 | 0 | 0 | 0 |
| 10 - 19.9 | 0 | 3 | 3 | 0 | 0 | |
| 20 - 99.9 | 0 | 3 | 14 | 14 | 2 | |
| > 100 | 0 | 0 | 1 | 8 | 36 | |
| P < 0.001 (highly significant) | ||||||
| ADC value, mm2/s | 0.30 - < 0.60 | 0 | 0 | 6 | 12 | 36 |
| 0.60 - < 0.90 | 0 | 6 | 12 | 10 | 1 | |
| > 0.90 | 1 | 2 | 0 | 0 | 1 | |
| P < 0.001 (highly significant) | ||||||
Abbrviations: ADC, apparent diffusion coefficient; DWI, diffusion weighted imaging; PI-RADS V2, prostate imaging reporting and data system version 2; S.PSA,serum prostate-specific antigen.
Abbrviations: ADC, apparent diffusion coefficient; DCE, dynamic contrast-enhanced; PI-RADS V2, prostate imaging reporting and data system version 2; S.PSA,serum prostate-specific antigen.
aNegative.
bPositive.
3. Patients and Methods
3.1. Patients
Eighty seven patients were included in the study with clinical suspicion of prostate cancer. Patients with serum PSA levels lower than 4 ng/mL or those with any contraindications to MRI were not included in the study. The location, size and morphologic features of lesions were assessed on conventional and diffusion weighted sequences. Contrast MRI with dynamic sequences was done in 73 patients as 14 patients had deranged renal functions. PI-RADS v2 score was calculated in all the patients and correlated with ADC values, S.PSA levels and T staging. The data obtained was analyzed statistically.
3.2. MRI Examination
Patients underwent MRI examinations on Philips Gyroscan Achieva 1.5 Tesla MRI and Siemens 1.5 Tesla MRI using sense body coil. Turbo spin-echo (TSE) T2-weighted (T2W) sequence was done in axial, coronal and sagittal planes using field of view (FOV) of 180 × 180 mm, slice thickness/ gap of 3 mm/0.3 mm, repetition time (TR) of 4500 - 4900 ms, echo time (TE) of 110 - 120 ms and number of signal average (NSA) of 4 - 6. TSE T1W sequence was done in axial plane using FOV of 180 × 180 mm, slice thickness/ gap of 3 mm/0.3 mm, TR of 450 - 500 ms, TE of 14 - 20 ms and NSA of 4. Matrix of 256 × 256 was used. Diffusion weighted imaging (DWI) were obtained in axial planes using FOV of 180 × 180 mm, slice thickness/ gap of 3 mm/0.3 mm, matrix of 160 × 160, TR of 4,800 - 4,900 ms, TE of 80 - 90 ms and NSA of 6. B values of 0, 800 and 1600 were used. Corresponding ADC images were obtained. DCE sequences were obtained using T1W high resolution isotropic volume examination (THRIVE) or volumetric interpolated breath-hold examination (VIBE) sequence withFOV of 210 × 210 mm, slice thickness/ gap of 3 mm/0.3 mm, matrix of 176 × 256, TR of 4.9 ms, TE of 2.4 ms and NSA of 1.10 mL of intravenous contrast (Omniscan) was used. Precontrast images were obtained followed by four postcontrast dynamic sequences.
3.3. Imaging Analysis
MRI images were reviewed independently by two radiologists. The lesions confined to the peripheral zone with or without extra prostatic extensions were noted. Three ADC values of the lesion were noted and the lowest value was recorded by one radiologist. The size of the lesion was obtained in all three dimensions and the largest value was considered. Patterns of enhancement were observed on dynamic contrast enhanced (DCE) sequences. PI-RADS v2 scoring was noted by the second radiologist (Table 1 and Figure 1). T staging was done by both radiologists. As radical prostatectomy was not performed in our patients, T staging was carried out based on MRI findings. Both the radiologists were blind about each other’s findings and the serum (S) PSA levels of the patients. Biopsy report was used as gold standard.
3.4. Statistical Analysis
Statistical analysis was carried out using statistical package for social sciences (IBM Corp. Released 2011. IBM SPSS Statistics for Windows, Version 20.0. Armonk, NY: IBM Corp).
4. Results
Eighty seven patients were included in the study. The mean age was 70.3 ± 10.8 years (mean ± standard deviation [SD]). The mean S.PSA levels were 107.06 ± 7.97 ng/mL (mean ± standard error [SE]).
A wedge shaped hypo intensity on T2-weighted image (T2WI) in the peripheral zone in the central and right paracentral location with no hyper intense signal on DWI was seen in one patient with S.PSA level of 6.5 ng/mL. It was falling under the score of 2 on T2WI and 1 on DWI (Figure 1). DCE was not done due to deranged renal functions. Although it was located in the peripheral zone and PI-RADS v2 score of 1 was given finally, the patient underwent biopsy on a urologist’s request and with his own consent. It was negative for malignancy. This further enhances the role of PI-RADS v2 score on DWI in peripheral zone lesions.
Two other patients with S.PSA levels of 4 -10 ng/mL had PI-RADS v2 score on T2WI and DWI of 1. The raised S.PSA levels were probably due to a previous episode of prostatitis. Repeated S.PSA levels after a one-month interval were normal. No biopsy was done.
One patient showed a small wedge-shaped faint hypo- intensity in the left peripheral zone on T2WI with restriction on ADC and a wash in wash out pattern of enhancement. The PI-RADS v2 score was upgraded from 3 to 4 based on DCE findings (Figure 1). We included patients with a lesion confined to the peripheral zone with or without extra prostatic extensions. We statistically correlated PI-RADS v2 score with S. PSA levels, T staging and ADC values with highly significant correlation and P value < 0.005 (Tables 2 and 3).
5. Discussion
Prostate cancer is the commonest male malignancy with < 10% mortality rate. With clinical and/or biochemical suspicion, MRI helps in cancer detection and localization. To increase the accuracy, T2WI was combined with DCE, DWI, and MR spectroscopy (5, 6). Villeirs et al. concluded that a combination of MRI and MRS yields better results than either modality alone (7). Afifi et al. concluded that the combination of PI-RADS scoring and mpMRI have a promising role in detection of prostate cancer rather than using single parameter (8).
ADC values in our study showed a highly significant statistical correlation with PI-RADS v2 scoring. With an increasing score, the mean ADC values decreased. Similar results were shown by Somford et al. (9).
The European society of urogenital radiology published the PI-RADS for prostate cancer (PC) in 2012. Hamoen et al. reviewed the diagnostic accuracy of PI-RADS for prostate cancer detection and concluded that it is helpful in the detection of prostate cancer (10).
In PI-RADS v1, DCE and MR spectroscopy (MRS) were also included in the protocols. But a study performed by Platzek et al. concluded that addition of these sequences do not have any added advantage (11, 12). Rosenkrantz et al. concluded that PI-RADS v2 is an improved scoring system and will definitely help the uro-radiologists (13). Tewes et al. compared PI-RRADS versions 1 and 2 in their study and concluded that PI-RADS v2 could be more practicable clinically for malignant lesion and as is less time consuming (14).
The dominant sequence in the peripheral zone is DWI. For transition zone lesions, T2W sequences are dominant with a supportive role of DWI and ADC maps (4). PI-RADS v2 is not used for overall staging of prostate cancer, but in our study we did locoregional staging and correlated T staging with the scores (Figure 2). We concluded that there was a highly significant correlation of ADC values with T2W and DWI scores with P value < 0.005 (Table 2).
PI-RADS v2 uses a 5-point assessment scale. A 5-point scoring is used for T2W and DWI with, a 2-point scale (positive or negative) for DCE. DCE is helpful only in the indeterminate category 3 peripheral zone (PZ) lesions (15,16). In our study, we used DWI score as the final score. In one case, DCE score upgraded the lesion score from 3 to 4.
PI-RADS v2 assessment categories are defined with the following scores:
1: Very low (clinically significant prostatic cancer (PCa) is highly unlikely to be present).
2: Low (clinically significant PCa is unlikely to be present)
3: Intermediate (the presence of clinically PCa disease is equivocal)
4: High (clinically significant PCa is likely to be present)
5: Very high (clinically significant PCa is highly likely to be present)
In conclusion, the dominant MR imaging sequence for the peripheral zone prostate cancer is diffusion weighted sequence and the corresponding ADC values with the role of DCE sequences in doubtful cases only. PI-RADS v2 should be routinely incorporated in the reporting protocol. Our study concluded that there is a highly significant correlation between lesion score on PI-RADS v2 with the T stage, corresponding ADC values and S.PSA levels, although larger study groups may be required for further evaluation and beyond doubt PI-RADS version 3 is already in its earliest stages.
