


1. Background
The new 2019 coronavirus (COVID-19) was discovered and identified due to viral pneumonia cases in Wuhan, Hubei Province in December 2019. It was named by the World Health Organization (WHO) on January 12, 2020. The COVID-19 pneumonia spread rapidly outside of Hubei Province as an acute respiratory infectious disease (1, 2).
According to the previous prospective study of 41 patients with confirmed COVID-19, all those patients had abnormal findings on chest computed tomography (CT) imaging (3). Therefore, CT is strongly recommended for the diagnosis of COVID-19 cases to provide both the abnormal features and the extent of chest involvement (4). The patients with COVID-19 often present the following features: (1) subpleural or vascular bundle distribution along the bronchi; (2) ≥ 3 lesions; (3) patchy, large block, nodular, lumpy, and honeycomb-like, grid-like, or cord-like morphology of the lesions; (4) uneven density, ground glass density, interlobular septal thickening, consolidation, and thickened bronchial wall; (5) air-bronchogram (5, 6). In addition, CT imaging features may be associated with response to clinical treatment and outcomes (7). However, the relationship between the time of symptom onset and radiological features of COVID-19 still needs to be well documented.
2. Objectives
Therefore, we report the CT characteristics of patients with different times of symptom onset, in order to summarize the CT features in each stage, and the CT feature changes according to the disease progress.
3. Patients and Methods
3.1. Patients
The institutional review board of our hospital waived the requirement to obtain written informed consent for this retrospective study. The clinical characteristics, epidemiology, laboratory examination, and imaging data were collected from 61 patients with COVID-19 from January 23 to February 10, 2020, admitted to eight hospitals. All patients are treated in the isolation ward. The patients met the following criteria: All the confirmed cases tested positive for COVID-19 nucleic acid by real-time fluorescence polymerase chain reaction of the patient’s sputum, and all patients underwent at least one CT examination. No specific excluding criteria were applied.
3.2. CT Protocol
CT examination was performed using muti-detector CT: Discovery 750HD (GE Medical Systems, Milwaukee, WI) or TOSHIBA Activion 16 (Toshiba, Tokyo, Japans). The images were acquired and reconstructed as axial images using the following parameters: 120kVp, adaptive tube current, 1.25mm section thickness and 1.25mm interval.
3.3. CT Image Review
Herein, 96 CT images were read independently by two chest imaging radiologists with more than 5 years of experience. In case of disagreement, a third doctor with 15 years of experience in chest imaging made the final decision. All the lesions were marked and recorded. According to CT features of COVID-19 patients previously reported (4-6), the features appearing on the image were evaluated and classified into following patterns: (A) single ground-glass opacity (GGO) pattern; (B) multiple GGO pattern; (C) nodule pattern (multiple ground glass nodules or partial solid nodules); (D) crazy paving GGO pattern (scattered GGO separated by honeycomb-like or grid-like thickened interlobular septa); (E) crazy paving GGO mixed with partial consolidation pattern (F) consolidation pattern (consolidation with air-bronchogram inside) (G) strip-like opacity pattern (a few scattered strip-like consolidations with sharp borders) (H) minimal parenchymal bands pattern; (I) no sign. If more than one feature appeared on an image, it was classified according to the main features. The range of abnormal opacity was calculated by the number of segments of lesion involved.
3.4. Statistical Analysis
Day 1 was defined as the day of symptom onset. The median values of number of segments involved were compared between different stages. The frequency of CT patterns in different periods were presented as absolute numbers and percentages. The Mann-Whitney U test was employed for the difference between the median values of the number of segments involved. Intra- and inter-observer agreement was quantified using Cohen's kappa. A P value < 0.05 was considered as significant for all statistical analyses. All statistical analyses were performed using SPSS 17.0 (SPSS, version 17.0; Chicago, IL, USA).
4. Results
4.1. Patients
Of the 61 patients, 37 were male (59.6%), with a mean age of 45 ± 2.6 (range, 9 - 77) years; and 24 were female, with a mean age of 47 ± 3.1 (range, 31 - 82). Of these, 46 cases reported a history of travel to or residence in Wuhan city in the last 14 days before the onset of symptoms, and 15 cases had close contact with patients with fever or respiratory symptoms from Wuhan city. The duration from symptom onset to initial CT was 6.2 ± 2.6 days. The shortest and longest incubation and contagious period was 1 - 12 (average, 4.8) days, respectively. 17 patients had at least one repeat CT; therefore, 35 repeat CTs were collected. The mean interval time between each follow up CT was 3 ± 2 days. The patient characteristics are listed in Table 1.
| Characteristics (n = 61) | Value |
|---|---|
| Age in years, No. (%) | |
| < 30 | 14 (23) |
| 30 - 40 | 13 (22) |
| 40 - 50 | 21 (34) |
| 50 - 60 | 6 (10) |
| 60 - 80 | 7 (11) |
| Gender (male), No. (%) | 37 (59) |
| Exposure, No. (%) | |
| Recently been to Wuhan | 45 (71) |
| Clustered cases or close contact with patients | 15 (24) |
| Incubation and contagious period (d) | 4.8 ± 3.6 (1, 12) |
| Time of symptom onset (d) | 6.2 ± 2.6 (1, 11) |
| Fever during hospital admission, No. (%) | 58 (94) |
| Highest temperature during hospitalization, ºC | |
| 37 - 38 | 34 (55) |
| 38 - 39 | 13 (21) |
| > 39 | 7 (11) |
| Leukocyte count < 4×10⁻⁹/L | 10 (16.1) |
| Past medical history | |
| Heart disease | 8 (13) |
| Diabetes | 7 (11) |
| Hypertension | 12 (20) |
| Cancer | 0 (0) |
4.2. CT Imaging Features and Time of Symptom Onset
There was an overall agreement regarding main CT pattern classification for intra-observer (K = 0.931, P < 0.001), and inter-observer readings (K = 0.912, P < 0.001). According to the time between symptom onset and initial CT (1 - 11d), three stages of lung CT were assigned: stage-1: 1 - 3d, stage-2: 4 - 7d, and stage-3: 8 - 11d. The imaging findings of each stage of the disease are summarized in Table 2 and Figure 1. At stage-1 (1 - 3 days) the main CT imaging manifestations were (A) single GGO and (B) multiple GGO (Figure 2). When the course of disease progresses 4 - 7 days (Figure 3), the main imaging features were crazy paving GGO mixed with partial consolidation pattern (E). Other imaging features included multiple GGO pattern (B), nodule pattern (C), crazy paving GGO pattern (D) and consolidation pattern (F). When the disease reached 8 - 11 days (Figure 3), the main CT imaging features were consolidation pattern (F), and pattern (E). Two patients underwent CT examination on the first and fourth days of symptom onset, respectively; however, no imaging findings were observed. The total segments of lung involvement in each stage were summarized as 3 (range from 1 to 5), 5 (range from 3 to 7, P < 0.001, compared to that of stage-1), and 6 (range from 3 to 8, P < 0.001, compared to that of stage-1) in each stage.
| Time between symptoms and initial CT | |||
|---|---|---|---|
| 1 - 3 d (n = 23) | 4 - 7 d (n = 32) | 8 - 11 d (n = 6) | |
| CT imaging features | |||
| A Single GGO | 7 (30%) | ||
| B Multiple GGO | 8 (35%) | 2 (6%) | |
| C Nodule pattern | 2 (9%) | 2 (6%) | |
| D Crazy paving GGO pattern | 2 (6%) | ||
| E Crazy paving GGO mixed with partial consolidation pattern | 5 (22%) | 15 (47%) | 2 (34%) |
| F Consolidation pattern | 10 (31%) | 3(50%) | |
| G Strip-like opacity pattern | 1(16%) | ||
| H Minimal parenchymal bands pattern | |||
| I No signs | 1 (4%) | 1 (3%) | |
Abbreviation: GGO, ground-glass opacity
aValues are expressed as No. (%).

Relationship between CT image patterns and the time of symptom onset
. A, Single GGO (pattern A); B, Subpleural scattered focal GGO in both lungs (pattern B); C, Multiple ground glass nodules (pattern C).")
CT findings 3 days after symptoms onset (stage-1). A, Single GGO (pattern A); B, Subpleural scattered focal GGO in both lungs (pattern B); C, Multiple ground glass nodules (pattern C).
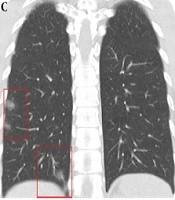
 and stage-3 (8 - 11 days) after symptoms onset. Pattern D of crazy paving GGO (A-C); pattern E of crazy paving GGO mixed with partial consolidation (D); pattern F of consolidation (E); and pattern G of strip-like opacity pattern (F) are shown.")
Imaging findings at stage-2 (4 - 7 days) and stage-3 (8 - 11 days) after symptoms onset. Pattern D of crazy paving GGO (A-C); pattern E of crazy paving GGO mixed with partial consolidation (D); pattern F of consolidation (E); and pattern G of strip-like opacity pattern (F) are shown.
4.3. Follow up CT
The CT imaging features of the first CT and follow-up CT of 17 patients are shown in Figure 4. With the evolution of the disease, the features of GGO (B) manifested at the early stage (1 - 3d). In the rapid progress stage (4 - 14d), the crazy paving GGO mixed with partial consolidation pattern (E) and consolidation pattern (F) were shown with the density increased. In the absorption stage (15 - 24d), both the density of the lesion and the extent of lesion reduced (Figures 5 and 6).

Changes of CT features according to the evolution of disease in 17 patients
, 7th (stage-2), 12th, 16th, 21th, and 24th day (stage-3) demonstrated crazy paving GGO mixed with partial consolidation pattern (pattern E) (A), consolidation pattern (pattern F) (B, C), strip-like opacity pattern (pattern G) (D), minimal parenchymal bands pattern (pattern H) (E) and multiple GGO pattern (pattern B) (F) respectively.")
CT image findings of a 41-year-old male on the 2nd (stage-1), 7th (stage-2), 12th, 16th, 21th, and 24th day (stage-3) demonstrated crazy paving GGO mixed with partial consolidation pattern (pattern E) (A), consolidation pattern (pattern F) (B, C), strip-like opacity pattern (pattern G) (D), minimal parenchymal bands pattern (pattern H) (E) and multiple GGO pattern (pattern B) (F) respectively.
, 6th (stage-2), 9th, 12th, 16th and 21th (stage-3) day demonstrated crazy paving GGO pattern (pattern D) (A), crazy paving GGO mixed with partial consolidation pattern (pattern E) (B), consolidation pattern (pattern F) (C, D) and minimal parenchymal bands pattern (pattern H) (E) and multiple GGO pattern (pattern B) (F) respectively.")
CT image findings of a 42-year-old male on the 2nd (stage-1), 6th (stage-2), 9th, 12th, 16th and 21th (stage-3) day demonstrated crazy paving GGO pattern (pattern D) (A), crazy paving GGO mixed with partial consolidation pattern (pattern E) (B), consolidation pattern (pattern F) (C, D) and minimal parenchymal bands pattern (pattern H) (E) and multiple GGO pattern (pattern B) (F) respectively.
5. Discussion
Herein, we report 61 cases of pneumonia due to COVID-19, among which 59 showed positive CT findings on the first CT. The symptoms in these patients presented at the time of presentation. Of these, 54 patients had different degrees of fever. A total of 96 CT images were obtained, including 61 first-visit chest CT and 35 follow-up CT images. The imaging features found in these CTs are similar to those reported previously (8).
According to the analysis, a correlation was established between the characteristics of CT patterns and the time of symptom onset. Within 3 days after onset, the majority of the lesions were characterized by single or multiple GGO. These lesions were scattered, light-density, not fused with each other, and easily missed during diagnosis. The lesions progressed rapidly in 4 - 7 days, indicating fusion into large-scale consolidation with light density or GGO separated by honeycomb-like or grid-like thickened interlobular septa. The degree of fibrosis was further aggravated between 8 and 11 days, which showed that the volume of the consolidation may reduce with the air-bronchogram inside.
The altered imaging patterns with the course of the disease may be determined by the pathological changes caused by virus infection. Viruses in the same viral family have a similar pathogenesis. The preliminary data suggests that the CT findings for COVID-19 have many similar features to other coronaviruses: SARS and MERS (9, 10). At the early stage, the pathological features are dilatation and congestion of alveolar septal capillary, exudation of fluid in the alveolar cavity, and interlobular interstitial edema. When the disease progresses rapidly, further aggravation of alveolar and interstitial edema occurs due to accumulation of a large number of cell-rich exudates in the alveolar cavity, vascular expansion, and exudation in the interstitium. The fibrous exudation fuses each alveolus through the interalveolar space. Gradually, the fibrous exudation is absorbed and some patchy consolidation or strip-like opacity is observed on CT.
The imaging manifestations of 4 - 7 days were diverse, altering rapidly, and hence, could be manifested as scattered focal GGO or a fused and large-scale light consolidation with air-bronchogram inside (B-F). These phenomena could be attributed to the following: (1) The age difference of the patients: lesions in younger patients (< 30 years) were milder, while lesions in the elderly were severe; (2) Time of treatment: If the patient visited a doctor at an early stage (1 - 3 d), the lesions were mild. If the patient visited a doctor at a later stage (> 4 d), the lesions were severe.
Nonetheless, the present study has limitations. A relatively small number of follow-up CT imaging was conducted. In addition, 5-mm-thickness images might have been overlooked. There is also lack of quantitative CT to accurately quantify the extent of lesions.
In summary, CT imaging is related to the progress of the disease. At the onset of 4 - 7 days, the course of the disease is rapid with diverse imaging manifestations. The CT imaging features are associated with the time of symptom onset and the progress. Understanding the imaging characteristics of each stage is very helpful to understand the development of the disease.
