


1. Background
Since the introduction of free anterolateral thigh perforator flap (ALTPF) by Koshima et al. for reconstruction purposes in 1993 (1), it has become a versatile technique, showing promising clinical efficacy in neck and head soft-tissue reconstructive microsurgeries due to the large blood supply area and limited harmful effects (2). Therefore, harvesting the lateral circumflex femoral artery (LCFA) perforator flaps depends on the surgeon’s years of experience and operative skills. In the past, even highly skilled and experienced surgeons could not always harvest the vessels accurately (3), which restrained the clinical application of this technique to some extent.
Computed tomography angiography (CTA) is considered the gold standard for navigation of deep inferior epigastric perforator flaps to increase the safety and precision of surgery (4). However, the scanned area is large, and patients are usually exposed to high-dose radiation because of the large scale of lower limb vessels. To overcome these shortcomings, application of a low tube Kilovoltage peak (kVp) has been regarded as a reliable approach to reduce the radiation dose; nevertheless, it inevitably compromises the image quality (5). Therefore, a CTA protocol, which can reduce the radiation dose while maintaining the image quality, is warranted. An emerging technique, called adaptive statistical iterative reconstruction (ASIR), which is an important iterative reconstruction (IR) technique, has been widely studied for reducing the image noise and improving the image quality (6). However, application of ASIR with a low tube Kilovoltage peak (kVp) is limited in ALTPF.
2. Objectives
This study aimed to assess the clinical feasibility of a low-dose CTA protocol for ALTPF, using a combined radiation dose-saving strategy, involving ASIR and a tube voltage of 80 kVp.
3. Patients and Methods
3.1. Participants
This prospective, randomized controlled trial was conducted on consecutively selected patients, who were scheduled for the ALTPF surgery and CTA examination of both lower limb arterioles in Wuxi No.9 People's Hospital, affiliated to Soochow University (Suzhou, China) from August 2016 to July 2017. The inclusion criteria were as follows: (1) age range of 15 - 70 years; (2) body mass index (BMI) of 18 - 27 kg/m2; and (3) having indications for surgery. On the other hand, the exclusion criteria were as follows: (1) allergy to the contrast agent; (2) diagnosis of serious internal diseases, such as heart and kidney diseases; and (3) having contraindications for ALTPF transplantation. The patients were randomized into three groups using a random number generator (Figure 1).

The process of patient enrollment and grouping
This study was reviewed and approved by the Ethics Committee of Wuxi No.9 People’s Hospital (No. 201509) and performed in accordance with the ethical standards of the Declaration of Helsinki. Informed consent was also obtained from all individual participants. This randomized controlled trial was registered in the Chinese Clinical Trial Registry (ChiCTR2300068024).
3.2. CT Scan Protocol
All CT examinations were performed using a GE Optima CT660 128-Row Multislice Spiral CT Scanner (Lightspeed Ultra, GE Medical Systems, Milwaukee, WI, USA). The scanning scope ranged from a 5-cm distance from the upper side of the anterior superior iliac spine to a 10-cm distance from the inferior pole of the patellar tendon. The contrast solution was Omnipaque, injected at 350 mgI/mL (standard, 1.8 mL/kg, dosage < 120 mL). All the patients were scanned in a manually triggered sequential scanning mode. The regions of interest (ROI size, 10 mm²) were located on the lower side of the abdominal aorta. When the CT attention value of the ROI reached 150 Hounsfield units (HU), scanning was triggered. After successful scanning, data were uploaded to AW Server 2.0 3D Image Workstation for further processing.
There were three imaging protocols in this study. Group A received the standard radiation dose with a fixed tube voltage of 120 kVp and automatic tube current modulation. The images in group A were reconstructed based on the filtered back projection (FBP) algorithm. In group B, a tube voltage of 100 kVp was fixed with automatic tube current modulation, and the images were reconstructed using the ASIR algorithm. In group C, a lower tube voltage (80 kVp) was fixed with automatic tube current modulation, and the ASIR algorithm was applied for images reconstruction. The layer thickness was 5.0 mm, the pitch was 1.5, and the image reconstruction layer thickness was 0.625 mm.
3.3. Image Analysis
The mean vessel/tissue attenuation value was calculated by averaging all mean attenuation values measured in three ROIs per patient. The background image noise was defined as the standard deviation (SD) of CT value measured in the adjacent muscle (7). Next, to quantitatively evaluate the image quality, the signal-to-noise ratio (SNR) (7), contrast-to-noise ratio (CNR) (8), and figure of merit (FOM) were calculated for radiation exposure adjustments in the three protocols (9). The SNR, CNR, and FOM were calculated as follows:
Finally, a subjective image analysis was performed blindly by two independent experienced senior radiologists. The image reviewers initially received standard instructions and evaluated the general quality of images according to a four-point Likert scale (10).
3.4. Measurement of Radiation Dose
The scanning length and CT dose index (CTDI) were recorded for each group. The dose-length product (DLP) values were also calculated by multiplying the CTDI and scanning length. The ED was calculated according to the DLP values, based on the following equation:
where κ equals 0.019.
3.5. Statistical Analysis
Continuous variables are expressed as mean and SD, and categorical variables are expressed as absolute number and percentage. The inter-observer variability between two independent observers was examined based on Cohen’s kappa coefficient for the evaluation of CT image quality. For normally distributed variables, comparisons were performed between the three groups using one-way analysis of variance (ANOVA), followed by Tukey’s post-hoc test. To compare non-normally distributed variables and ranked data between the three groups, Kruskal-Wallis test was used. Chi-square or Fisher’s exact test was also applied for comparing proportions between the groups. A two-tailed P-value less than 0.05 was considered statistically significant.
4. Results
4.1. Characteristics of the Study Population
The average age of the study population was 38 years (SD, 12.10), and their mean BMI was 22.19 kg/m2 (SD, 1.78). The characteristics of the patients in each group are summarized in Table 1. There was no significant difference in terms of age, sex, and BMI between the three groups (P > 0.05 for all).
| Group A | Group B | Group C | P-value | |
|---|---|---|---|---|
| Number of patients | 20 | 20 | 20 | |
| Age, y | 36.6 ± 14.47 | 38.90 ± 10.11 | 39.35 ± 11.76 | 0.749 |
| Sex (male/female) | 11/9 | 13/7 | 12/8 | 0.812 |
| BMI, kg/m2 | 22.08 ± 1.30 | 22.29 ± 1.90 | 22.20 ± 2.13 | 0.943 |
Abbreviations: BMI, body mass index.
a Continuous parameters are presented as mean ± standard deviation (SD).
4.2. CT Attenuation Values and Image Noise
As shown in Table 2, significant differences were observed in the vessel CT values between the three groups (P < 0.001 for all), with group C (ASIR-80 kVp) showing the highest values. Except for the CT values in the tissue around the femoral artery (FA) (P = 0.493), the CT values of background tissues were significantly different between the three groups in both the iliac artery (IA) and the descending branch of LCFA (P < 0.05). The image noise was also evaluated in the three groups in various positions, and no significant differences were found between the three protocols regarding image noise at FA and the descending branch of LCFA, although a relatively higher noise was observed in the IA in group B (P = 0.046).
| Region | Parameter | Group A | Group B | Group C | P-value |
|---|---|---|---|---|---|
| IA | Vessel (HU) | 288.70 ± 37.79 | 323.25 ± 35.64* | 494.42 ± 62.09# | < 0.001 |
| Tissue (HU) | 61.27 ± 3.19 | 65.93 ± 14.76* | 70.22 ± 6.08# | < 0.001 | |
| Image noise (HU) | 4.84 ± 6.99 | 8.08 ± 10.58* | 6.89 ± 6.50# | 0.046 | |
| FA | Vessel (HU) | 316.18 ± 41.00 | 334.37 ± 27.67* | 512.54 ± 68.31# | < 0.001 |
| Tissue (HU) | 55.76 ± 8.31 | 57.61 ± 6.35 | 61.28 ± 13.49# | 0.493 | |
| Image noise (HU) | 6.89 ± 10.98 | 6.20 ± 6.51 | 4.18 ± 2.28# | 0.634 | |
| Descending branch of LCFA | Vessel (HU) | 285.66 ± 36.35 | 303.33 ± 47.92* | 514.90 ± 68.77# | < 0.001 |
| Tissue (HU) | 65.88 ± 5.53 | 62.99 ± 6.45* | 70.98 ± 9.81# | 0.005 | |
| Image noise (HU) | 5.93 ± 10.08 | 9.71 ± 11.78* | 6.94 ± 7.73 | 0.469 |
Abbreviations: HU, hounsfield unit; IA, iliac artery; LCFA, lateral circumflex femoral artery; FA, femoral artery.
a Data are presented as mean ± standard deviation (SD). *Difference between group A and group B is statistically significant (P < 0.05). #Difference between group A and group C is statistically significant (P < 0.05).
4.3. Objective Quality Evaluation
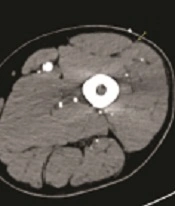
The representative images of the anterolateral thigh perforator of different groups are shown in Figure 2. Besides, the objective quality of the images was examined from different aspects. The SNR, CNR, and FOM of each image were also calculated and compared. As shown in Figure 3A and B, there was no significant difference regarding SNR and CNR between the three groups in the three evaluated segments. However, group C showed a higher CNR in the descending branch of LCFA compared to group B (group C, 125.36 ± 102.30 vs. group B, 70.51 ± 55.87; P = 0.064). Since SNR and CNR may be influenced by effective radiation, the FOM was also calculated to adjust for the radiation dose and to compare the image quality. As shown in Figure 3C, the FOM of images was significantly higher in group C compared to the other two groups in all three evaluated segments (P < 0.001 for all).
![Sample images of the anterolateral thigh perforator (ALTPF) in different groups. A, B, and C, Show representative images of ALTPF measurements in a patient from group A (filtered back projection [FBP] with 120-kVp tube voltage), a patient from group B (adaptive statistical iterative reconstruction [ASIR] with 100-kVp tube voltage), and a patient from group C (ASIR with 80-kVp tube voltage). Yellow arrows indicate the perforator in each group. The images show an overall similar quality in different scan protocols.](https://services.brieflands.com/cdn/serve/3170b/37ab90a18f76de8481e403b4fd98b6d825a7893c/iranjradiol-129458-i00g-F2-preview.webp "Sample images of the anterolateral thigh perforator (ALTPF) in different groups. A, B, and C, Show representative images of ALTPF measurements in a patient from group A (filtered back projection [FBP] with 120-kVp tube voltage), a patient from group B (adaptive statistical iterative reconstruction [ASIR] with 100-kVp tube voltage), and a patient from group C (ASIR with 80-kVp tube voltage). Yellow arrows indicate the perforator in each group. The images show an overall similar quality in different scan protocols.")
Sample images of the anterolateral thigh perforator (ALTPF) in different groups. A, B, and C, Show representative images of ALTPF measurements in a patient from group A (filtered back projection [FBP] with 120-kVp tube voltage), a patient from group B (adaptive statistical iterative reconstruction [ASIR] with 100-kVp tube voltage), and a patient from group C (ASIR with 80-kVp tube voltage). Yellow arrows indicate the perforator in each group. The images show an overall similar quality in different scan protocols.
 in different arterial segments between the groups. B, Comparison of contrast-to-noise ratio (CNR) values in different arterial segments between the groups. C, Comparison of figure of merit (FOM) in different arterial segments between the groups. Comparison of the three groups is performed by one-way analysis of variance (ANOVA), followed by Tukey’s post-hoc test (∗P < 0.05, ∗∗P < 0.01, ∗∗∗P < 0.001).")
Comparison of objective image quality. A, Comparison of signal-to-noise ratio (SNR) in different arterial segments between the groups. B, Comparison of contrast-to-noise ratio (CNR) values in different arterial segments between the groups. C, Comparison of figure of merit (FOM) in different arterial segments between the groups. Comparison of the three groups is performed by one-way analysis of variance (ANOVA), followed by Tukey’s post-hoc test (∗P < 0.05, ∗∗P < 0.01, ∗∗∗P < 0.001).
4.4. Subjective Quality Evaluation
As summarized in Table 3, there were no poor-quality images in the three groups. The Likert score for the FBP, ASIR-100 kVp, and ASIR-80 kVp protocols showed no significant differences in any of the segments (P > 0.05 for all); therefore, the ASIR-80 kVp protocol is not inferior to the other two protocols in terms of the overall image quality. Moreover, substantial agreement was found between the two observers regarding the score of image quality (kappa coefficient, 0.76), indicating moderate consistency.
| Parameters | Group A, No. (%) | Group B, No. (%) | Group C, No. (%) | P-value |
|---|---|---|---|---|
| IA | ||||
| Excellent (score 4) | 16 (80) | 15 (75) | 12 (60) | 0.31 (0.310) |
| Good (score 3) | 4 (20) | 5 (25) | 7 (30) | |
| Moderate (score 2) | 0 (0) | 0 (0) | 1 (5) | |
| Poor (score 1) | 0 (0) | 0 (0) | 0 (0) | |
| FA | ||||
| Excellent (score 41) | 15 (75) | 13 (65) | 10 (50) | 0.19 (0.189) |
| Good (score 3) | 5 (25) | 7 (35) | 8 (40) | |
| Moderate (score 2) | 0 (0) | 0 (0) | 2 (10) | |
| Poor (score 1) | 0 (0) | 0 (0) | 0 (0) | |
| Descending branch of LCFA | ||||
| Excellent (score 4) | 17 (85) | 14 (70) | 12 (60) | 0.17 (0.174) |
| Good (score 3) | 3 (15) | 6 (30) | 6 (30) | |
| Moderate (score 2) | 0 (0) | 0 (0) | 2 (10) | |
| Poor (score 1) | 0 (0) | 0 (0) | 0 (0) |
Abbreviations: IA, iliac artery; LCFA, lateral circumflex femoral artery; FA, femoral artery.
a A four-point Likert scale is used to evaluated the subjective quality of images.
4.5. Radiation Dose Comparison
According to Table 4, there was no significant difference in the scanning length between the three groups. However, when the tube voltage decreased from 120 kVp to 100 and 80 kVp, the ED significantly decreased by 16.45% and 64.99%, respectively. Compared to group A and group B, significant reductions were observed in group C regarding CTDI (group C: 11.95 ± 1.02 mGy vs. group A: 35.18 ± 3.40 mGy and group B: 28.31 ± 2.18 mGy), DLP (group C: 729.45 ± 33.22 mGy/cm vs. group A: 22083.64 ± 170.43 mGy/cm and group B: 1720.15 ± 121.78 mGy/cm), and ED (group C: 13.86 ± 0.63 mSv vs. group A: 39.59 ± 3.24 mSv and group B: 32.68 ± 2.31 mSv). It can be concluded that the 80-kVp CTA protocol with ASIR could significantly reduce the radiation dose for candidates of ALTPF surgery in the preoperative localization of target vessels.
| Radiation parameters | Group A | Group B | Group C | P-value |
|---|---|---|---|---|
| Scan length, cm | 59.40 ± 3.39 | 61.25 ± 3.97 | 61.25 ± 3.77 | 0.184 |
| CTDI, mGy | 35.18 ± 3.40 | 28.31 ± 2.18* | 11.95 ± 1.02# | < 0.001 |
| DLP, mGy/cm | 2083.64 ± 170.43 | 1720.15 ± 121.78* | 729.45 ± 33.22# | < 0.001 |
| ED, mSv | 39.59 ± 3.24 | 32.68 ± 2.31* | 13.86 ± 0.63# | < 0.001 |
Abbreviations: CTDI, computed tomography dose index; DLP, dose-length product; ED, effective dose; mGy, milligray; mSv, millisievert.
a Parameters are presented as mean ± standard deviation (SD). *Difference between group A and group B is statistically significant (P < 0.05). #Difference between group A and group C is statistically significant (P < 0.05).
5. Discussion
In this study, a new protocol was evaluated for the preoperative evaluation of lower limb arteries in patients seeking the ALTPF surgery. Although by decreasing the tube voltage, the image noise might slightly increase, the 80-kVp protocol with ASIR yielded a lower image quality, regardless of the type of evaluation (objective or subjective). Besides, the 80-kVp protocol with ASIR could significantly reduce the radiation dose for patients and improve the FOM of the images.
Over the past years, CTA has been widely applied for analyzing the source, territory, and variations of lower limb arteries for preparation of ALTPF surgery (11). However, the large scale of the scanning area raises concerns regarding exposure to high levels of ionizing radiation, which remains an important issue in clinical imaging (12). Major efforts have been made to reduce the radiation dose while maintaining the image quality for diagnostic purposes. Generally, radiologists try to reduce the radiation dose by decreasing the tube voltage or current (13), although compared to the former, the latter is less efficient. Since the radiation dose is positively correlated with the square of voltage, a decrease in tube voltage can lead to remarkable dose reductions; meanwhile, the image quality may be affected by the increased noise. Based on the current results, by decreasing the voltage, the background image noise increased, which is consistent with previous research (14).
Image reconstruction algorithms play a critical role in image quality. The iterative reconstruction, as a noise reduction technique, facilitates exposure to a lower radiation dose (15). Compared to FBP reconstruction, ASIR ensures the image quality, while reducing the radiation dose (16). As a hybrid IR algorithm, ASIR yields blended FBP and IR images, with IR percentages of 0 to 100%, where the percentage represents the contribution of ASIR to the final image (5, 10). The present results showed the increasing trend of CNR in the descending branch of LCFA in group C, although there was no significant difference in SNR between the three groups. The application of ASIR technique increased the FOM of images, with group C showing the highest FOM in all three arterial sections.
Considering the radiation dose, lower exposure was achieved in group B and group C in the present study. When the tube voltage decreased from 120 kVp to 100 and 80 kVp, the ED significantly decreased by 16.45% and 64.99%, respectively. It is worth mentioning that the subjective image quality of the three groups was not significantly different, and there were no poor-quality images in any of the groups. Based on these results, a small reduction in voltage might not exert negative effects on the image quality when combined with the ASIR algorithm.
In conclusion, because of variability in the LCFA, operation mainly relies on the surgeon’s experience and skills. However, if there is an unexpected variation in the artery, the operation time will be prolonged, which may increase the risk of complications. The preoperative CTA detection can help surgeons to accurately localize the perforator and optimally design the operation. In the present study, the concordance rate of perforator detection between the CTA and surgical confirmation was as high as 96.7% in group C. Accordingly, application of a low-dose CTA protocol with ASIR for lower limb arterial examinations can effectively guide the ALTPF surgery.
