1. Background
Diffusion tensor imaging (DTI) of the peripheral nerve has been successfully used in the wrist region for imaging the median nerve and diagnosing carpal tunnel syndrome (CTS) by fiber tracking and by measuring fractional anisotropy (FA) and the apparent diffusion coefficient (ADC) value (1-5). In addition to fiber tracking, Skorpil et al. (6), in 2007, used the maximum intensity projection (MIP) technique to reconstruct sciatic nerves based on magnetic resonance (MR) DTI images, both single-direction and all directions. In a recent study (7), we obtained a stereoscopic display of the peripheral nerves at the elbow region based on DTI data using post-processing methods of volume rendering (VR) and MIP. However, the noise in images was obvious in these two studies.
Takahara et al. (8) introduced the subtraction of unidirectionally encoded images for suppression of heavily isotropic objects (SUSHI), a novel post-processing method based on diffusion-weighted MR neurography (DW-MRN). In 2010, using this method, Takahara at al. (8) imaged the brachial plexus and the sciatic nerve and its branches. The nerves could be displayed clearly, and the signal of the surrounding tissue was removed with this method.
The principle of SUSHI is that diffusion is less restricted in the direction parallel to the nerve fiber than in the direction perpendicular to the fiber, possibly because of the myelin layers. When diffusion is applied in a direction that is perpendicular to the nerve, the water molecule diffusions in the nerve and surrounding isotropic tissue are all very low, allowing the nerve and surrounding tissue to be imaged with a high signal. When diffusion is applied in a direction that is parallel to the nerve, the water molecule diffusion in the nerve is much higher than the water diffusion in the surrounding tissue; thus, the nerve signal is the weakest or cannot be imaged, while the surrounding tissue can be imaged with a high signal like that in the perpendicular direction. In the limbs, the course of the main nerves approximately follows the limb axis, so the anterior-posterior (AP) direction can be represented as the perpendicular direction and the superior-inferior (SI) direction can be represented as the parallel direction. SUSHI post-processing involves subtracting the DW-MRNSI from the DW-MRNAP, resulting in the DW-MRNSUSHI. The DW-MRNSUSHI can provide clear and pure 3D images of nerves by MIP reconstruction.
The objective of this study was to achieve 3D display of the peripheral nerves in the wrist region using two post-processing methods for DTI raw data (VR reconstruction for single-direction images and SUSHI), to compare these methods’ usefulness for reducing background noise, and to explore their clinical applications.
2. Objectives
In this study, we tested the following assumptions: 1, we can select the 2 most appropriate directions in DTI data for SUSHI post-processing; and 2, after SUSHI post-processing, nerve signal attenuation is not obvious, and the background noise can be effectively removed.
3. Materials and Methods
3.1. Study Subjects
This study received prior approval by our institutional review board and ethics committee, and all subjects provided informed consent prior to taking part in the study. The inclusion criteria for volunteers were as follows: 1, they were adults whose ages ranged 20 - 35 years; 2, they provided informed consent prior to taking part in the study; and 3, equal numbers of males and females were included. Altogether, 20 wrists of 10 healthy adult volunteers were studied (5 men and 5 women, aged 22 - 32 years). The nerves of the wrist region (from the distal forearm to the carpometacarpal joints containing the median nerve and ulnar nerve) were studied. The exclusion criteria for healthy volunteers included general contraindications for MRI, a history of wrist trauma or surgery, and the presence of rheumatoid arthritis or space-occupying lesions at the wrist. In order to explore clinical applications of these methods, we also followed up with 6 patients who had nerve laceration at the wrist region, performing preliminary DTI scans and post-processing (3 females and 3 males; aged 12 - 45 years; 2 patients had both median nerve and ulnar nerve transection injury, and 2 patients each had median nerve or ulnar nerve transection injury; follow-up period was 4 - 24 months).
3.2. MRI Protocol
MR images were acquired with a Signa HDxt 3.0T MRI scanner (general electric, Milwaukee, WI) by using an 8-channel wrist coil. The maximum field gradient amplitude of the MRI system was 40 mT/m, with a slew rate of 150 T/m/s.
During the scan session, the coil was positioned at the center of the magnet bore. Although this positioning caused slight discomfort for the subject, the quality of the scan images was significantly better than those obtained when the coil was on the right or left side. The subject’s upper extremity was positioned to the coil and was immobilized with cushions, sandbags, and bandages. The position of the subject in the scanner was supine (feet first, hand up).
DTI was performed by using spin-echo echo planar imaging (SE-EPI) (TR = 8000 ms; TE = 92.1 ms; FA = 90°) with 28 transversal slices of 2.6 mm thickness with no gap between the slices. A rectangular FOV of 120 × 120 mm2 with a scan matrix of 96 × 96, a SENSE factor of 2.0, and reconstruction at 256× 256 resulted in an in-plane resolution of 0.47 × 0.47 mm2. The number of excitation (NEX) was 4. The frequency encoding direction was left-right. Diffusion weighting with a b value of 1000 s/mm2 was applied in 6 and 25 encoding directions (named DTI6 and DTI25, respectively). In addition to the diffusion-weighted images, a single reference image without diffusion weighting (b = 0 s/mm2) was acquired. For anatomical reference, a T1-weighted fast spin echo image (TR = 320 ms; TE = 14.4 ms; FA = 90°; ETL = 2, thickness = 3 mm, gap = 1 mm, FOV = 120 × 120 mm2, NEX = 2) was acquired. The scanning times were as follows: DTI6, 3 minutes and 52 seconds; DTI25, 14 minutes; and T1-weighted fast spin echo imaging, 2 minutes and 58 seconds. The total scan time was about 24 minutes.
3.3. Post-Processing
By looking up the gradient tabulation of the DTI scan, the most appropriate direction for VR reconstruction of single-direction and SUSHI post-processing can be selected. The gradient tabulation of DTI25 is provided in Table 1, in which the X-axis represents the AP direction, the Y-axis represents the left-right direction, and the Z-axis represents the SI direction. When the X value is close to 1 and the Y and Z values are close to 0, it can be regarded as the diffusion direction of AP. Direction 1 has the coordinates (1, 0, 0) representing the AP direction. When Y is close to 1 and X and Z are close to 0, the diffusion direction can be regarded as left-right. Direction 8 has the coordinates (-0.162, 0.987, 0) that are closest to the left-right direction. When Z is close to 1 and X and Y are close to 0, the diffusion direction can be regarded as SI. Direction 18 has the coordinates (0.207, -0.076, -0.975) and Direction 25 has the coordinates (-0.040, 0.318, -0.947); both are close to the SI direction, but Direction 25 deviates much more from the X-axis. Therefore, according to the research of Skorpil et al. (6), the most suitable choice for single-direction VR reconstruction is direction 1. According to the research of Takahara et al. (8), the most suitable choice for SUSHI is Direction 1 with the subtraction of direction 25.
The gradient tabulation of DTI6 is shown in Table 2, in which the X-axis represents the AP direction, the Y-axis represents the left-right direction, and the Z-axis represents the SI direction. According to the method mentioned above, the most suitable choice for single-direction VR reconstruction is direction 1, and the most suitable choice for SUSHI is Direction 1 with the subtraction of direction 3. The relationships of the X, Y, and Z axes and the directions selected in the gradient tabulations with a wrist are indicated in Figure 1.
Subtraction post-processing was performed by using the Add/Sub software in GE MR workstation (advantage workstation 4.5). After subtraction, a new series of images was generated. In addition, the raw data of patients with nerve laceration was transferred to the GE Workstation for post-processing of fiber tractography and measurement of the FA and ADC values.
All MR data and the newly generated series after subtraction were imported into Voxar 3D Workstation 5.1 (Toshiba) for VR reconstruction of single-direction (AP direction) images and SUSHI. After VR reconstruction, 15 rotating images along 3 axes were captured. In order to display the nerve better, the background noise had to be removed manually. (This is described in a subsequent section.)
Two radiologists with more than 20 years of experience in radiology worked together to analyze and evaluate the 3D nerve image quality, noise level, and degree of noise-removal difficulty of the 20 wrists. The quality of the median and ulnar nerve images was evaluated based on complete/incomplete nerve display and the signal intensity of the nerves. We created a custom evaluation scale, with scores from 1 to 4 as follows: 1, incomplete nerve display; 2, complete nerve display with moderate nerve signal intensity; 3, complete nerve display with good nerve signal intensity; and 4, complete nerve display with excellent nerve signal intensity and excellent contrast with the surrounding tissue.
The noise level was evaluated based on the severity and distribution of noise. We created a custom evaluation scale, with scores from 0 to 4 as follows: 0, the nerves are mixed with noise, and they cannot be detected at all; 1, the noise is heavy and distributed widely, and the reader cannot obtain useful nerve information unless the noise is removed; 2, the noise is slightly heavy with a concentrated distribution, obscuring the nerve display from a particular viewing angle; 3, the noise is moderate and does not significantly affect nerve observation if it is not removed; and 4, the noise is mild and does not affect nerve observation.
The noise was manually removed by using the region button for noise selection with subsequent removal in 3D segmentation color volume view with Voxar 3D workstation 5.1 software. Regarding the degree of noise-removal difficulty, we created a custom evaluation scale, with scores from 1 to 4 as follows: 1, the noise cannot be selected separately from the nerves for removal by region selection because it is connected with the nerve; 2, part of the noise cannot be completely removed because it is connected with the nerve, whereas other parts of the noise can be regionally selected and removed by adjusting the window width and level for multiple procedures; 3, all noise can be completely removed via regional selection and removal by adjusting the window width and level for multiple procedures because it is not connected with the nerve; and 4, the noise is mild, is not connected with the nerve, and can be regionally selected and removed overall in a single procedure.
| Direction No. | X | Y | Z |
|---|---|---|---|
| 0 | 0.000 | 0.000 | 0.000 |
| 1 | 1.000 | 0.000 | 0.000 |
| 2 | 0.849 | 0.528 | 0.000 |
| 3 | -0.108 | 0.565 | 0.818 |
| 4 | 0.884 | -0.345 | -0.315 |
| 5 | -0.003 | -0.736 | 0.667 |
| 6 | -0.868 | -0.238 | 0.436 |
| 7 | 0.799 | 0.370 | 0.475 |
| 8 | -0.162 | 0.987 | 0.000 |
| 9 | 0.866 | -0.129 | 0.438 |
| 10 | -0.212 | -0.936 | 0.281 |
| 11 | 0.068 | -0.892 | -0.446 |
| 12 | 0.550 | -0.544 | -0.634 |
| 13 | -0.435 | -0.422 | 0.795 |
| 14 | -0.599 | 0.780 | 0.182 |
| 15 | -0.525 | 0.030 | -0.851 |
| 16 | -0.600 | -0.688 | 0.409 |
| 17 | 0.653 | -0.060 | -0.755 |
| 18 | 0.207 | -0.076 | -0.975 |
| 19 | -0.413 | -0.699 | -0.584 |
| 20 | -0.436 | 0.822 | -0.366 |
| 21 | 0.462 | 0.874 | 0.148 |
| 22 | -0.503 | 0.488 | -0.713 |
| 23 | 0.824 | -0.530 | 0.202 |
| 24 | 0.297 | 0.349 | 0.889 |
| 25 | -0.040 | 0.318 | -0.947 |
Abbreviations: DTI, diffusion tensor imaging.
3.4. Statistical Analyses
The scores are expressed as medians with ranges because they were evaluated on ordinal scales. The scores were compared between VR reconstruction for single-direction images and SUSHI by using the Wilcoxon signed-rank test. Differences were considered significant when the p values were < 0.05. Statistical analysis was performed using IBM SPSS Statistics for Windows, Version 21.0 (IBM Corp, Armonk, NY, USA).
| Direction No. | X | Y | Z |
|---|---|---|---|
| 0 | 0.000 | 0.000 | 0.000 |
| 1 | 1.000 | 0.000 | 0.000 |
| 2 | 0.446 | 0.895 | 0.000 |
| 3 | 0.447 | 0.275 | 0.851 |
| 4 | 0.448 | -0.723 | -0.525 |
| 5 | 0.447 | -0.724 | 0.526 |
| 6 | -0.449 | -0.277 | 0.850 |
Abbreviations: DTI, diffusion tensor imaging.
4. Results
For the 20 wrists of the 10 young volunteers, in both DTI6 and DTI25, single-direction (AP, anterior-posterior direction) VR, volume rendering reconstruction showed the nerves (the median nerve, the superficial branch of the radial nerve, the ulnar nerve, and the dorsal, superficial, and deep branches of the ulnar nerve) clearly. The nerve signal intensity was excellent, but the noise was obvious. In DTI25, VR reconstruction for SUSHI showed the nerves clearly, and the nerve signal intensity was excellent. In DTI6, the signal intensity was lost after SUSHI post-processing in a portion of the ulnar nerves (7/20), which resulted in a significant difference in the nerve image quality scores between single-direction images and SUSHI. The majority of noise was removed after SUSHI post-processing, and the remnant noise became loose, was no longer connected with nerves, and could be removed more easily.
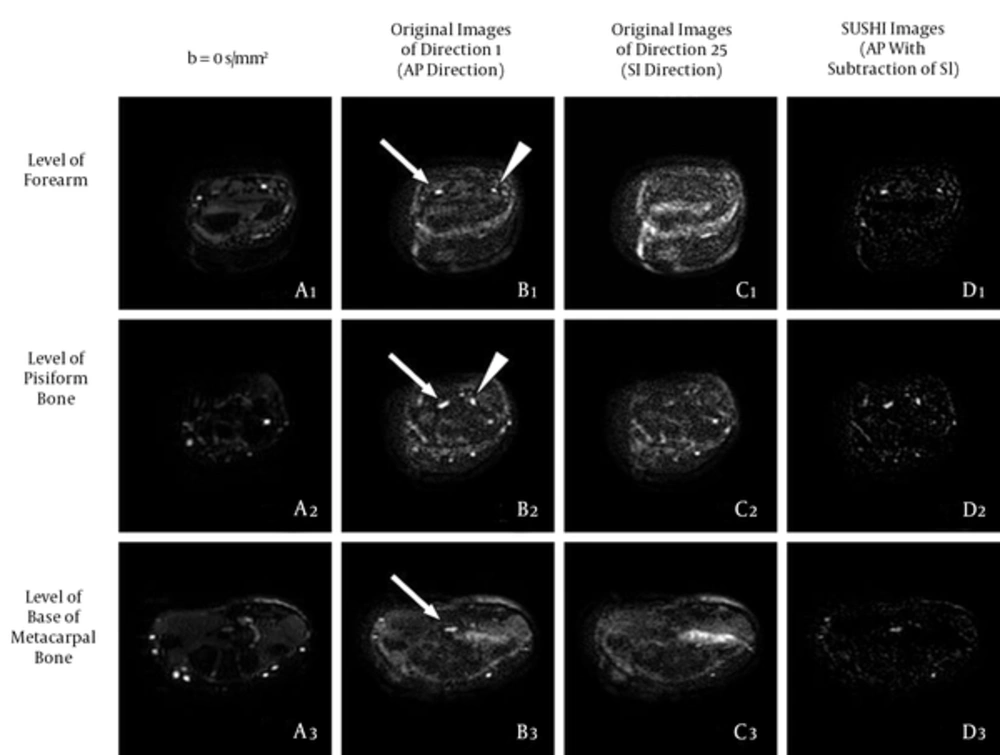
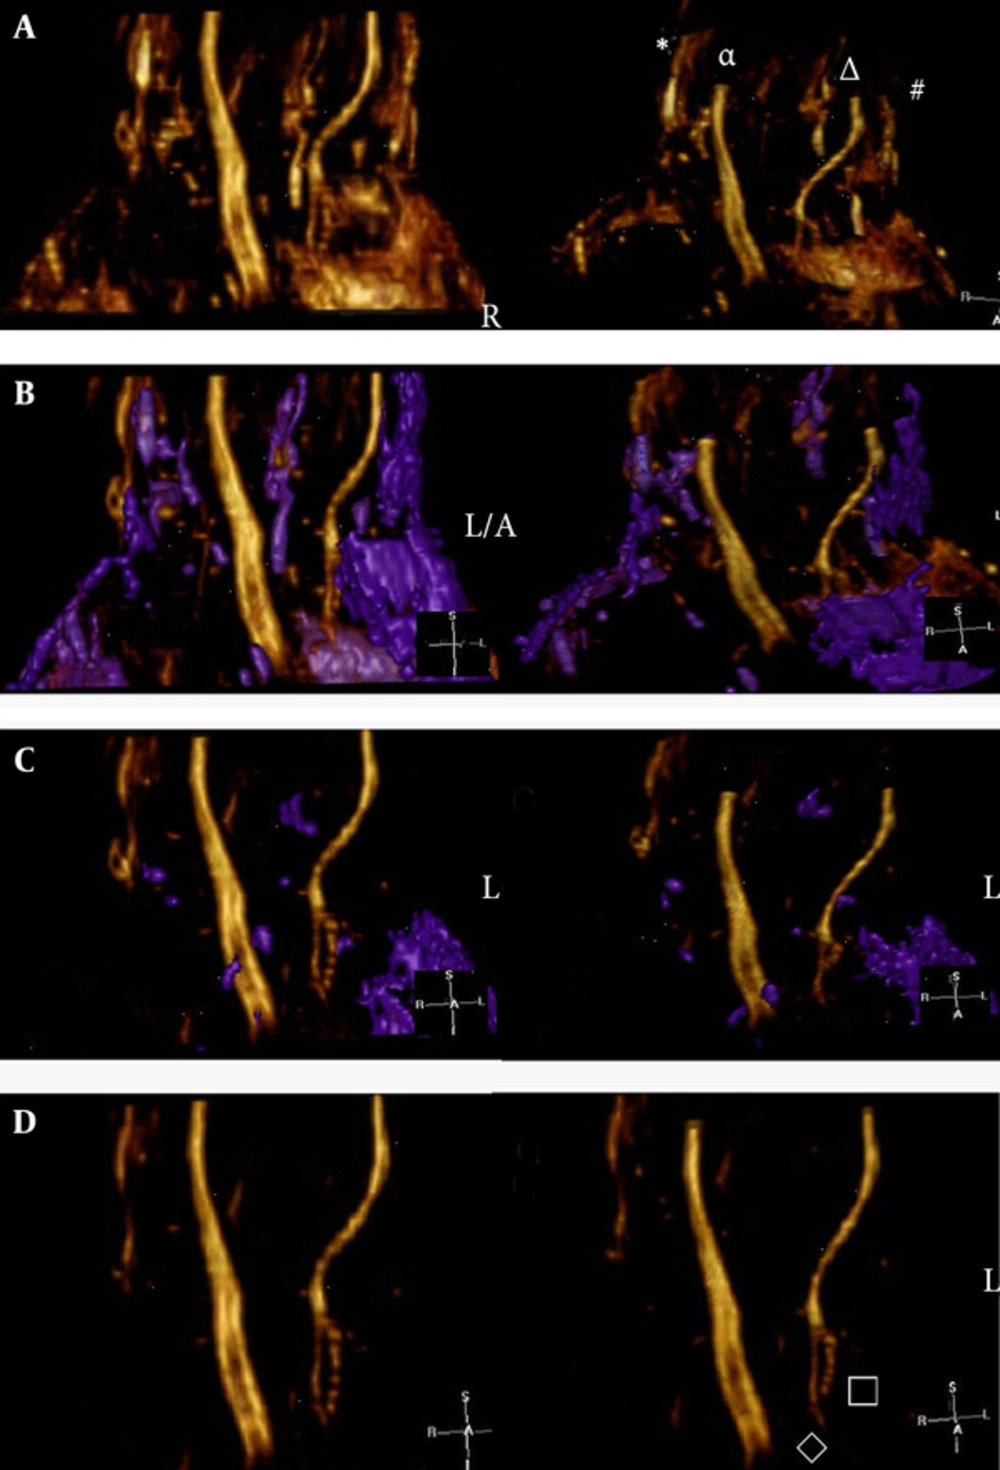
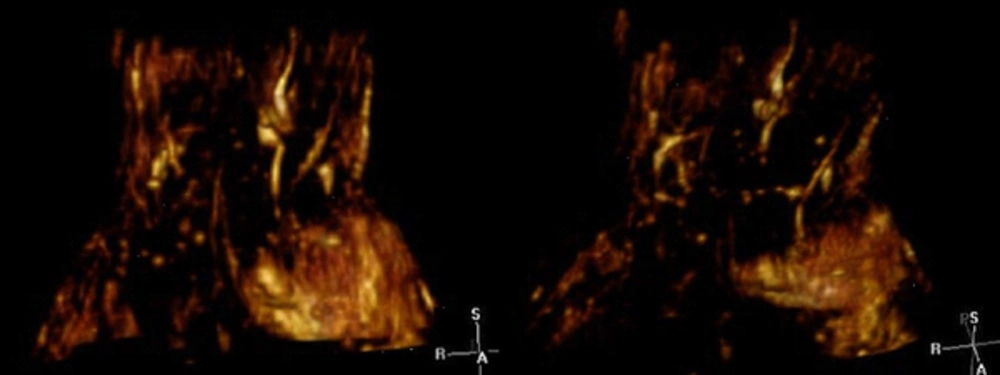
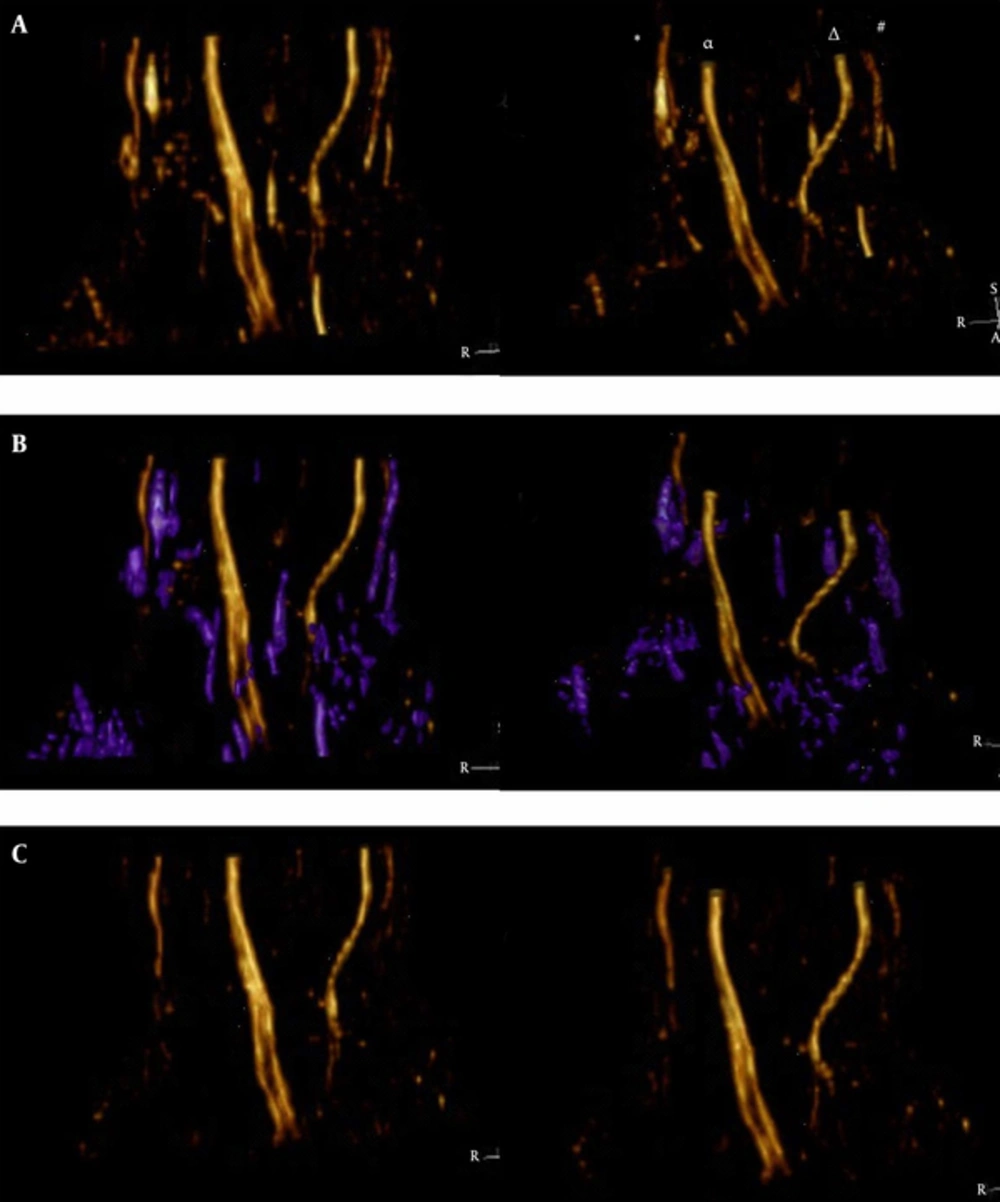
The original DTI25 images at all levels before and after SUSHI post-processing are shown in Figure 2. The effect of VR reconstruction for single-direction (AP direction) in DTI25 before and after denoising and denoising processing is shown in Figure 3. The effect of VR reconstruction for the SI direction in DTI25, in which only noise was present and the nerve was not revealed, is shown in Figure 4. The effect of VR reconstruction for SUSHI in DTI25 before and after denoising and denoising processing is shown in Figure 5.
The imaging quality scores of the median nerves and ulnar nerves are shown in Table 3. For the median nerve, in both DTI6 and DTI25, the scores were 4 (3 - 4) for single-direction images and 4 (2 - 4)/4 (3 - 4) for SUSHI, with no significant difference between them. For the ulnar nerve in DTI6, the scores were 3 (2 - 4) and 3 (1 - 4) for single-direction images and SUSHI, respectively. The differences between these values were significant (P = 0.039). For the ulnar nerve in DTI25, the scores were 4 (2 - 4) for single-direction images and 4 (1 - 4) for SUSHI, respectively, with no significant differences between them.
The scores for noise level and degree of noise-removal difficulty are shown in Table 4. The noise level scores of SUSHI (median, 3) were better than those of single-direction images (median, 2) by 1 point, with a significant difference between these scores (P < 0.05). The noise-removing difficulty scores were also better for SUSHI (median, 4) than for single-direction (median, 3) for 1 point, with a significant difference between these scores (P < 0.05).
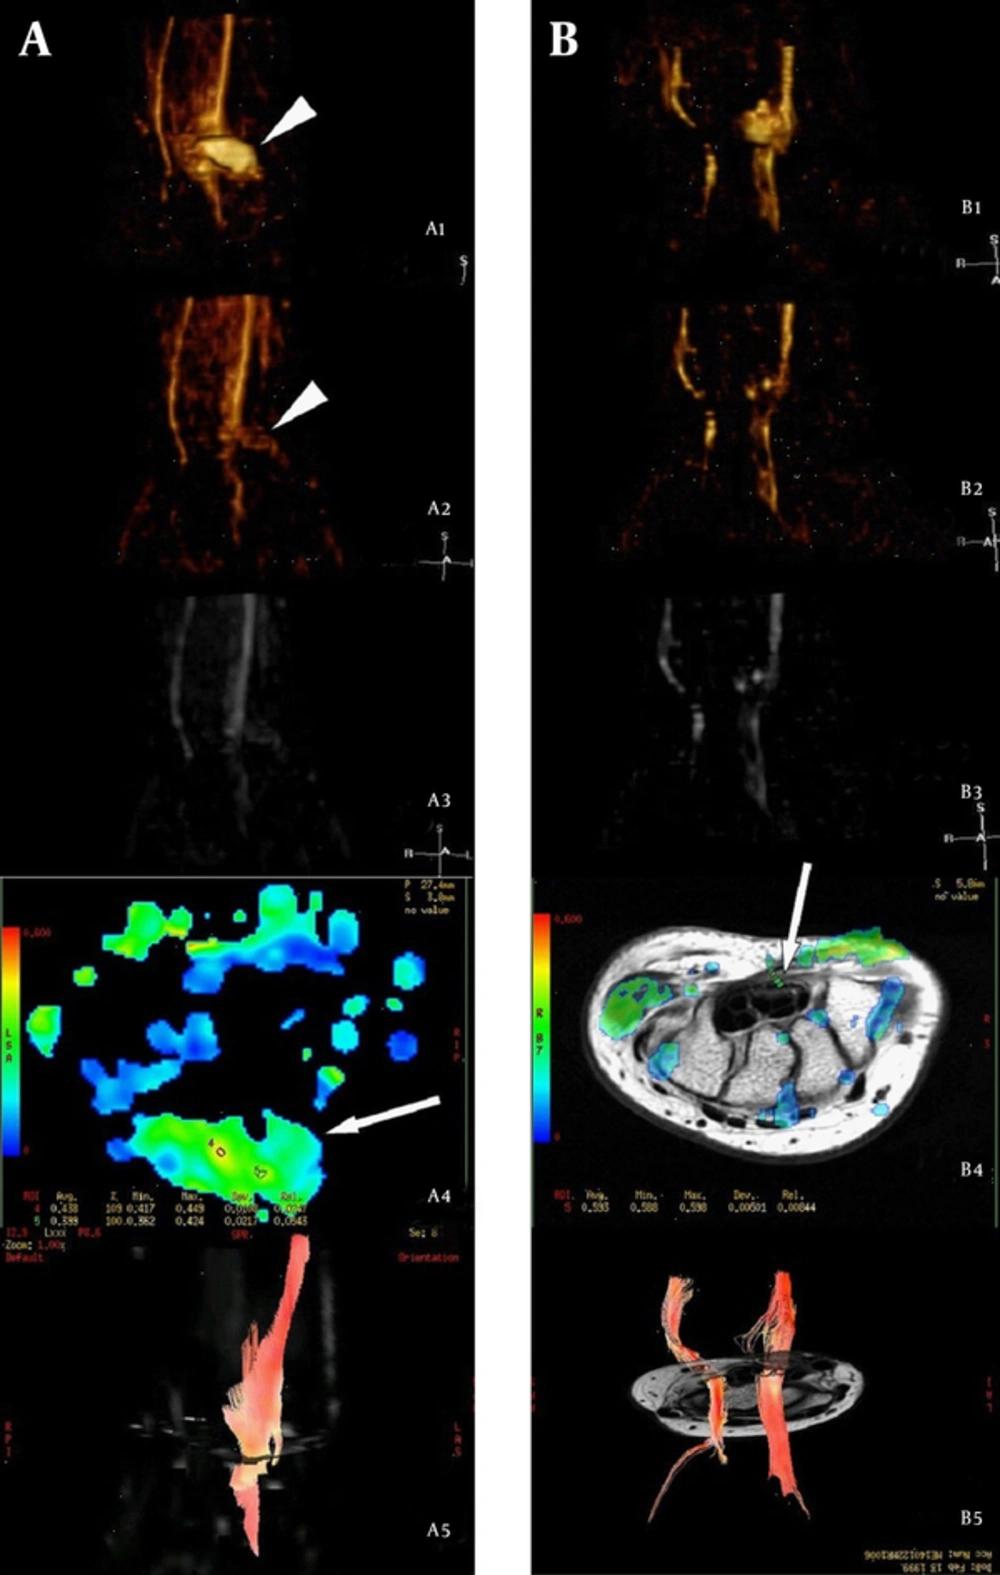
After post-processing the raw data of 6 patients with nerve laceration at the wrist region, we found that the nerves were intumescent at the transection level in all patients. VR reconstruction for SUSHI revealed that the changes in the local and distal parts of the nerve occurred in different periods, which was in accordance with the order of nerve regeneration. The manifestations in a subject with median nerve laceration, followed up at 3 months and 18 months after repair, are shown in Figure 6.
The original DTI25 images at all levels before and after SUSHI post-processing. Column A: Series of b = 0 s/mm2 images for providing the anatomical reference; these were similar to the T2-weighted images. Column B: series of original images in the AP direction, in which the nerves showed high signal intensity; most of the bone and vascular signals were suppressed, but some noise was apparent. Column C, Series of original images in the SI direction, in which only noise was apparent; the scope of the noise was similar to that of Column B, column D: Series of original images after SUSHI post-processing (AP direction with the subtraction of the SI direction), in which the nerve kept a high signal; most of the noise was subtracted, and the remnant noise was not connected with the nerve. Arrows, median nerve; arrowheads, ulnar nerve (AP, anterior-posterior; DTI, diffusion tensor imaging; SI, superior-inferior; SUSHI, suppression of heavily isotropic objects).
The effect of single-direction (AP direction) VR reconstruction by using the Voxar workstation software. A, Before denoising, the nerves were displayed clearly but were surrounded by noise. The symbols in the illustration are indicative as follows: (*) is the superficial branch of the radial nerve, (α) is the median nerve, (Δ) is the ulnar nerve, and (#) is the dorsal branch of the ulnar nerve. B, Denoising process. The noise region (i.e., the purple area) was selected and removed. The noise could be selected and removed completely by adjusting the window width and level over the course of multiple procedures. Note: In this example, the dorsal branch of the ulnar nerve was connected with noise; these were selected together for subsequent removal. C, Second denoising procedure. D, After denoising, the median nerve, ulnar nerve, and superficial branch of the radial nerve were clearly visible; moreover, the deep branch (□) and superficial branch (◊) of the ulnar nerve were clearly visible (AP, anterior-posterior; VR, volume rendering).
The effect of VR rfigure 5ction for SUSHI using Voxar workstation software. A, The nerves were displayed clearly before denoising, and the noise was lower than in Figure 3. The symbols are indicative as follows: (*) is the superficial branch of the radial nerve, (α) is the median nerve, (Δ) is the ulnar nerve, and (#) is the dorsal branch of the ulnar nerve. B, Denoising process. The noise region (i.e., the purple area) was selected and was removed easily in a single procedure. Note: In this example, the dorsal branch of the ulnar nerve was not connected with noise and was preserved. C, After denoising, the median nerve, ulnar nerve, superficial branch of the radial nerve, and the dorsal, deep, and superficial branches of the ulnar nerve were clearly shown (VR, volume rendering; SUSHI, suppression of heavily isotropic objects)
Manifestations in a subject with median nerve laceration (12-year-old female) followed up at 3 months (column A) and 18 months (column B) after repair. A1 and B1: VR reconstruction for the AP single-direction, in which the median nerve appeared intumescent with scar formation at the transection level (arrowheads). The regenerated nerve within the scar seemed undetectable. A2, B2, A3 and B3: VR reconstruction and MIP reconstruction of SUSHI, respectively, which showed that the scar (arrowheads) had been subtracted because of low anisotropy. By comparing A2 with B2, we found that the diameter of the injured nerve had increased and the signal was enhanced at the level distal to nerve injury at 18 months compared to 3 months post-injury, which were in accordance with the order of nerve regeneration. A4: FA map at the level of transection 3 months after repair, which showed that the FA value was unevenly distributed within the scar (arrows), and the highest FA value was lower than the normal value. B4: FA map at the level of the hamate bone 18 months after repair; the FA value had recovered to normal in a partial area, but the resumptive area (arrows) was smaller than normal, suggesting that nerve regeneration had not restored the nerves to their pre-injury status. A5 and B5: Fiber-tracking images, showing that more prolonged fibers were traced and the signal returned to normal at a later follow up; this was in line with ongoing nerve regeneration (VR, volume rendering; AP, anterior-posterior; MIP, maximum intensity projection; SUSHI, suppression of heavily isotropic objects; FA, fractional anisotropy).
| Single-Direction | SUSHI | P Value | |
|---|---|---|---|
| Median-DTI6 | 4 (3 - 4) | 4 (2 - 4) | 0.157 |
| Median-DTI25 | 4 (3 - 4) | 4 (3 - 4) | 1.000 |
| Ulnar-DTI6 | 3 (2 - 4) | 3 (1 - 4) | 0.039 |
| Ulnar-DTI25 | 4 (2 - 4) | 4 (1 - 4) | 0.218 |
Abbreviations: SUSHI, suppression of heavily isotropic objects; DTI, diffusion tensor imaging.
adata are mentioned as Median (Range).
| Scores | Noise Level | Noise-Removal Difficulty | ||||
|---|---|---|---|---|---|---|
| Single-direction | SUSHI | P Value | Single-direction | SUSHI | P Value | |
| DTI6 | 2 (1 - 4) | 3 (2 - 4) | < 0.001 | 3 (2 - 4) | 4 (2 - 4) | 0.002 |
| DTI25 | 2 (2 - 4) | 3 (2 - 4) | 0.005 | 3 (2 - 4) | 4 (3 - 4) | 0.002 |
Abbreviations: SUSHI, suppression of heavily isotropic objects; DTI, diffusion tensor imaging.
aThe data are mentioned as Median (Range).
5. Discussion
DTI with fiber tracking, the first method utilized for 3D viewing of nerves, was originally used in the central nervous system (9). In 2004, Skorpil et al. (10) demonstrated that the peripheral nerves (the sciatic nerve, tested in 3 healthy volunteers) could be imaged in vivo by using DTI with fiber tracking. Currently, this technique is mostly used to evaluate the status of the median nerves in CTS (3), to provide non-invasive imaging of peripheral nerve regeneration (11), and to characterize the structure of the brachial plexus (12, 13). However, DTI with fiber tracking post-processing has disadvantages. For example, nerves with small diameters are difficult to track because the seed setting is unavailable.
SUSHI can be regarded as a better denoising method than the unidirectional DW-MRN earlier introduced by Takahara et al. (14). In this study, we made a novel attempt to use SUSHI for DTI data as a supplement for the method introduced by Skorpil et al. (6) We found that the nerves can be displayed clearly in single-direction reconstruction, but the noise of isotropic objects was the main interference for nerve visualization (Figure 3). SUSHI has 2 main advantages for dealing with DTI data. First, this method allows the majority of noise to be removed automatically based on the histological characteristics of the sample as opposed to subjective manual removal. Second, SUSHI would likely work for noise connected with a nerve, which is difficult to remove manually (Figure 6A). In addition, Takahara introduced the unidirectional diffusion-weighted scan method by using 2 processes (AP and SI), whereas we acquired the DTI data within 1 scan process. Besides VR reconstruction for single-direction images and SUSHI, the FA and ADC value and fiber-tracking imaging can be acquired based on the raw DTI data, which are believed to be sensitive measures of the microstructural integrity of nerves (4).
Based on the evaluation results, the image qualities of the median nerves were equivalent between single-direction images and SUSHI in both DTI6 and DTI25. However, the image qualities of the ulnar nerves were quite different between single-direction images and SUSHI in DTI6. Further, no significant difference in image quality was observed between single-direction images and SUSHI for the ulnar nerve in DTI25. There are two apparently plausible possibilities to explain this phenomenon. First, at the wrist region, the course of the median nerve is along the longitudinal axis, but the course of the ulnar nerve from the forearm to palm has a radial deviation. This radial deviation may have been obvious in some subjects, in which case this part of the nerve would have been subtracted because it would be displayed in the SI direction. Second, by checking the gradient tabulation of DTI6 and DTI25 (Tables 1 and 2), we can see that the SI direction in DTI25 (Direction 25) is much more deviated in the X-axis than the SI direction in DTI6 (Direction 3). This would reduce the signal attenuation after SUSHI, so the images of the ulnar nerves were not significantly affected for SUSHI of DTI25.
In the comparison of the noise evaluation scores, the SUSHI score was obviously higher than that of single-direction images (AP direction), confirming the feasibility of this denoising method. In VR reconstruction for SUSHI, the majority of noise was reduced, and the residual noise became loose and more easily removed by region selection in a single procedure. By using this method, even the tiny branches of the nerve which originally connected with noise can be reserved (Figure 5C).
The DTI data of 6 cases of nerve laceration at the wrist region showed that the nerves were intumescent with scar formation at the transection level. Therefore, we could not determine the actual regeneration status of the repaired nerve inside of the scar. During SUSHI post-processing, the scar tissue was subtracted because of the lack of anisotropy, and the remainder may have been the regenerated part of the nerves with high anisotropy. Fiber tracking may be a useful tool for evaluating nerve regeneration after repair (15). The status of nerve regeneration may be inferred through a combination of the fiber-tracking image, FA value, and the morphology and signal intensity of the nerve in the reconstruction of SUSHI at different postoperative periods.
The present study had several limitations. First, the small sample size (6 wrists with nerve laceration) is not enough to fully evaluate the feasibility of SUSHI processing. The difference between the applications of fiber tracking, single-direction VR reconstruction and SUSHI should be studied further. Second, the manual denoising process was carried out by using the Voxar Workstation software based on its region selection function. When different software is used, the score for the degree of noise-removal difficulty may be different from that found by this study.
In conclusion, excellent 3D displays of the peripheral nerves in the wrist region can be achieved by VR reconstruction, for both single-direction images and SUSHI, using DTI25 raw data. SUSHI post-processing can automatically reduce the majority of noise for isotropic objects and, therefore, it is a useful tool for denoising.

