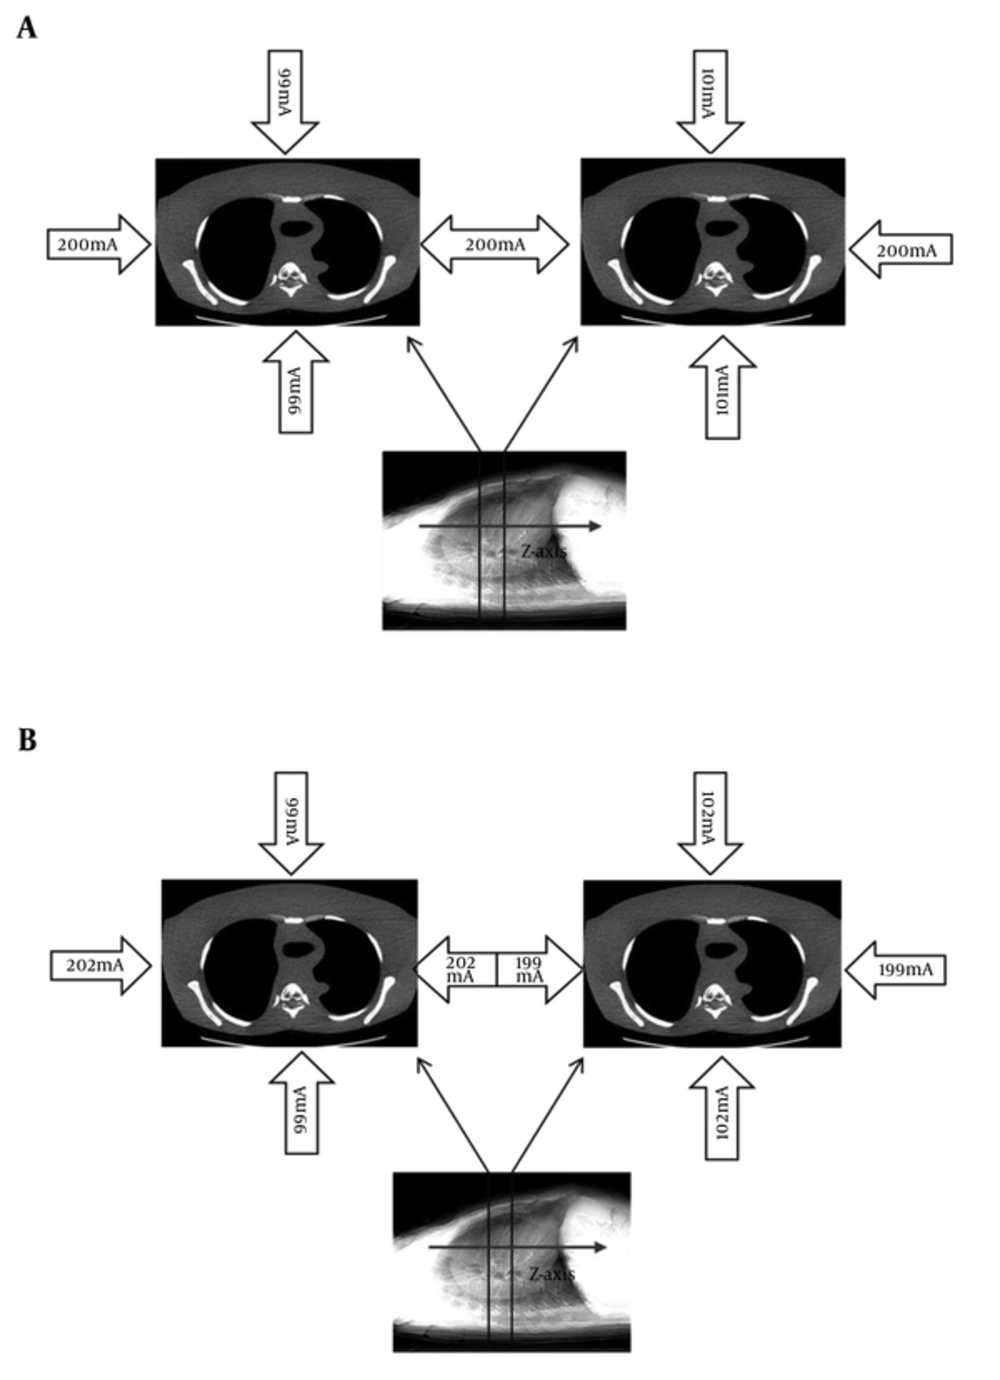
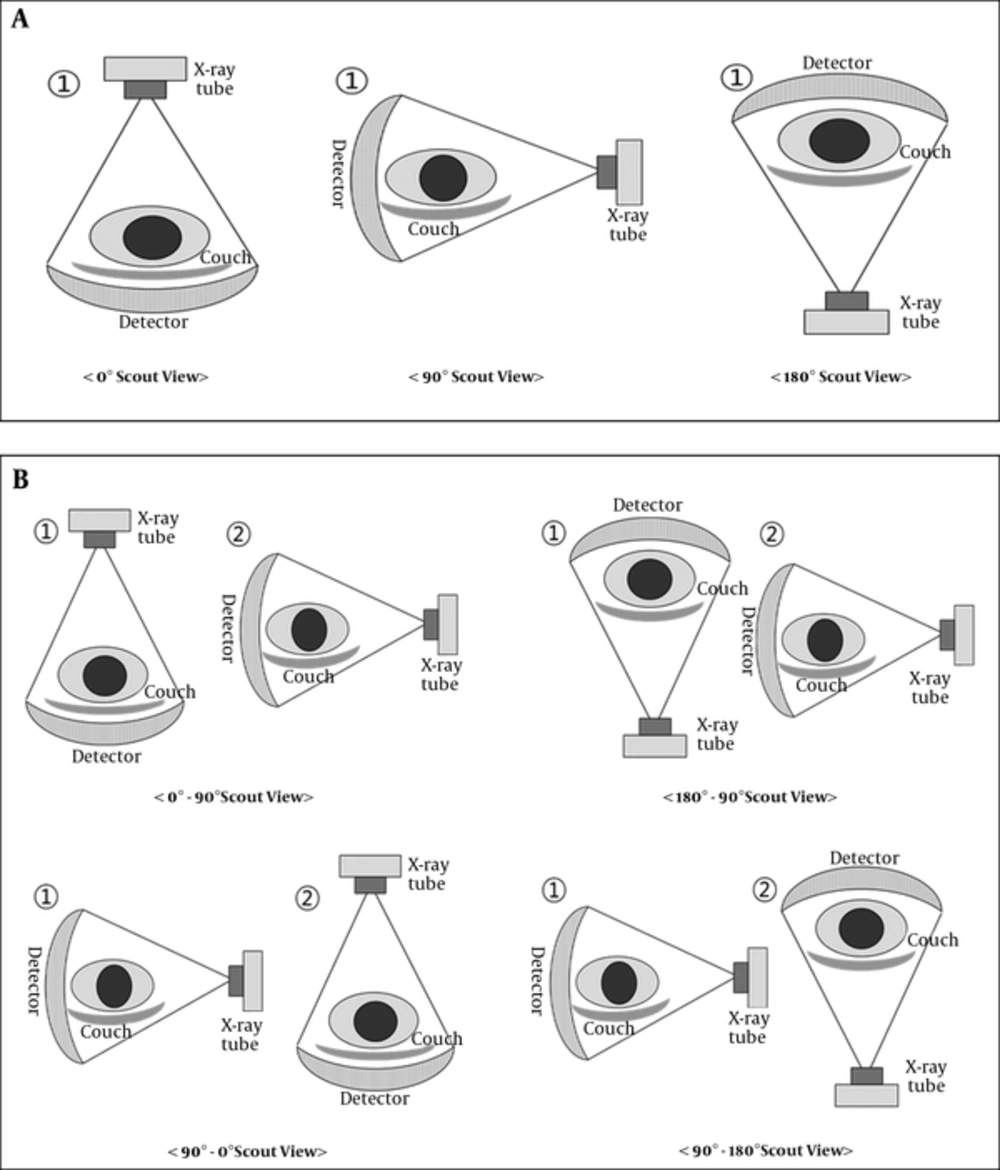
The AEC technique uses information obtained from two-scout scans acquired in the AP and lateral views. Using this information, sinusoidal modulation of the tube current is achieved during 360° rotation in order to equalize X-ray absorption (
9,
13). Therefore, rotational or angular dose modulation involves varying the tube current to equalize the photon flux to the detector as the X-ray tube rotates about the patient (e.g., from the AP position to the lateral position). The radiation doses obtained using different scout views were verified using the CTDI head phantom. It was found that the attenuation rate in the CT system was greater at the 180° position than it was at the 0° position; the dose in the AEC helical scan was based on this result, so the 180° scout view resulted in a dose higher than that yielded by the 0° scout view.
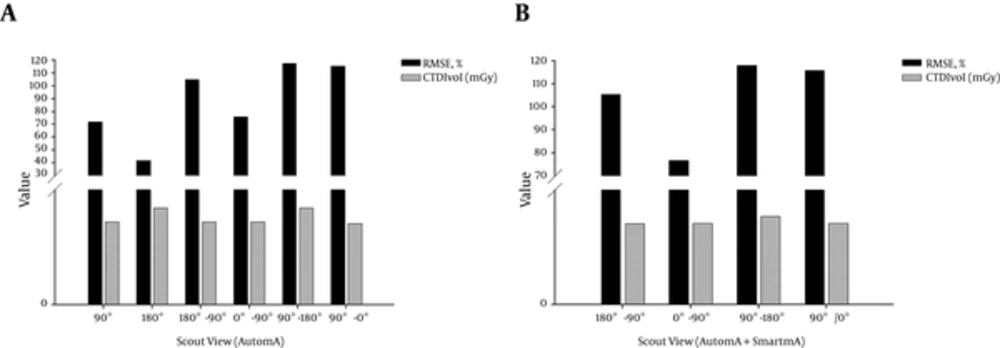
Table 2 shows the CTDIvol and RMSE values based on the reference 0° scout view and the RMSE/(10 - CTDIvol) ratios of the single scout views. The 180° scout view has CTDIvol and RMSE scores that are higher and lower, respectively than those of the 90° scout view. Additionally, the 180° scout view (RMSE/(10 - CTDIvol) = 8.44) has an RMSE/(10 – CTDIvol) ratio lower than that of the 90° scout view (RMSE/(10 - CTDIvol) = 12.64%). Furthermore, the 180° scout view yielded images of higher quality than the 90° scout view did, owing to the increased dose and reduced noise of the former view. Generally, the 90° scout views led to higher doses than the 0° scout views, most likely because lateral projections result in X-ray attenuation greater than that produced by projections (0°), particularly in the regions of the body, such as the shoulders and pelvis, that have more asymmetric oval shapes than does the head. The 180° scout view yielded X-ray attenuation greater than that of the 0° scout view, most likely due to the couch on which the patient was lying (
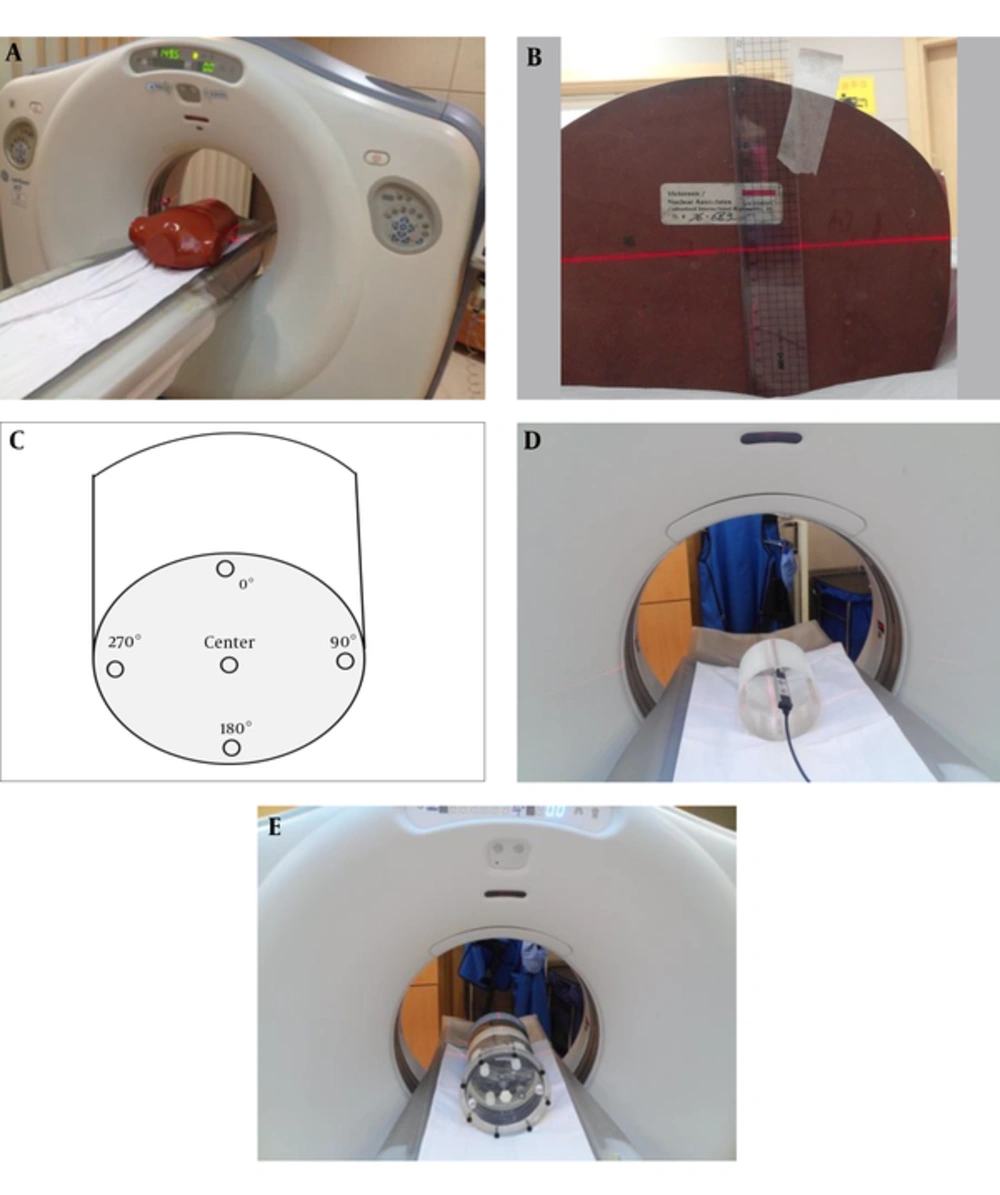
14). The same CT-scanning conditions used for the chest phantom were applied to the AAPM phantom, with the same CTDI (CTDIvol = 4.32 mGy) values (
Table 3). Consequently, no measurable dose differences between the scout views and the cylindrical object (phantom with circular type: AAPM phantom) were observed.
| AutomA |
|---|
| Scout View | 0° | 90° | 180° |
| CTDIvol (mGy) | 4.32 ± 0.01 | 4.32 ± 0.01 | 4.32 ± 0.01 |
| P Repeated 3 Times | 0.99 |
aValues are means ± standard deviations.
The scout-view-based angular modulation technique (SmartScan, GE Power, U.S.A.) provides a means for estimating tube current for different projection angles over 360° rotations around the object being scanned (
Table 2) (
7). Thus, the technique modulates radiation doses based on information (shape and attenuation) obtained from a single scout view (latter scout view). In
Table 2, the two-scout views revealed that the final dose depended, in each case, on the latter view. For instance, when the latter of the two-scout views was 90°, both the 0° - 90° and 180° - 90° scout views resulted in the same dose. Therefore, the latter scout view determined the dose.
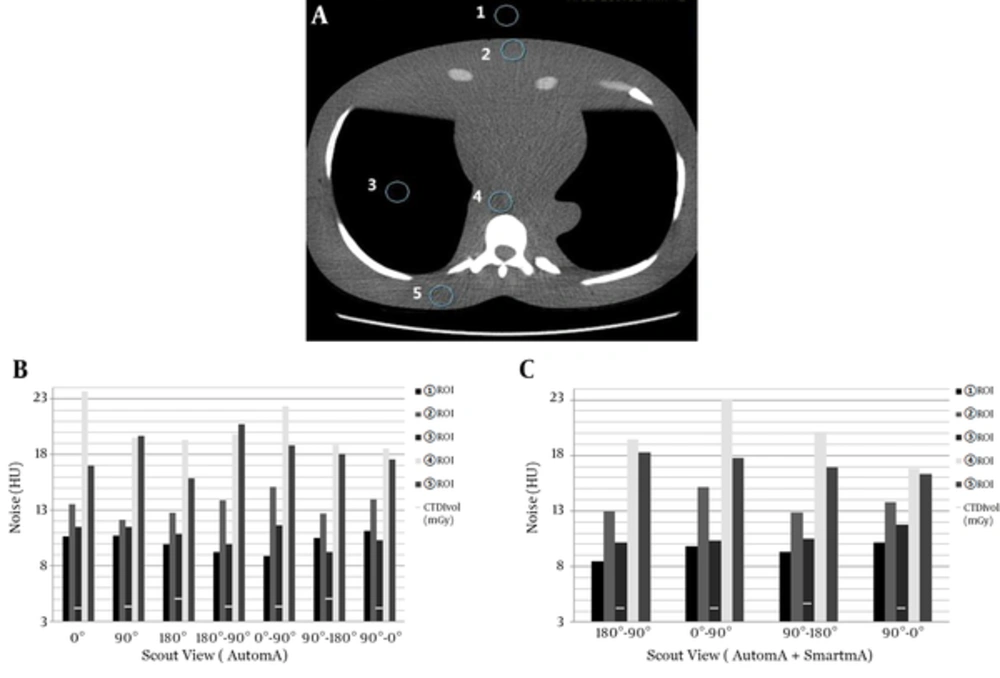
Our results indicate that higher CTDIs in single scout view applications resulted in smaller corresponding noise values in all five of the ROIs (
Figure 5B). In contrast, the two-scout views tended to exhibit different noise values in the five ROIs, which depended on the scout view rather than the CTDI. Despite having equivalent CTDI values, the combinations of 180° - 90° and 0° - 90° scout views, which represented AP views, resulted in different noise values in ROIs 2 and 5, respectively. These results are likely due to the distance between the entrance and exit points of the X-rays on the anthropomorphic chest phantom, which could cause variation in the dose reduction and might lead to dose differences between the front and back sides during actual chest CT scans.
Among the two-scout views, the lowest dose reduction resulted from using the 90° - 0° scout view, while the lowest and highest dose-to-CT-image-quality ratios, 13.32 and 23.64, resulted from using the 0° - 90° and 90° - 180° views, respectively. Thus, the 90° - 0° scout view resulted in the lowest dose, irrespective of the image quality, whereas the 0°–90° scout view achieved a significant dose reduction while also maintaining high image quality. Our literature review revealed that the dose variations between the 0° and 180° scout views were not large enough to significantly affect CT scans in previous studies (
7). This behavior was likely observed because the 180° scout view might lead to doses slightly higher than those resulting from using the 0° scout view, but it would not reduce the noise level. In the current study, however, both the 0° and 180° scout views led to significant 20% gaps in the CTDI. With the 0° scout view as a reference, the effective dose also varied from 0.06 mSv to 0.51 mSv, depending on the scout view (
Table 2). This radiation dose variation could be considered significant, even the chest CT scan length is relatively short (about 30 cm); in the United States, the effective doses for chest X-rays (frontal and lateral chest radiography) and mammography series are generally about 0.065 mSv and 0.42 mSv, respectively (
4).
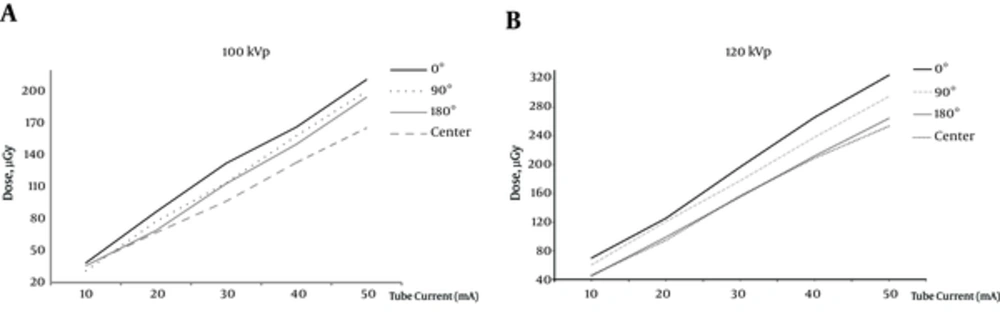
In addition, each scout view and angular position at the cavity of the CTDI head phantom yielded a similar result (
Figure 6,
Table 2). The smallest dose was found in the central cavity of the CTDI head phantom, with increasing doses found in the 180°, 90°, and 0° cavities, for both levels of tube voltage 100 kVp and 120 kVp. CTDI is a unit related to the energy of the diagnostic X-ray CT scans performed on the patient. In this study, with increasing mA, the radiation dose was found to be largest in the 0° cavity of the CTDI head phantom using an ionization chamber, with decreasing values in the 180°, 90°, and central cavities (
Figure 6). However, at a voltage of 120 kVp, there was greater variation in the radiation dose in the central cavity of the CTDI head phantom. Thus, when the tube voltage is lowered from 120 kVp to 100 kVp, the radiation dose can be decreased by 53.16% in the 0° cavity and by 63.18% in the central cavity.
In some clinical cases, scans to obtain images are made along only a single axis, rather than both the x- and y-axes of patients (AP and lateral scout views), during the scout scanning that precedes a helical CT scan. This using only single scout view can lead to inappropriate CT scanning and dose reduction failure using SmartmA. As the frontal scout view alone, without information from lateral scout views, failed to achieve a suitable noise index at the center of the y-axis of the patient in CT scanning, two-scout views are necessary to obtain quality CT images while limiting patient radiation exposure to a proper dose (
9,
15).
Based on the results of this study, scout angle order could be another determinant of the dose and image quality of CT scanning; therefore it is necessary to select and to apply an optimum scout angle order such as 0° - 90°. It is also necessary to use the proper radiation dose, and the optimum combination of scout views to achieve “improved CT image quality with the least dose” (ALARA principle) (
12,
16).
A limitation of the current study was that only tests conducted in the GE CT unit led to variable results. This variation was most likely due to the properties of the unit that could affect CT studies involving scouts. The CTDI results did not differ significantly between using AutomA alone and using both AutomA and SmartmA, likely because this test was conducted in a single phantom rather than in diverse human body types (
8,
9,
14). In general, AEC adjusts the tube current to the regional body anatomy for the purpose of reducing radiation doses in projection angles. These techniques, along with the information computed from either scout views or in real time, are classified as Smart-scan in GE Healthcare systems, CARE Dose in Siemens systems, or DOM in Philips systems.
Although available AEC techniques adjust the tube current to obtain identical image quality, the technique (GE Healthcare systems), based on information computed from the scout view, has some limitations. Compared with images obtained in real time, Smart-scan images can vary greatly, depending on the method of obtaining images from the scout view and the information obtained from the scout view. Therefore, adoption of the scout view can vary greatly, effect both image quality and radiation dose.
AEC techniques also increase radiation doses for dense patients and very thin patients. Thus, in these cases, AEC techniques require necessary modifications of mA ranges to avoid overexposure.
While the majority of studies on the AEC techniques reduce the radiation dose from the tube current modulated in the x-, y-, and z planes, based on morphology or radiation attenuation, few studies focus on how the selection of scout views affects the exposure dose and noise values in CT images. We conclude that CT scan users should take into account appropriate managing of the scout views in order to obtain the best CT image quality while reducing the radiation dose and adapting to the noise index of the selected configuration.