


1. Background
Chronic kidney disease (CKD) is a major public health problem. Earlier stages of CKD can be detected through routine laboratory assessments including measurement of serum creatinine and urinalysis (1). The estimated glomerular filtration rate (eGFR) can be calculated by serum creatinine, weight, and ethnicity (1). Radiographic studies are additional helpful tools in identifying renal parenchymal diseases, particularly pertaining to the function of each kidney (2-4).
Diffusion weighted (DW) MRI is a technique to evaluate the diffusion process of water molecules, which is dependent on the cellular environment. Quantitative values of diffusion can be measured from diffusion coefficient images and are called apparent diffusion coefficient (ADC) values. These combine the effect of capillary perfusion and water diffusion. DW MRI in kidneys is suitable due to the high blood flow and water filtration. The DW MRI in renal diseases is an evolving field and previous investigators have attempted to evaluate its utility in the characterization of focal renal lesions, renal parenchymal disease, and renal infections (5).
Renal dysfunction is associated with significantly lower ADC values in the cortex and medulla than in those of healthy subjects (6, 7). An ADC cutoff point at lower than 2.035 (× 10-3 mm2/s) indicated renal dysfunction, while an ADC over 2.452 (× 10-3 mm2/s) is found in cases of normal renal function. There are several ADC-level cutoff points that indicate renal dysfunction (8, 9).
2. Objectives
Other than the role of indicating renal function of the ADC level, this study aimed to evaluate whether or not ADC values can predict eGFR levels. If so, the predictive formula will be created to show the association of ADC and eGFR.
3. Patients and Methods
3.1. Study Population
This was a retrospective study. We reviewed all adult patients who underwent upper abdomen MRI and magnetic resonance cholangiopancreatography (MRCP) protocol from January 2014 to October 2014.
Patients whose kidneys were unsuitable for ADC measurement, such as those with multiple cystic lesions or that were very small, were excluded. Clinical factors including eGFR were traced back in all eligible patients.
The study protocol was approved by the institutional review board of ethical issues, Khon Kaen University.
3.2. Imaging Techniques
Two hundred and sixty patients were imaged using a 3T MR scanner (Phillips Achieva; Philips, Best, the Netherlands) and a 1.5T MR scanner (MAGNETOM Aera; Siemens, Erlangen, Germany). Imaging was performed using a phased array body coil with the patient in supine position. The abdominal imaging protocol included True Fast Imaging and Steady Precession (True FISP) axial and coronal sequences, which served as localizer for planning further sequences. Following this, conventional MRI sequences, T1W axial (in and opposed phase) sequences and fat-suppressed (FS) T2W axial and coronal sequences were acquired. The following parameters were used for the echo planar image (EPI): two dimension diffusion weighted imaging (DWI) in three b values (0,150,800) trigger fat suppression (FS) or spectral attenuated inversion recovery (SPAIR) thickness 6 mm, 32 - 36 slices, field of view (FOV) 340 × 100 mm and 340 × 274 mm on 1.5T and 3T, respectively. Scan time was 3.34 minutes: matrix 124 × 137 repetition time (TR)/echo time (TE) = 1700/71 ms on axial DW images of 1.5T MR and 2.37 minutes, matrix 124 × 137 TR/TE = 250/53 ms with flip angle 90 degrees on 3T MR were performed. The ADC maps were automatically generated from the datasets of DW images using the operating console and ADC values were calculated.
3.3. Image Analysis
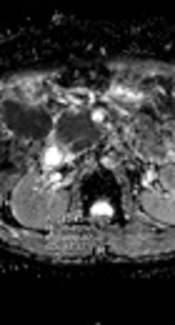
A workstation used in this study was produced by the Fujifilm Medical Systems, USA, Inc. Radiological analysis was performed by the same radiologist in all patients. A circular 1.0 cm2 region of interest (ROI) at the corticomedullary junction was used to collect the ADC values (Figure 1). For each kidney, one ROI was placed in the middle portion of the kidneys, which is less influenced by the perfusion effect. The measurement was performed to avoid the edges of the border of the kidney to exclude the effect of partial volume averaging.
 values in a 39-year-old man with hepatocellular carcinoma (HCC) at segment VI/VII showed the ADC values of 1.392 (x 10<sup>-3</sup> mm<sup>2</sup>/s) in the right kidney and 1.587 (x 10<sup>-3</sup> mm<sup>2</sup>/s) in the left kidney. The mean of ADC value is 1.489 (x 10<sup>-3</sup> mm<sup>2</sup>/s).")
The diffusion-weighted imaging and the apparent diffusion coefficient (ADC) values in a 39-year-old man with hepatocellular carcinoma (HCC) at segment VI/VII showed the ADC values of 1.392 (x 10-3 mm2/s) in the right kidney and 1.587 (x 10-3 mm2/s) in the left kidney. The mean of ADC value is 1.489 (x 10-3 mm2/s).
3.4. Statistical Analysis
Descriptive statistics were used to calculate all studied variables including age, sex, body weight, serum creatinine, eGFR, and the ADC values. The scatter plot of eGFR and the ADC was plotted, as was Pearson correlation between both factors. The univariate and multivariate linear regression were computed between the eGFR and studied variables. The formula to predict the eGFR was produced by the final model of multivariate linear regression analysis. An online formula for eGFR prediction was also created. All statistical analyses were performed using SAS software.
4. Results
There were 261 patients who met the study criteria, of which 133 patients were male (50.96%). The mean age and body weight (S.D.) of all patients was 59.89 years (13.73) and 55.92 kg (11.17), respectively. The majority of patients had eGFR at 60 - 89 mL/min (107 patients; 41.00%). The average ADC value of all patients was 1.87 × 10⁻³ mm2/s, as shown in Table 1.
| Factors | Values |
|---|---|
| Age, year | 59.89 ± 13.73 |
| Male, sex | 133 (50.96) |
| Body weight, kg | 55.92 ± 11.17 |
| Serum creatinine, mg/dL | 1.01 ± 0.97 |
| eGFR, mL/min | 71.05 ± 32.37 |
| > 90 | 56 (21.46) |
| 60 - 89 | 107 (41.00) |
| 30 - 59 | 78 (29.89) |
| 15 - 29 | 15 (5.75) |
| < 15 | 5 (1.92) |
| ADC, × 10-3 mm2/s | |
| Right kidney | 1.86 ± 0.17 |
| Left kidney | 1.89 ± 0.17 |
| Mean | 1.87 ± 0.15 |
Abbreviation: eGFR, estimated glomerular filtration rate.
aValues are expressed as mean ± SD or No. (%).
The Pearson correlation coefficient between the ADC value and eGFR was 0.7882 (P value < 0.001). Figure 2 shows the scatter plot of the correlation of both factors. There were four factors that were included in the univariate and multivariate linear regression analysis to estimate eGFR: age, sex, bodyweight, and ADC value. Three of these factors (all except sex) were shown to be significant by univariate linear regression analysis. However, all factors were shown to be significantly associated with eGFR by multivariate linear regression analysis. ADC value had the highest estimates at 121.94 (Table 2). The adjusted R square of the multivariate model was 0.7395.
 in mL/min and the apparent diffusion coefficient (ADC) in ×10<sup>-3</sup> mm<sup>2</sup>/s.")
The scatter plot of estimated glomerular filtration rate (eGFR) in mL/min and the apparent diffusion coefficient (ADC) in ×10-3 mm2/s.
Abbreviations: ADC, apparent diffusion coefficient; NA, not applicable.
aUnivariate linear regression analysis.
bMultivariate linear regression analysis.
5. Discussion
This study showed another role of ADC levels to predict eGFR, other than just the cutoff point for renal dysfunction. The ADC values can predict eGFR by using the formula from a multivariate linear regression model. The predicted eGFR = -139.03 - (0.80 × age) - (4.19 × sex; 0 if female and 1 if male) + 0.57 (body weight in kg) + (121.94 × ADC). This formula was also created as an online tool at http://202.28.94.20/gfr/ and the eGFR can be calculated by filling in these four variables.
The ADC values were also correlated with the eGFR linearly (Figure 2) as previously reported (9). The Pearson correlation index in this study was slightly higher than a similar study from China (0.7882 vs 0.709). The high association of the ADCvalues and eGFR was positively correlated with the estimate of 121 by multivariatelinear regression analysis (Table 2). As mentioned earlier, the ADC measurements are directly associated with the Brownian motion of water molecules, capillary perfusion, and tubular flow.
Age is one factor that affects renal function. After the age of 40, the eGFR starts to decline by approximately 8 mL/min per decade. Our formula confirmed this theory (10). With an increase in age of one year, eGFR decreases by 0.80 mL/min or exactly 8 mL/mim per decade (Table 2). Male sex was another factor independently and negatively associated with eGFR, even though it was not a significant factor according to univariate linear analysis. Males tended to have a four times lower eGFR compared with female patients. Additionally, men seemed to have more symptoms of CKD than women. In male patients with eGFR 20 - 30 mL/min, the hematocrit was lowered by 9.4%, while it was only lowered by 5.3% in female patients with the same eGFR level (11).
For every 1 kg increase in bodyweight eGFR was increased by 0.57 mL/min (Table 2). Previous studies showed that obesity increased renal blood flow and also eGFR (12, 13). The hyperfiltration in obese patients may result in renal dysfunction later on. In this study, the correlation between body weight and eGFR may be explained by the fact that those patients with renal dysfunction had lower body weight than those with higher eGFR, as has previously been reported (14). Body weight in this study may not indicate a body mass index.
Radiologists are now able to estimate the patients’eGFR during MRI procedures even without knowing the patients’ serum creatinine levels (14). Moreover, the radiologists may be able to calculate the eGFR of each kidney separately (Table 1). Another advantage is the ability to use an online tool for eGFR calculation based on ADC values. Therefore, radiologists can calculate the eGFR of each kidney and indicate renal dysfunction in patients who routinely performed abdominal MRI for non-renal indications without knowing serum creatinine. Renal pathology was also evaluated in addition to the eGFR.
There are some limitations to this study. The formula may not be universal for all eGFR levels. Most patients in this study were patients with eGFR above 30 mL/min (92.34%). Only 7.67% of patients had eGFR less than 30 mL/min (Table 1). The formula may not be suitable for other ethnicities. Further studies should be performed in other particular ethnicities to formulate the formula.
In conclusion, ADC values can predict eGFR using the following formula: estimated eGFR = -139.03 - (0.80 × age) - (4.19 × sex; [0 if female and 1 if male]) + 0.57 (body weight in kg) + (121.94 × ADC). This formula was also created as an online tool for both mobile and computer at http://202.28.94.20/gfr/.
